You can connect to vCenter Server. You can select Diagnostic or Security assessment base on VMware Security Guideline or vSAN Health or any combination of options base on your requirements. Then collect logs by selecting desired hosts from the inventory and analyze. The successful analysis generates the detailed report having the list of problems and resolutions.

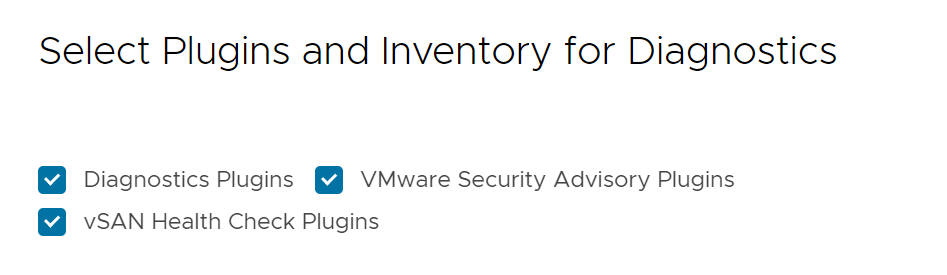
The diagnostics plug-in represents generic category of the problems related to the vSphere operations.

The VMware Security Advisory plug-in represent the security issues identified by VMware Security Advisory.

The vSAN Health plug-in performs vSAN Health related checks and validation.

The VMware Diagnostics plug-in needs log bundle from the target host for the analysis.

The VMware Security Advisory plug-in needs the product build information, that gets collected using API.

For the vSAN Health Checks vSAN related data gets collected using API.

Prerequisites

  • Verify that you have the vSphere user name and password.

  • Make surethat the vSphere user has roles and permissions to collect logs.

  • Make surethat you have login credentials for VMware Skyline Health Diagnostics

  • Verify that you have VCSA appliance root credentials if you are planning to collect logs from the vCenter Server appliance. If the vSphere UI is not accessible use VCSA appliance root credentials.

  • Verify that the vCenter user has following privileges

    • Global.Diagnostics

    • System.View

    • Read Permissions on the inventory objects (Datacenter/Cluster/Host)

Procedure

  1. Log in the VMware Skyline Health Diagnostics UI using the supported browser.
  2. In the top-menu, click Analyze > Connect and Analyze > vCenter / ESXi Details .
  3. Enter the vCenter Server/ESXi Server Hostname or IP address in Host Name/IP field.

    If vCenter or ESXi Server is running on passive services on default port 443, append the port number to the Hostname/IP address with s colon.

    Example: VCENTER_HOSTNAME:PORT

  4. Enter the vCenter Server/ESXi Server user name in the Username field.
  5. Enter the password for the user in the Password field.
  6. Select Skip SSL Check, if you want to skip the SSL verification.
    1. Check Skip SSL Check, if the vCenter uses the self-signed certificate.
  7. Select Connect to vCenter Appliance, if you want to collect logs using VAMI interface and vCenter HTML user interface is not reachable.
    1. For this use case, please use root user account details in step 5 and 6
  8. Click Check Connection. This action validates the credential by performing a login to the given vCenter/ESXi Server.
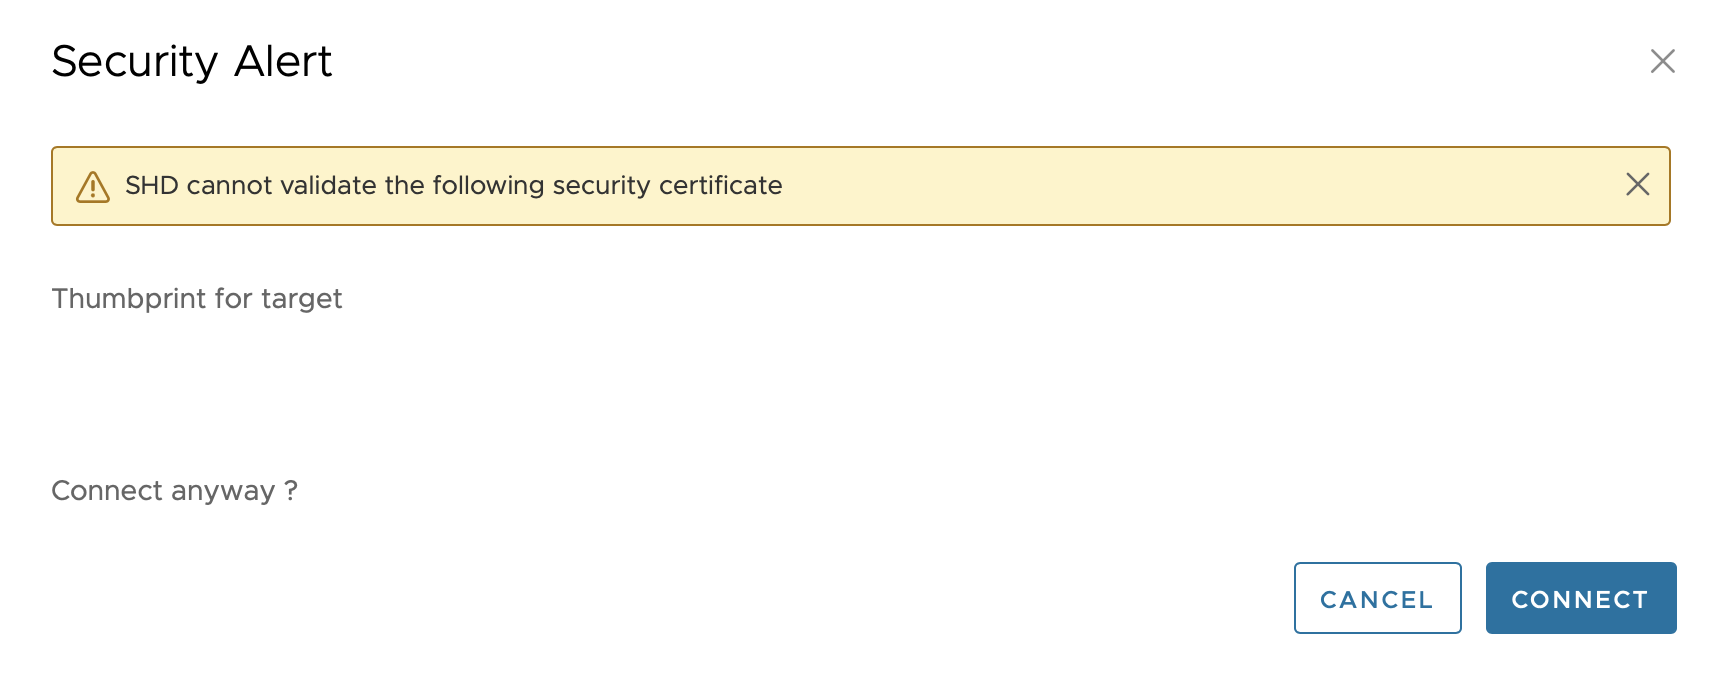
  9. To ensure the connection is happening the intended vCenter the thumbprint of the vCenter Server will be presented to you. You must validate the thumbprint before proceeding further.


  10. If you have successfully validated the thumb print, click CONNECT button to proceed further.
    1. If the connection is successful , the message vSphere API connection is successful. displayed.
    2. If the error is observed while connecting to vCenter, the Run Diagnostics is grayed out and error message displayed.

    Run Diagnostics is enabled if the connection to check is successful.

  11. Click Run Diagnostics.

    Select Inventory windows shows all the hosts available in vCenter including option to collect the diagnostic log bundle form vCenter Server.

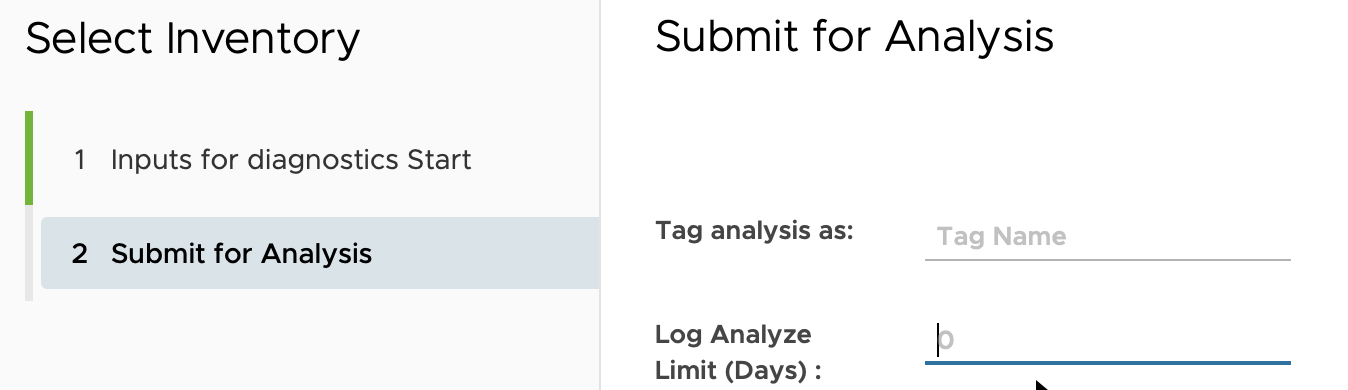
  12. In step 1,Inputs for diagnostics start, Select appropriate plug-ins to run (Diagnostics, VMSA, vSAN Health Check)


  13. To run the diagnostics, select host by clicking the check box of the respective hosts.
  14. Select Include vCenter for Analysis if you want to analyze vCenter (this is required for both Diagnostics and VMware Security Advisory plug-ins).
  15. If vSAN Health Check plug-ins are selected, make sure Include vCenter for Analysis is selected. All vSAN Cluster's part of this vCenter will be analyzed
  16. Click Validate.

    Submit for Analysis window is displayed with count of vCenter & host selected of analysis. If any disconnected hosts are part of inventory, you can click 'BACK' and deselect them.

  17. In step 2 , Submit for Analysis , Provide the Tag Name to remember the analysis. The tagging helps in quick search of the analysis report afterwards.
  18. In step 2 , Submit for Analysis , Provide the Log Analyze Limit (Days) to limit the analysis of logs to the specified number of days from the log collection date. If you do not specify any value, default value is 0 to analyze all the logs. e.g. If you are collection the logs on July 20th and you want to limit the analysis of log from July 10th till July 20th, then you will input value 10 in the Log Analyze Limit (Days)
  19. Click Finish on the Submit for Analysis window.

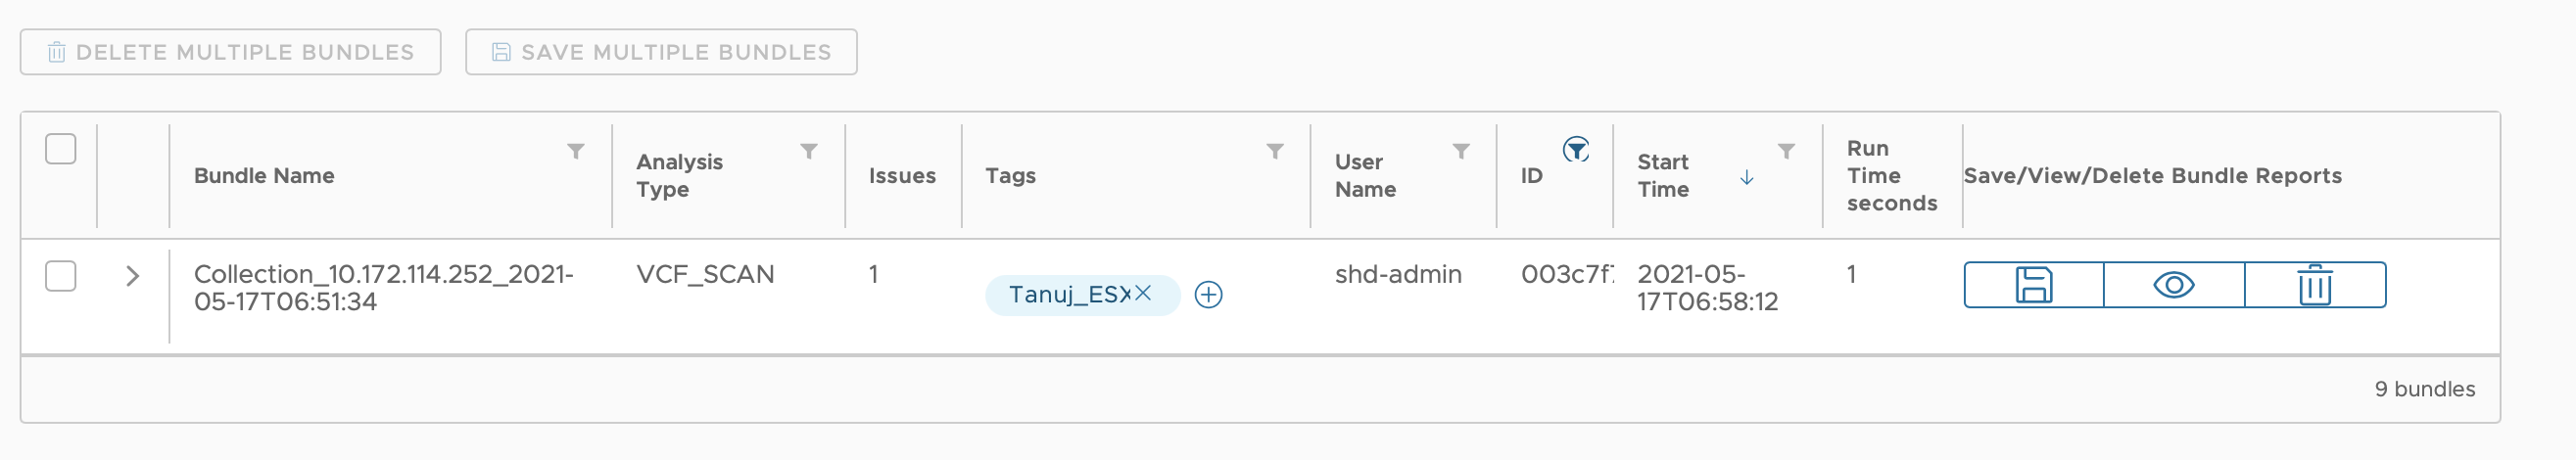
    Download and Analysis starts and VI Admin can see the progress under Tasks follows:

    Figure 1. Tasks View
  20. Once the Analysis is complete, Click Show Report button to see the View Analysis Report icon.
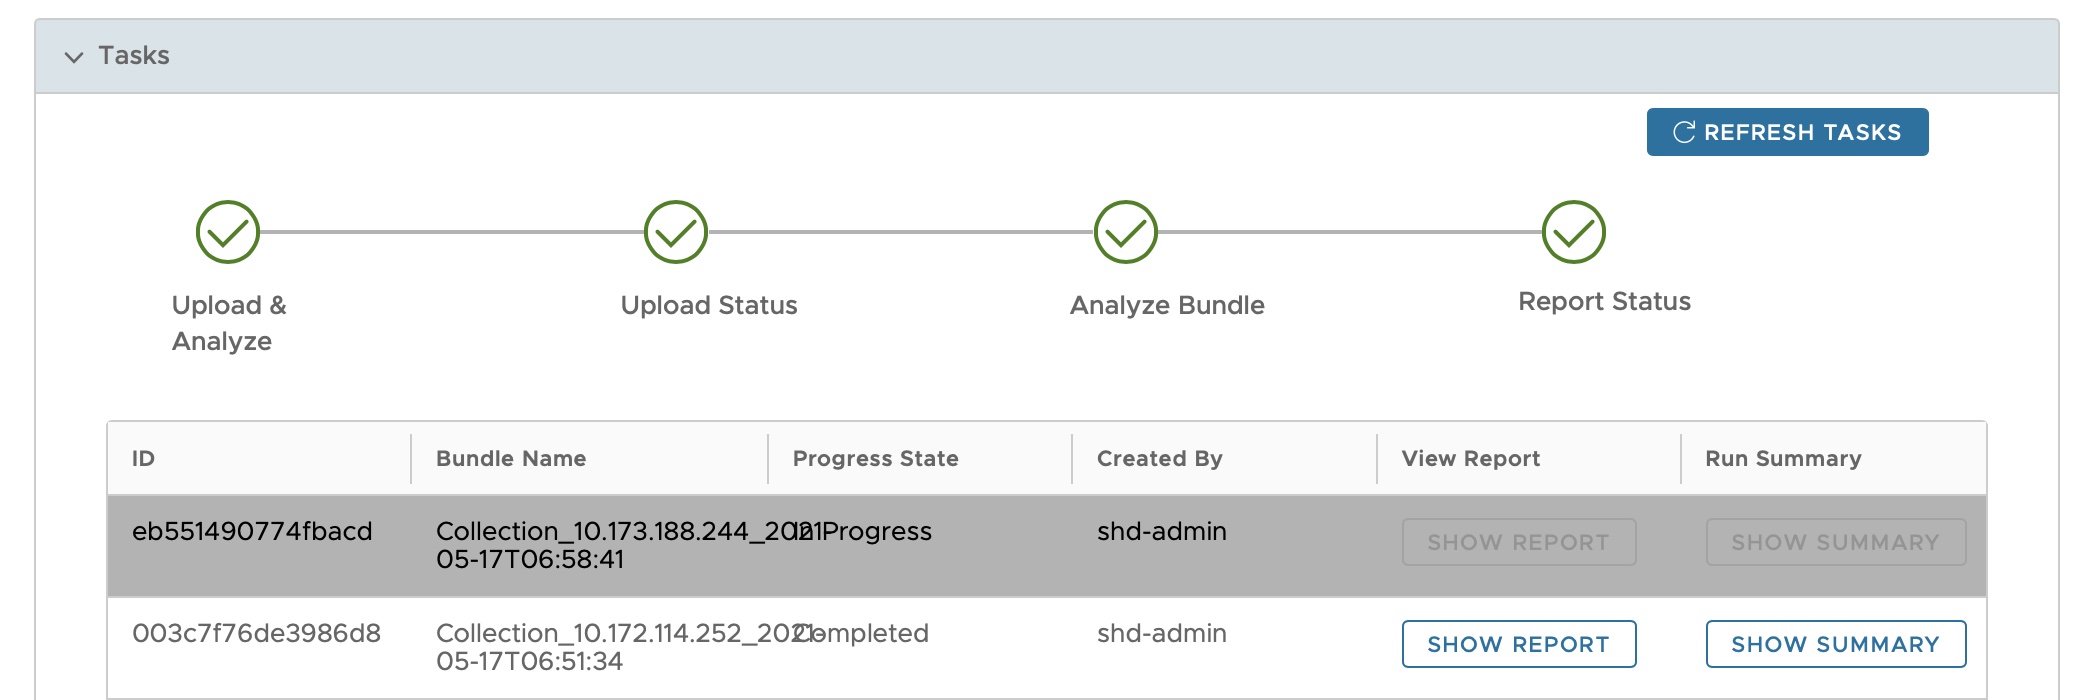
  21. To download the analysis report, click the Download icon.
    Figure 2. Download or View or Delete Report