Smart Assurance Adapter provides some default dashboards for customer to view various metrices. These dashboards can be reached by clicking the Dashboard tab. vROps provides various options to create dash board that user can use for various requirements.
Physical Network Dashboard - Physical Device Details
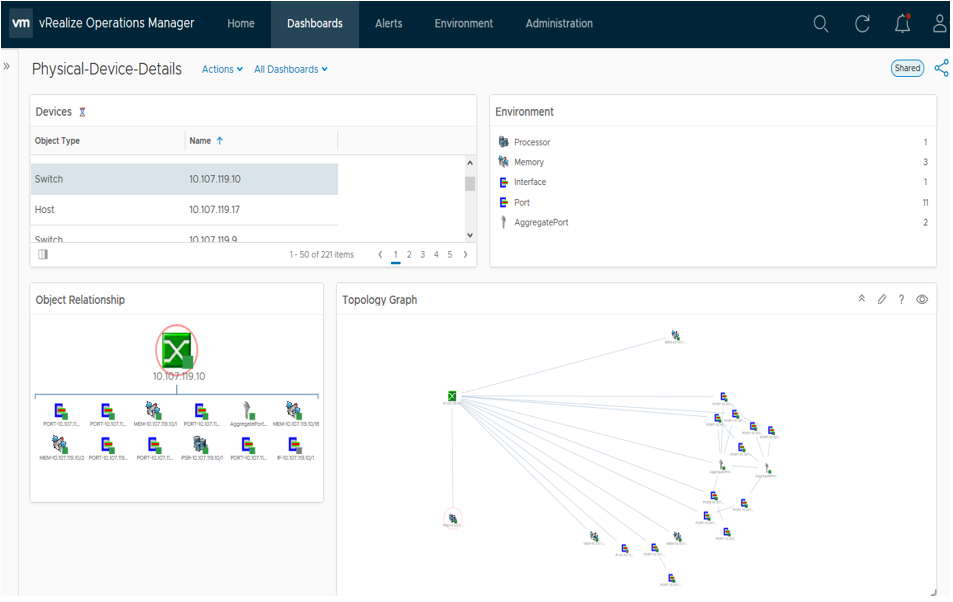
This dashboard displays the various physical network devices and their relationship along with its containment information. The topology graph displays the associated topological elements of the selected physical device.
Physical Network Dashboard - Physical Network Adapters
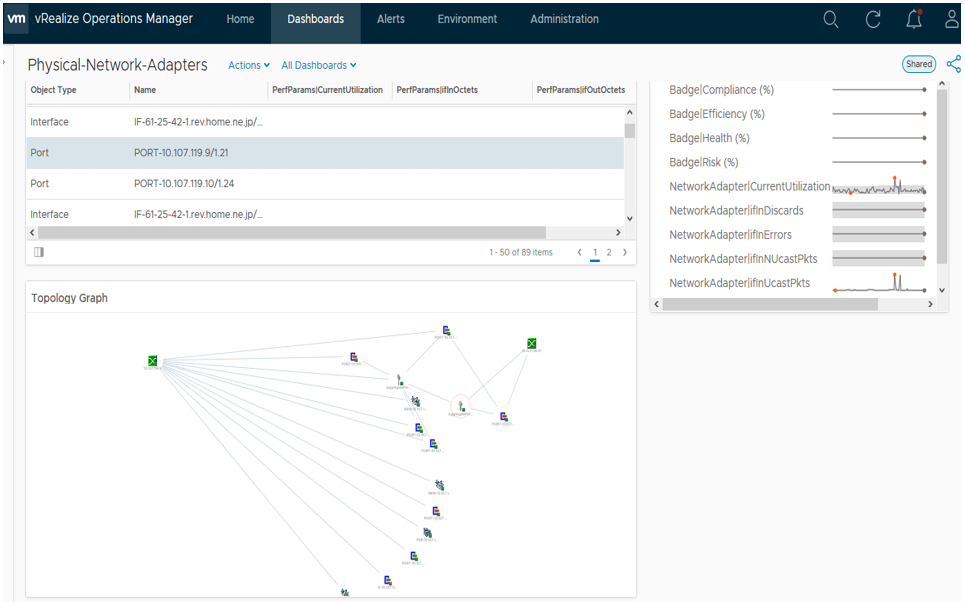
This dashboard displays various network adapters (interface, Port, Aggregate Port ) and it's metrices along with connected topology details. It also displays the collected metrices in a trend graph.
Physical Network Dashboard - Top-N-Adapter-Utilization
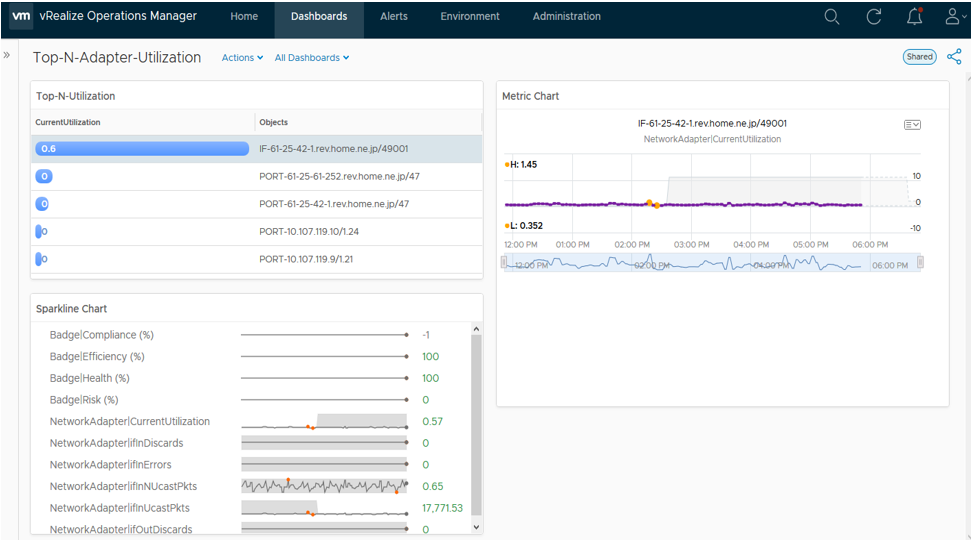
This report displays the Top 5 Network-Adapters that are highly utilized.
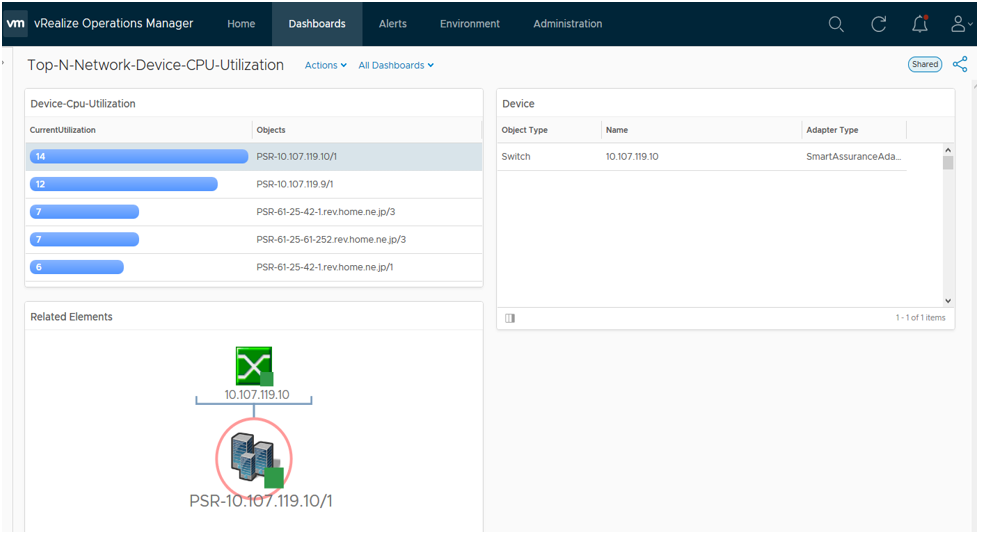
Physical Network Dashboard - Top-N-Network-Device-CPU-Utilization
This report displays the Top 5 CPU that are highly utilized along with the device information.
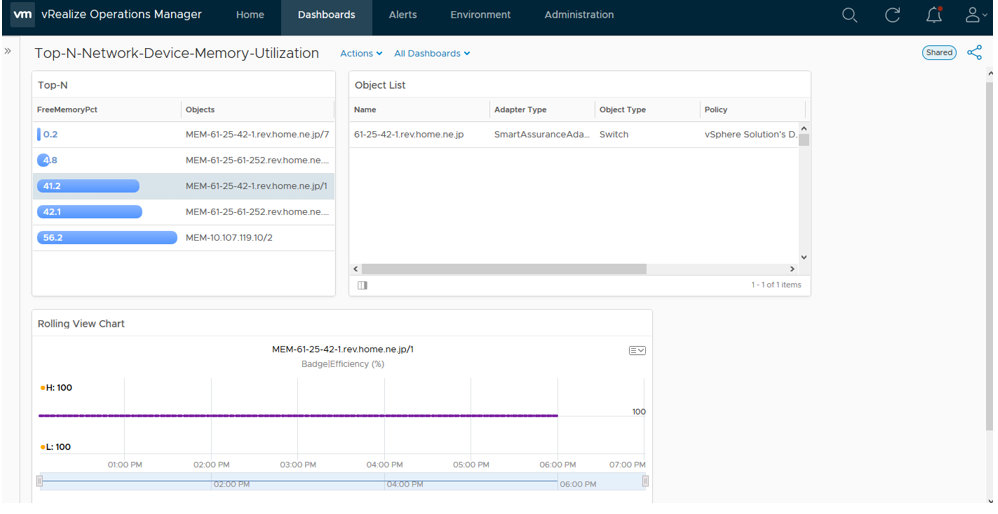
Physical Network Dashboard - Top-N-Network-Device-Memory-Utilization
This report displays the Top 5 Memory that are highly utilized along with the device information.
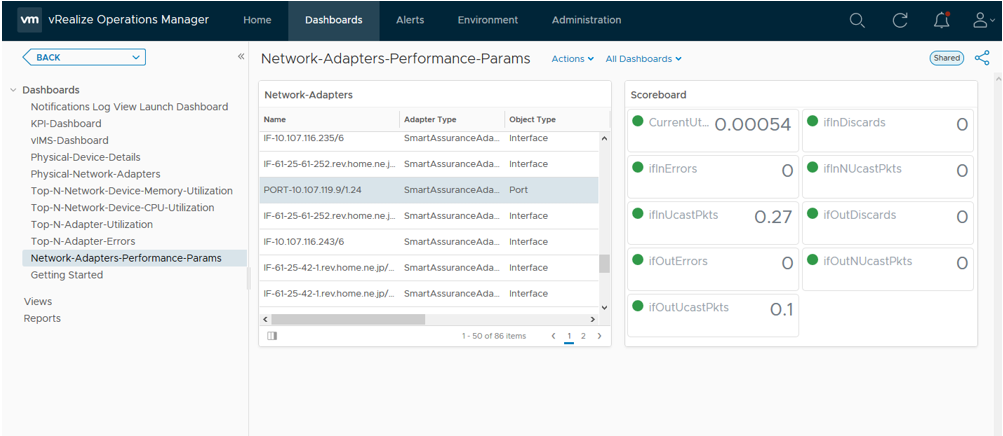
Physical Network Dashboard - Network-Adapters-Performance-Params
This report displays various network adapters and available performance metrices. Upon selecting the adapter, the various collected metrics gets displayed in the right most frame.
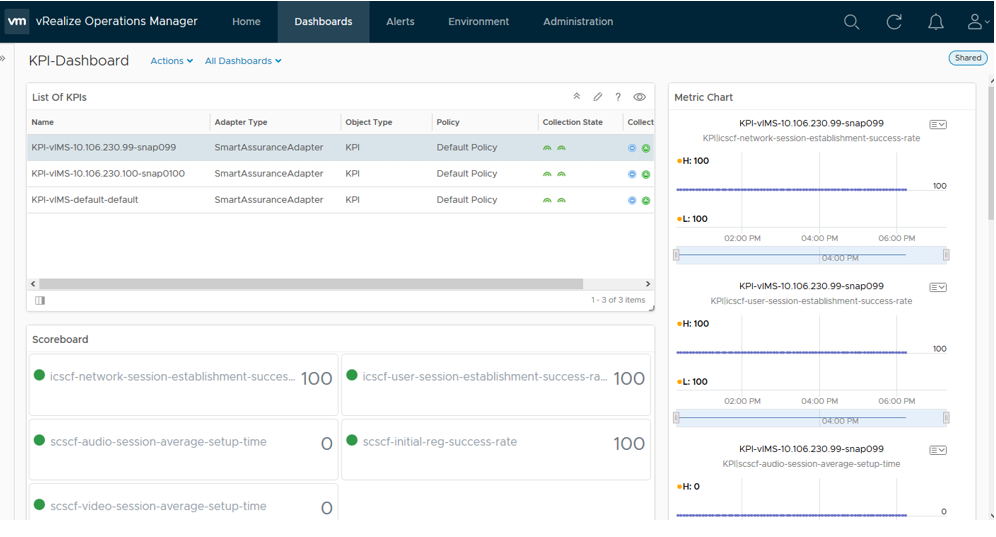
KPI - Dashboards
This dashboard provides the details of KPI collected by Smart Aassurance Adapter. The "List of KPIs" displays the list of KPIs. The Scoreboard displays the current values of various metrices and right most frame provides the metric chart.
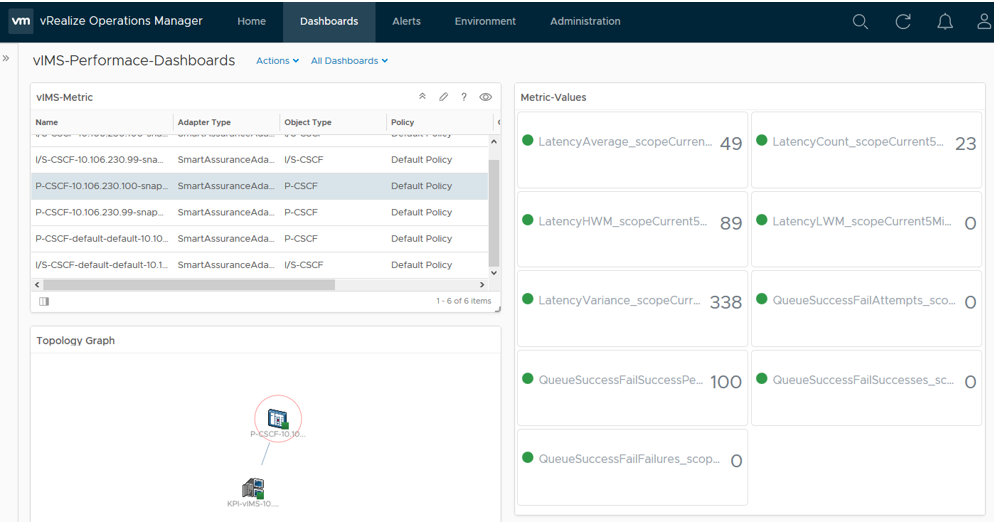
Smart Metric Dashboard
This dashboard provides information about collected metrices of Smart deployment and topology information.