


When viewing the Event Manager, keep in mind that it now automatically refreshes the view when new events occur.
To view System events from the Event Manager,
-
Access the Event Manager using one of the following methods:
-
From the Tools menu bar
-
From the General tab in Device Properties
-
-
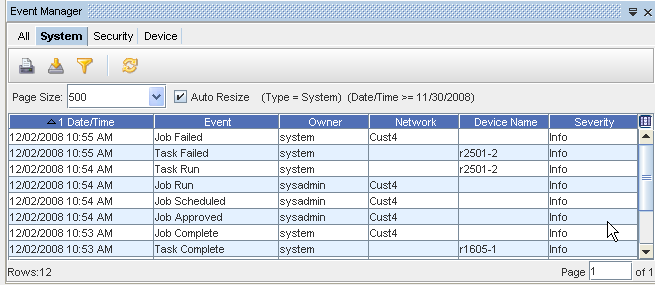
With the System tab selected, you can view the information for all the System Events that have occurred. Notice that along with the Event, the event specifics are displayed, including Date/Time, Owner, Network, Device, and Severity. See Displaying Columns to review the list of columns available for you to display on each tab.
You can also use the Page box at the bottom of the screen to go to any available page in the Events view.
The System tab includes the following System Events:
-
Device Managed State Changed
-
Device Server - Config Change Trap Received
-
Device Server - Task Queued
-
Device Server - Task Run
-
Scheduler Events - Jobs Deleted/Jobs Held/Jobs Modified/Jobs Approved
-
Scheduler Event - Jobs Run - both the job available and the job run time
-
SNMP Trap Received
-
Syslog Message Received
-
Task Create from Workplace (such as push, synch)
