


Here you will find instructions for configuring Spring Cloud Gateway instances to expose tracing (with Zipkin and Grafana) and to generate a set of metrics to help understand behavior in aggregate.
Metrics
Exposing metrics to Wavefront
To expose metrics to Wavefront we need to create a Secret with the following data: wavefront.api-token and wavefront.uri, representing Wavefront's API token and Wavefront's URI endpoint respectively. For example:
apiVersion: v1
kind: Secret
metadata:
  name: metrics-wavefront-secret
data:
  wavefront.api-token: "NWU3ZCFmNjYtODlkNi00N2Y5LWE0YTMtM2U3OTVmM2Y3MTZk"
  wavefront.uri: "aHR0cHM6Ly92bAdhcmUud2F2ZWZyb250LmNvbQ=="
Then, in the SpringCloudGateway kind, reference the secret created in the step before under the metrics section. For example:
apiVersion: "tanzu.vmware.com/v1"
kind: SpringCloudGateway
metadata:
  name: test-gateway-metrics
spec:
  observability:
    metrics:
      wavefront:
        enabled: true
    wavefront:
      secret: metrics-wavefront-secret
      source: my-source
      application: my-shopping-application
      service: gateway-service
After applying the configuration, Wavefront will start receiving the metrics provided by default by Spring Cloud Gateway.
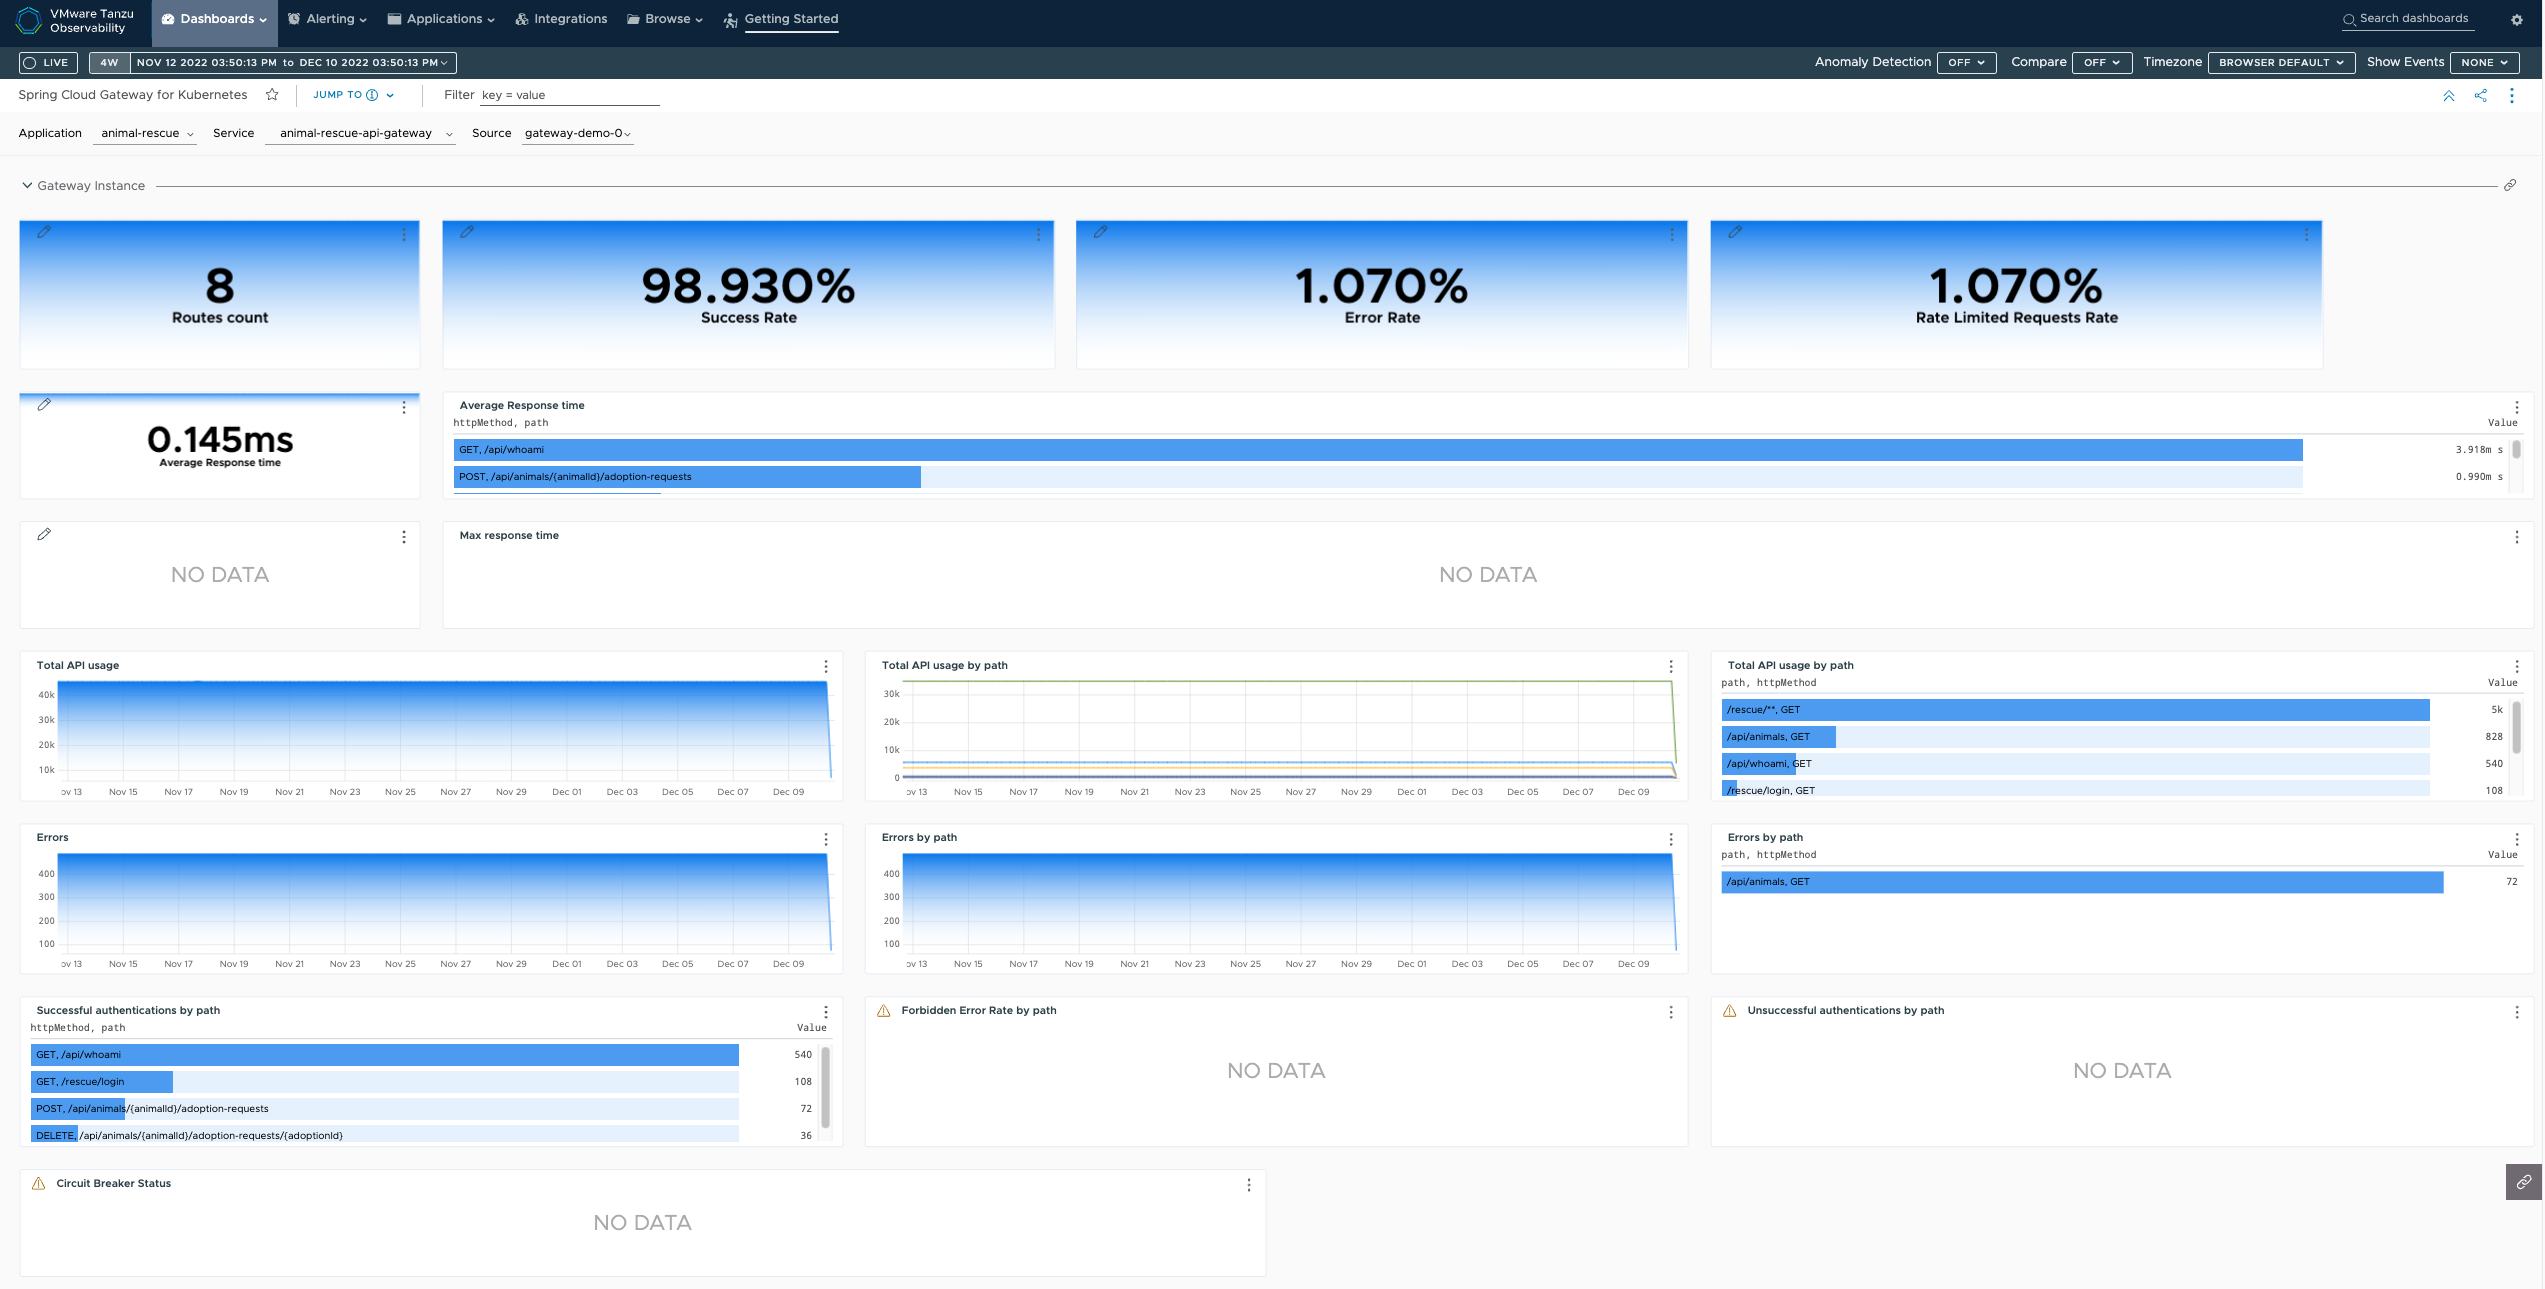
Using the Spring Cloud Gateway for Kubernetes dashboard for Wavefront
Spring Cloud Gateway for Kubernetes has a pre-built dashboard you can use in Wavefront.
If you are using VMware's Wavefront, then you can clone and customize the already created Spring Cloud Gateway for Kubernetes Dashboard.
Alternatively, you can use the Wavefront template which resides in a dashboards folder inside Spring Cloud Gateway for Kubernetes release artifacts.
To import it, you must create an API Token. See the Wavefront documentation. Then execute the following command:
curl -XPOST 'https://vmware.wavefront.com/api/v2/dashboard' --header "Authorization: Bearer ${WAVEFRONT_API_TOKEN}" --header "Content-Type: application/json" -d "@wavefront-spring-cloud-gateway-for-kubernetes.json"
Exposing metrics to Prometheus
To expose metrics to Prometheus we need to add a prometheus section in the SpringCloudGateway kind and if we want scrapping annotations to be added into the gateway pods, for example:
apiVersion: "tanzu.vmware.com/v1"
kind: SpringCloudGateway
metadata:
  name: test-gateway-metrics
spec:
  observability:
    metrics:
      prometheus:
        enabled: true
        serviceMonitor:
          enabled: true
          labels:
            team: backend-team
After applying this configuration, the Prometheus actuator endpoint will be available at /actuator/prometheus, serviceMonitor will expose a service on port 8090 to access the endpoint. You can use labels in order to propagate them to Prometheus.
If, in addition to this, we want the scrapping annotations to be added to all the Spring Cloud Gateway Pods, we should create our Prometheus configurations with annotations set to true, for example:
apiVersion: "tanzu.vmware.com/v1"
kind: SpringCloudGateway
metadata:
  name: test-gateway-metrics-with-annotations
spec:
  observability:
    metrics:
      prometheus:
        enabled: true
        serviceMonitor:
          enabled: true
        annotations:
          enabled: true
This will add the following annotations to every Spring Cloud Gateway Pod:
   annotations:
     prometheus.io/scrape: "true"
     prometheus.io/path: "/actuator/prometheus"
     prometheus.io/port: "8090"
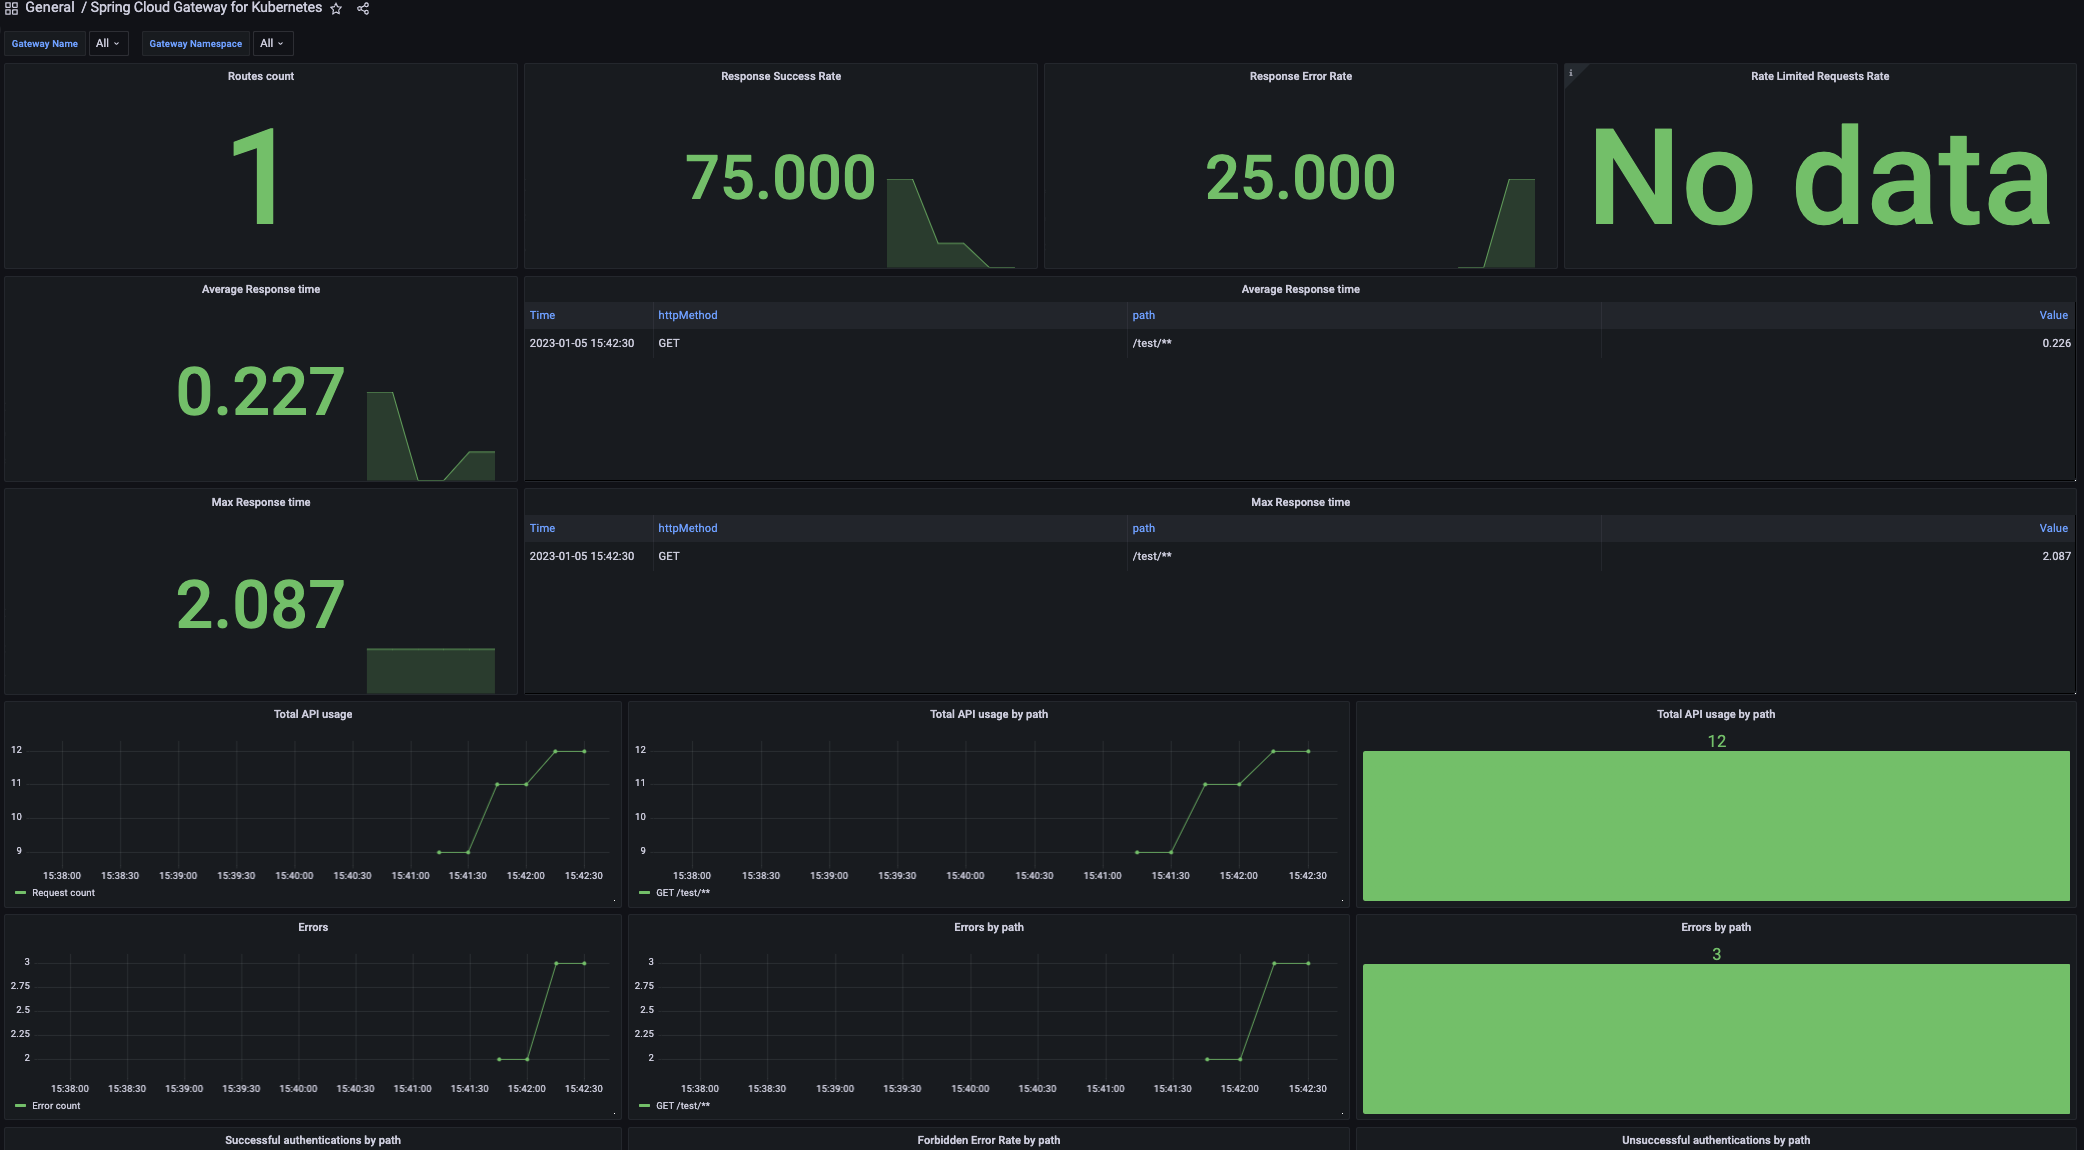
Using the Spring Cloud Gateway for Kubernetes dashboard for Grafana
You can find a dashboards folder inside Spring Cloud Gateway for Kubernetes release artifacts which contains a Grafana template.
To import it, follow the instructions in the Grafana documentation.
Tracing
Exposing tracing to Wavefront
To expose tracing to Wavefront we need to create a Secret with the following data: wavefront.api-token and wavefront.uri, representing Wavefront's API token and Wavefront's URI endpoint respectively. For example:
apiVersion: v1
kind: Secret
metadata:
  name: tracing-wavefront-secret
data:
  wavefront.api-token: "NWU3ZCFmNjYtODlkNi00N2Y5LWE0YTMtM2U3OTVmM2Y3MTZk"
  wavefront.uri: "aHR0cHM6Ly92bAdhcmUud2F2ZWZyb250LmNvbQ=="
Then, in the SpringCloudGateway kind, reference the secret created in the step before under the tracing section. For example:
apiVersion: "tanzu.vmware.com/v1"
kind: SpringCloudGateway
metadata:
  name: test-gateway-tracing
spec:
  observability:
    tracing:
      wavefront:
        enabled: true
    wavefront:
      secret: tracing-wavefront-secret
      source: my-source
      application: my-shopping-application
      service: gateway-service
After applying the configuration, Wavefront will start receiving the traces. See the Wavefront Tracing Basics
Note By default, the trace context is propagated via B3 Propagation. You configure this by setting the environment variable management.tracing.propagation.type to either b3 or w3c.
Note By default, only 10% of requests are sampled. You configure this by setting the environment variable management.tracing.sampling.probability to a float between 0 and 1.0.
Exposing tracing to Zipkin
To expose tracing to Zipkin by providing the Zipkin url under the observability spec:
apiVersion: "tanzu.vmware.com/v1"
kind: SpringCloudGateway
metadata:
  name: test-gateway-tracing
spec:
  observability:
    tracing:
      zipkin:
        enabled: true
        url: "http://zipkin.default.svc.cluster.local:9411/api/v2/spans"
Note There are currently no supported authentication mechanisms.
Note By default, the trace context is propagated via B3 Propagation. You configure this by setting the environment variable management.tracing.propagation.type to either b3 or w3c.
Note By default, only 10% of requests are sampled. You configure this by setting the environment variable management.tracing.sampling.probability to a float between 0 and 1.0.
Using Gateway Metrics Filter
VMware Spring Cloud Gateway for Kubernetes offers a gateway metrics filter running by default as long as the spring.cloud.gateway.metrics.enabled property is not set to false. This filter adds a timer metric named spring.cloud.gateway.requests with the following tags:
routeId: The route ID.routeUri: The URI to which the API is routed.outcome: The outcome, as classified byHttpStatus.Series.status: The HTTP status of the request returned to the client.httpStatusCode: The HTTP Status of the request returned to the client.httpMethod: The HTTP method used for the request.
These metrics are then available using the actuator metrics endpoint /actuator/metrics/spring.cloud.gateway.requests. And an extra route count metric will be available from /actuator/metrics/spring.cloud.gateway.routes.count.
In addition, through the spring.cloud.gateway.metrics.tags.path.enabled property (by default, false), you can activate an extra metric with the path tag:
path: The path of the request.
