Use a Grafana dashboard for Tanzu Application Platform observability
This topic tells you how to configure and set up a public Grafana-Prometheus Helm with Tanzu Application Platform (commonly known as TAP) CustomResource metrics collection.
Prerequisites
Before proceeding you must have:
- kubectl
- Helm
- A Kubernetes cluster with Tanzu Application Platform and associated workloads
Download and unzip the Tanzu CLI binary
To download the Tanzu CLI binary and set up the cluster:
-
Download
prometheus-grafana-dashboard-for-tap-1.0.0-beta.1.zipfrom the Broadcom Support Portal. -
If on macOS or Linux, unzip
prometheus-grafana-dashboard-for-tap-1.0.0-beta.1.zip. If you’re using Windows, use the Windows extractor tool to unzip it.
Install a public Helm chart
To install a public Helm chart:
-
Apply
tap-metrics.yamlon the Tanzu Application Platform cluster, which enables collection of the Tanzu Application PlatformCustomResourcemetrics. -
Install a public Helm chart for Prometheus with a public HTTP endpoint in all Tanzu Application Platform clusters where necessary for observability.
For example, if you have a View cluster, a Build cluster, and a Run cluster:
-
Set the context to View cluster and install the Prometheus public Helm chart by running:
# Add Prometheus helm repo helm repo add prometheus-community https://prometheus-community.github.io/helm-charts helm repo update # Install prometheus chart helm install prometheus -f DOWNLOADED-TAP-METRICS-YAML-FILE \ prometheus-community/kube-prometheus-stack --namespace tap-monitoring --create-namespace -
Repeat the previous step for the Build cluster and the Run cluster.
-
You now have a Prometheus endpoint, for each cluster, which acts as a data source for Grafana in later steps. See the public LoadBalancer IP
<PUBLIC_ENDPOINT>in each cluster where Prometheus is installed by running:kubectl get svc -n tap-monitoring | grep prometheusExample output:
$ kubectl get svc -n tap-monitoring | grep prometheus
prometheus-operated                          ClusterIP      None           <none>            9090/TCP                        20h
tap-observability-kube-pro-prometheus        LoadBalancer   10.0.19.222    <PUBLIC_ENDPOINT> 9090:32357/TCP,8080:31323/TCP   20h
tap-observability-prometheus-node-exporter   ClusterIP      10.0.34.213    <none>            9100/TCP                        20h
Note
This example is given only for HTTP endpoints exposed publicly. Your own security policy might require private endpoints, a TLS mechanism, or other restrictions.
-
Create a Grafana dashboard
To create a Grafana dashboard:
-
Create
grafana-values.yamlwith the following content to establish the Prometheus endpoints with the port (9090 by default for Prometheus):datasources: datasources.yaml: apiVersion: 1 datasources: - name: prometheus-view-cluster type: prometheus url: VIEW-CLUSTER-PROMETHEUS-ENDPOINT:9090 access: proxy isDefault: true - name: prometheus-build-cluster type: prometheus url: BUILD-CLUSTER-PROMETHEUS-ENDPOINT:9090 access: proxy isDefault: false - name: prometheus-run-cluster type: prometheus url: RUN-CLUSTER-PROMETHEUS-ENDPOINT:9090 access: proxy isDefault: false -
Install Grafana in a cluster dedicated to the Grafana dashboard by running:
kubectl create ns grafana

# Add Grafana Helm repository
helm repo add grafana https://grafana.github.io/helm-charts
helm repo update

# Install the chart by setting your Grafana password
helm install grafana grafana/grafana \
  --namespace grafana \
  --set persistence.storageClassName=DEFAULT-PVC-STORAGE-CLASS \
  --set persistence.enabled=true \
  --set adminPassword='GRAFANA-ENDPOINT-PASSWORD' \
  --values  grafana-values.yaml \
  --set service.type=LoadBalancer
Where:
DEFAULT-PVC-STORAGE-CLASSis the default PVC storage class. For some examples there isdefaultfor Azure,gp2for Amazon Web Services, and so on.GRAFANA-ENDPOINT-PASSWORDis the password for logging in to the Grafana endpoint.
If any auto-generate mechanism is used, you can get your Grafana user ID and password by running:
kubectl get secret --namespace grafana grafana -o jsonpath="{.data.admin-password}" | base64 \ --decode ; echo -
Access the Grafana UI by using the
<PUBLIC_ENDPOINT>created by the default LoadBalancer. This can be configured behind any ingress service.kubectl get svc -n grafana NAME TYPE CLUSTER-IP EXTERNAL-IP PORT(S) AGE grafana LoadBalancer 10.0.133.110 <PUBLIC_ENDPOINT> 80:31147/TCP 20h -
Log in to the Grafana UI through the endpoint and configured user name and password. The default user name is
admin.
Import the Grafana dashboard
To import TAP_Metrics_Grafana_Dashboard.json from the Tanzu Application Platform artifact you downloaded earlier:
-
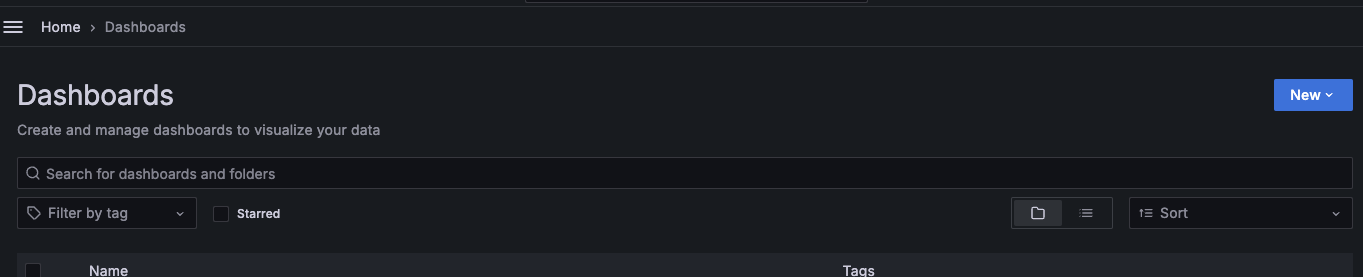
Go to the Dashboards page.
-
Click New > Import.
-
Select and import the dashboard downloaded earlier named
TAP_Metrics_Grafana_Dashboard.json.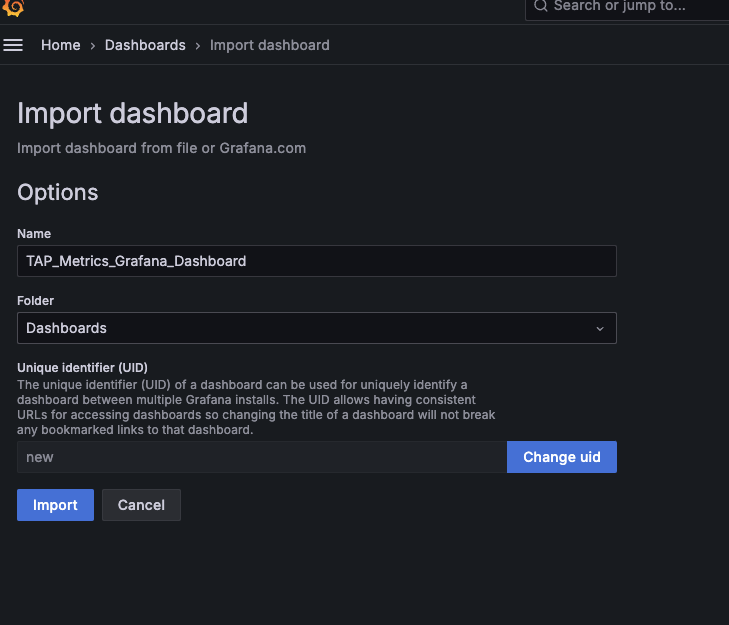
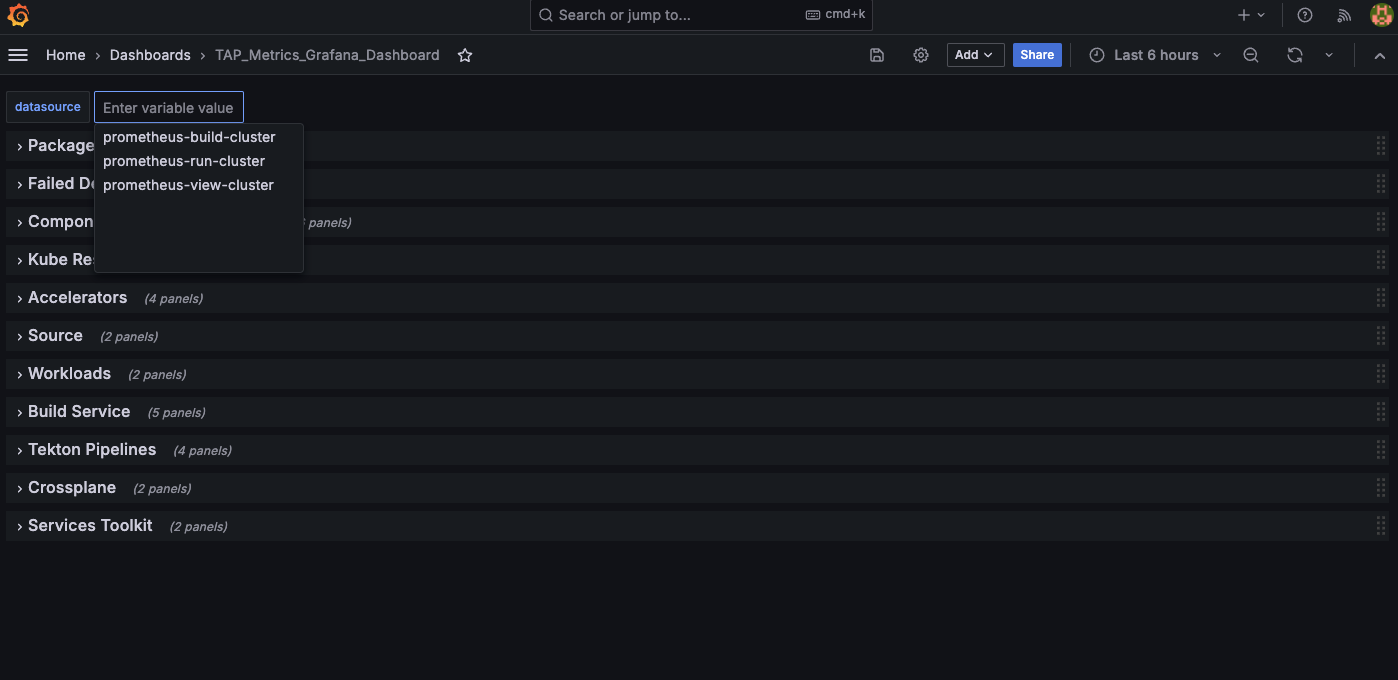
-
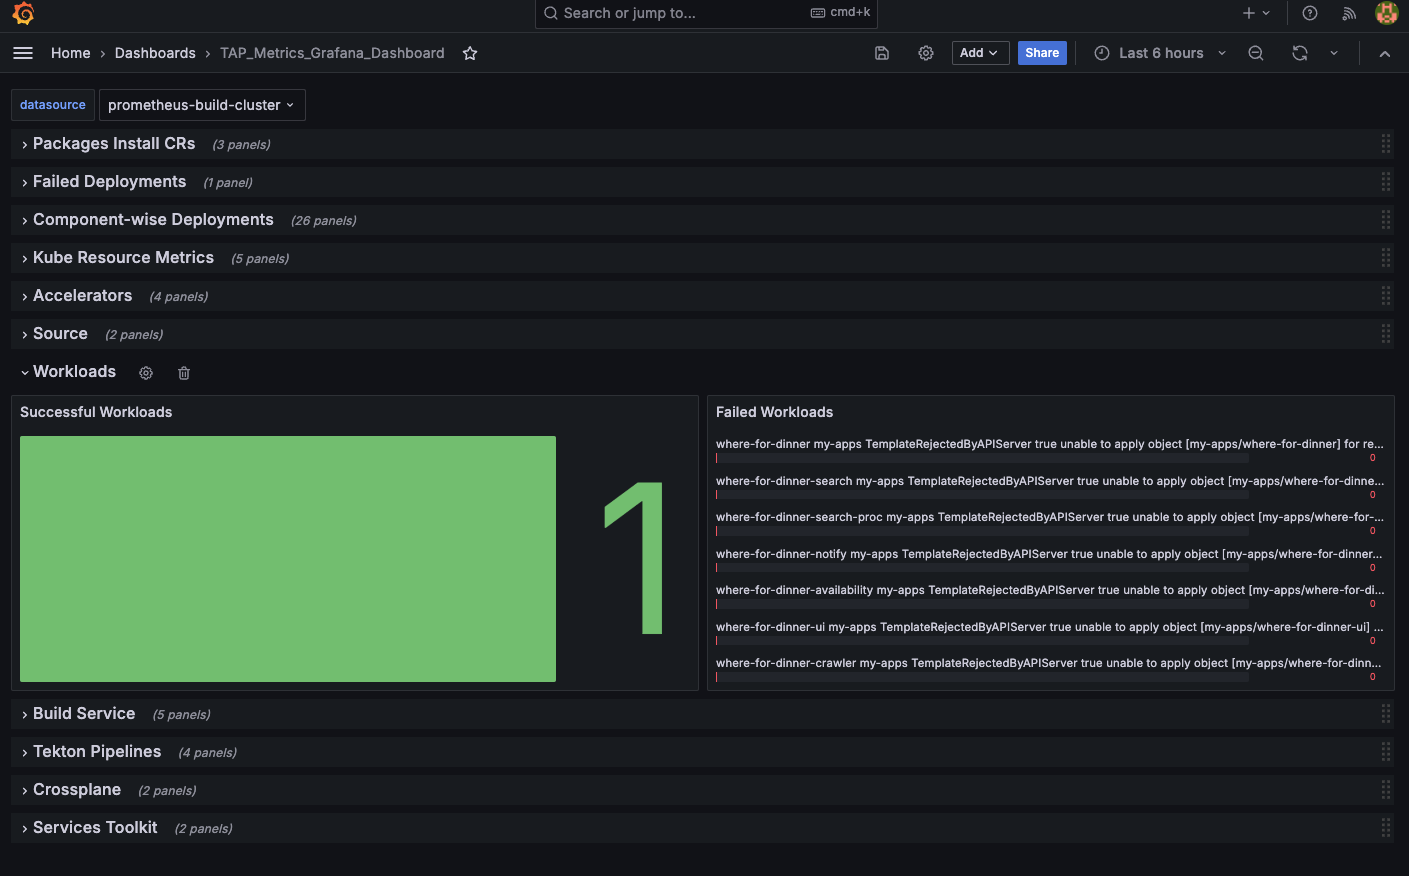
View the Tanzu Application Platform health dashboard for different Tanzu Application Platform clusters by selecting the appropriate datasource.
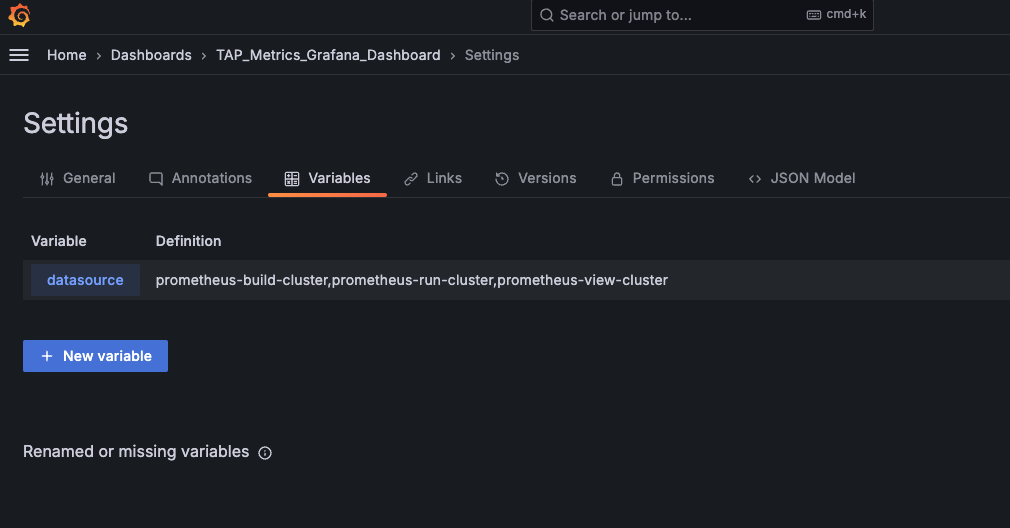
(Optional) Use your own datasources
To use your own set of datasources:
-
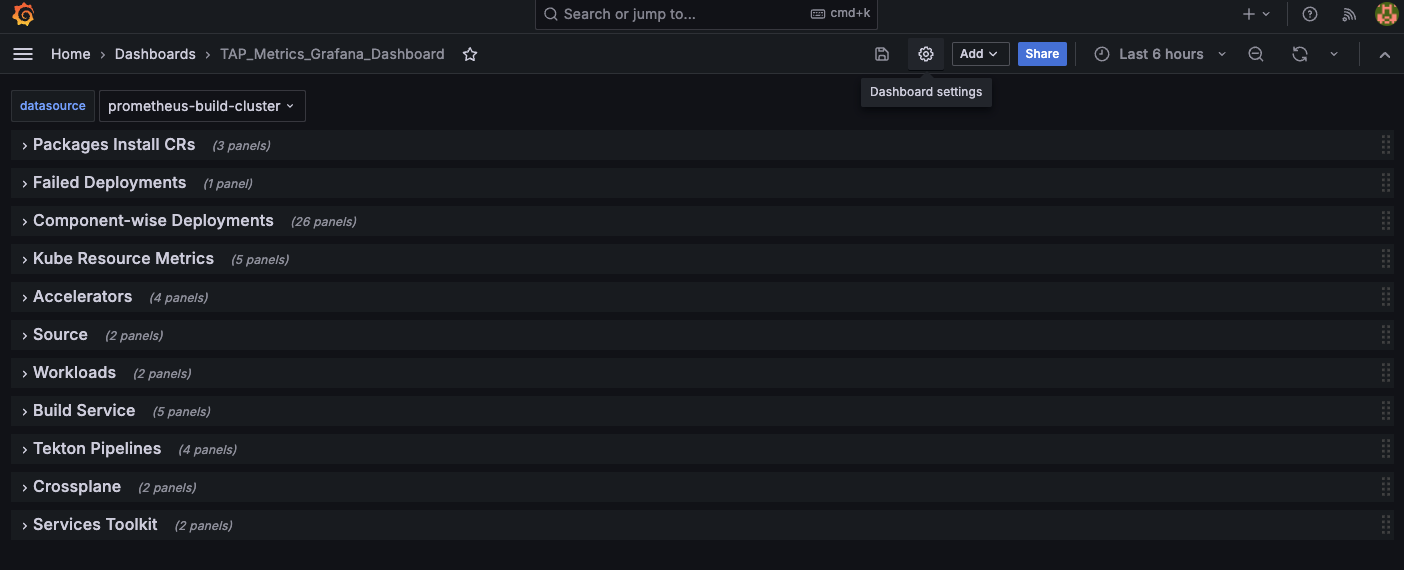
Go to Dashboard Settings.
-
Go to the Variables tab, click the datasource variable, and then update the proper datasource names in the datasource variable.