


Application Live View for Spring Boot Applications in Tanzu Developer Portal
This topic tells you about the Application Live View pages for Spring Boot Applications in Tanzu Developer Portal.
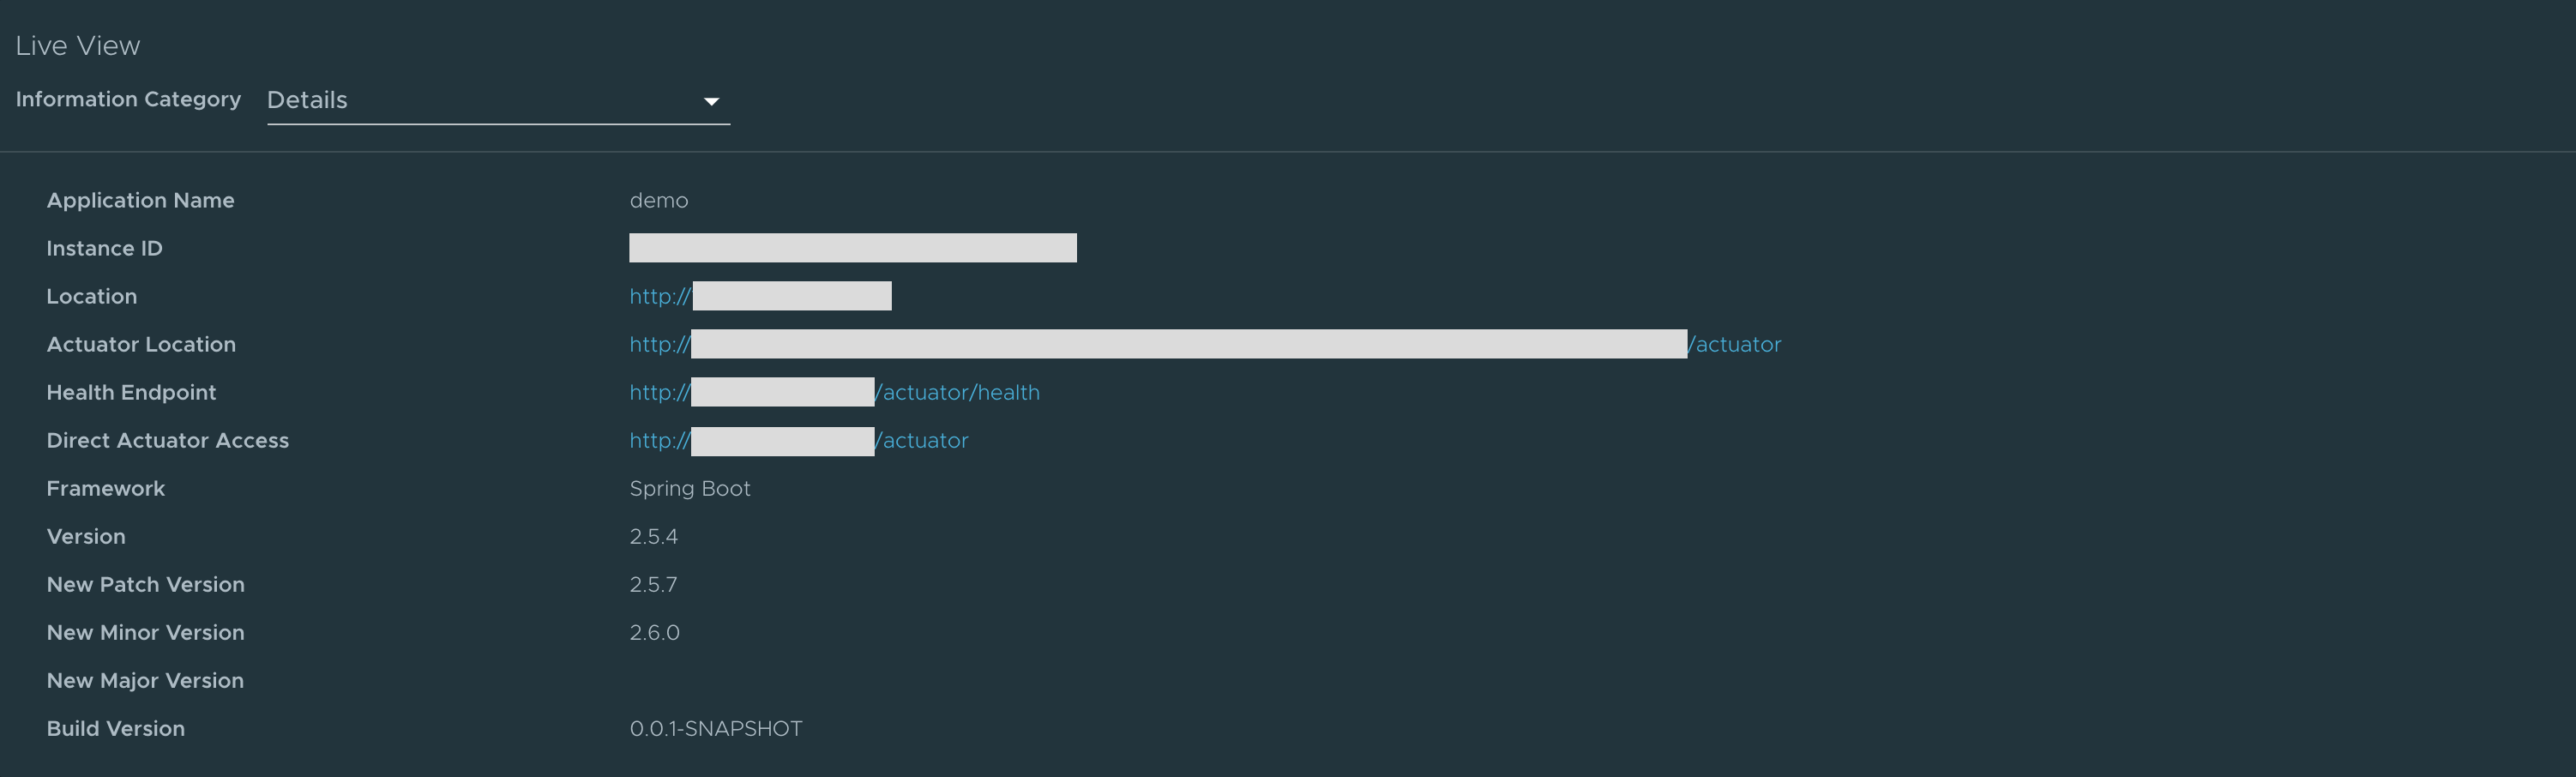
Details page
This is the default page loaded in the Live View section. This page gives a tabular overview containing the following information:
- application name
- instance ID
- location
- actuator location
- health endpoint
- direct actuator access
- framework
- version
- new patch version
- new major version
- build version
You can navigate between Information Categories by selecting from the drop-down menu on the top right corner of the page.
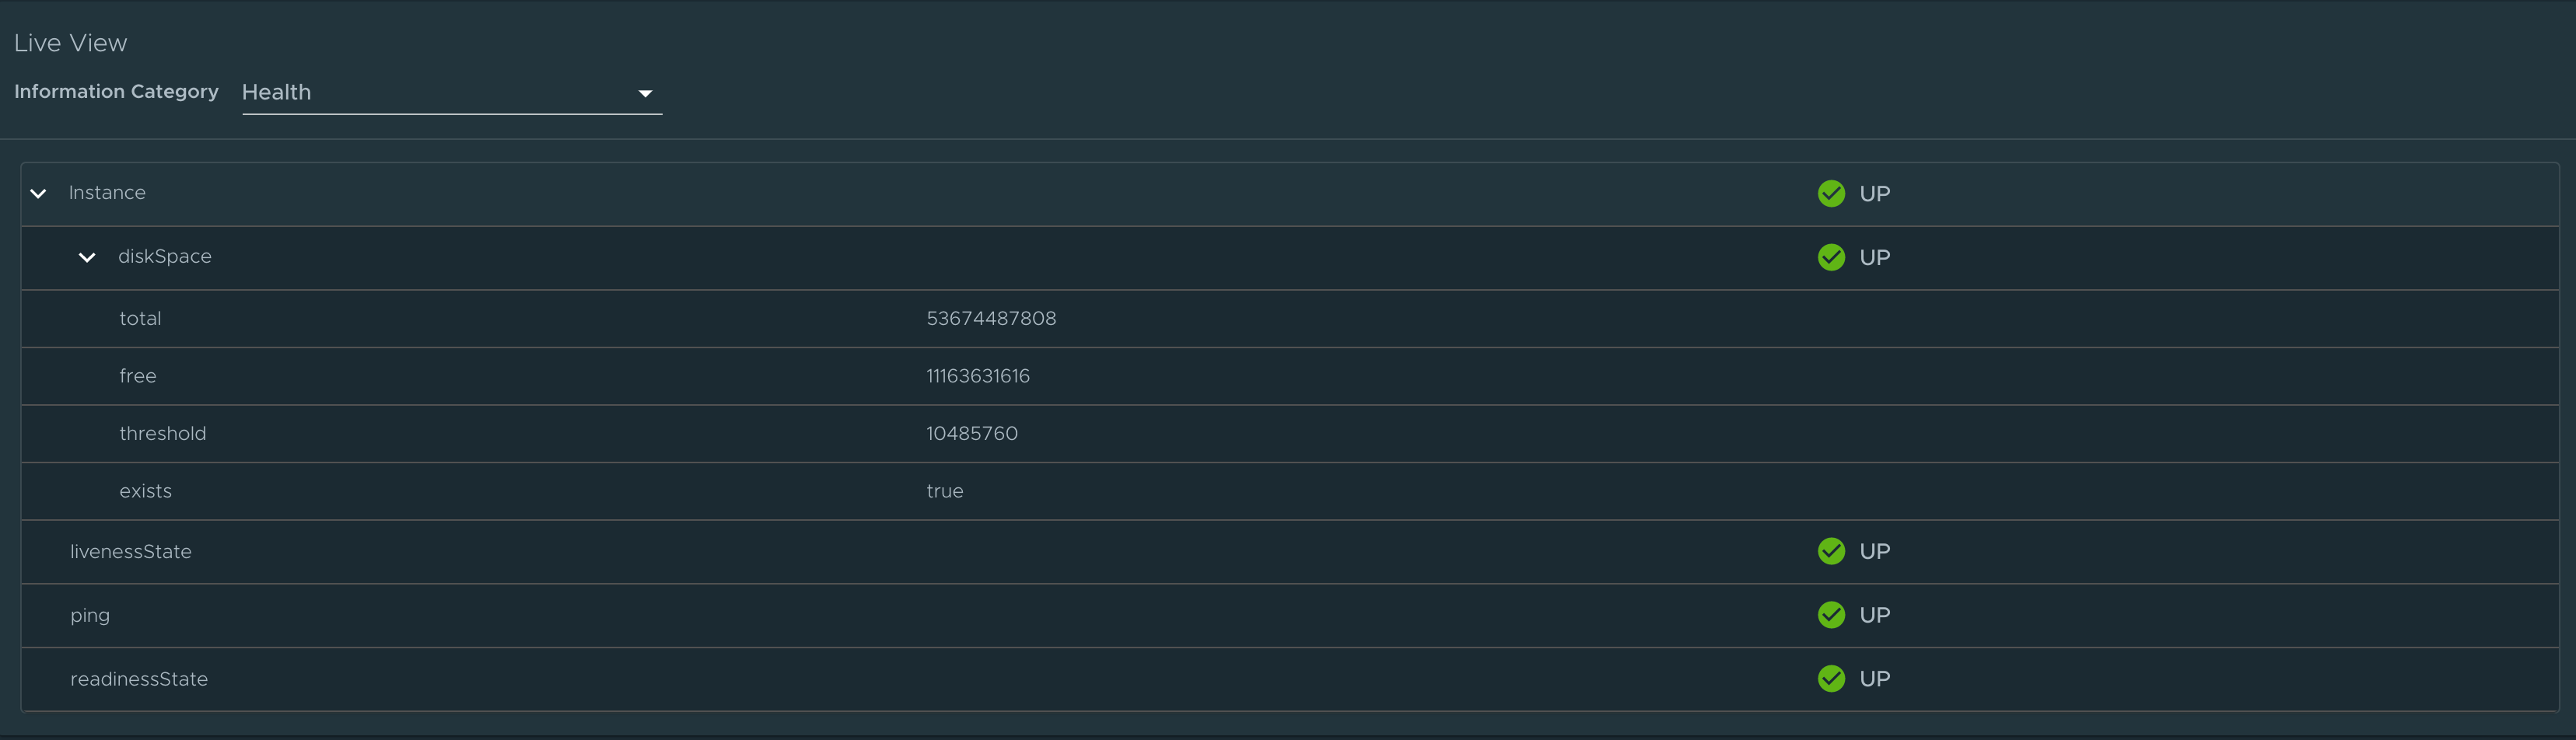
Health page
To go to the health page, select the Health option from the Information Category drop-down menu. The health page provides detailed information about the health of the application. It lists all the components that make up the health of the application such as readiness, liveness, and disk space. It displays the status and details associated with each component.
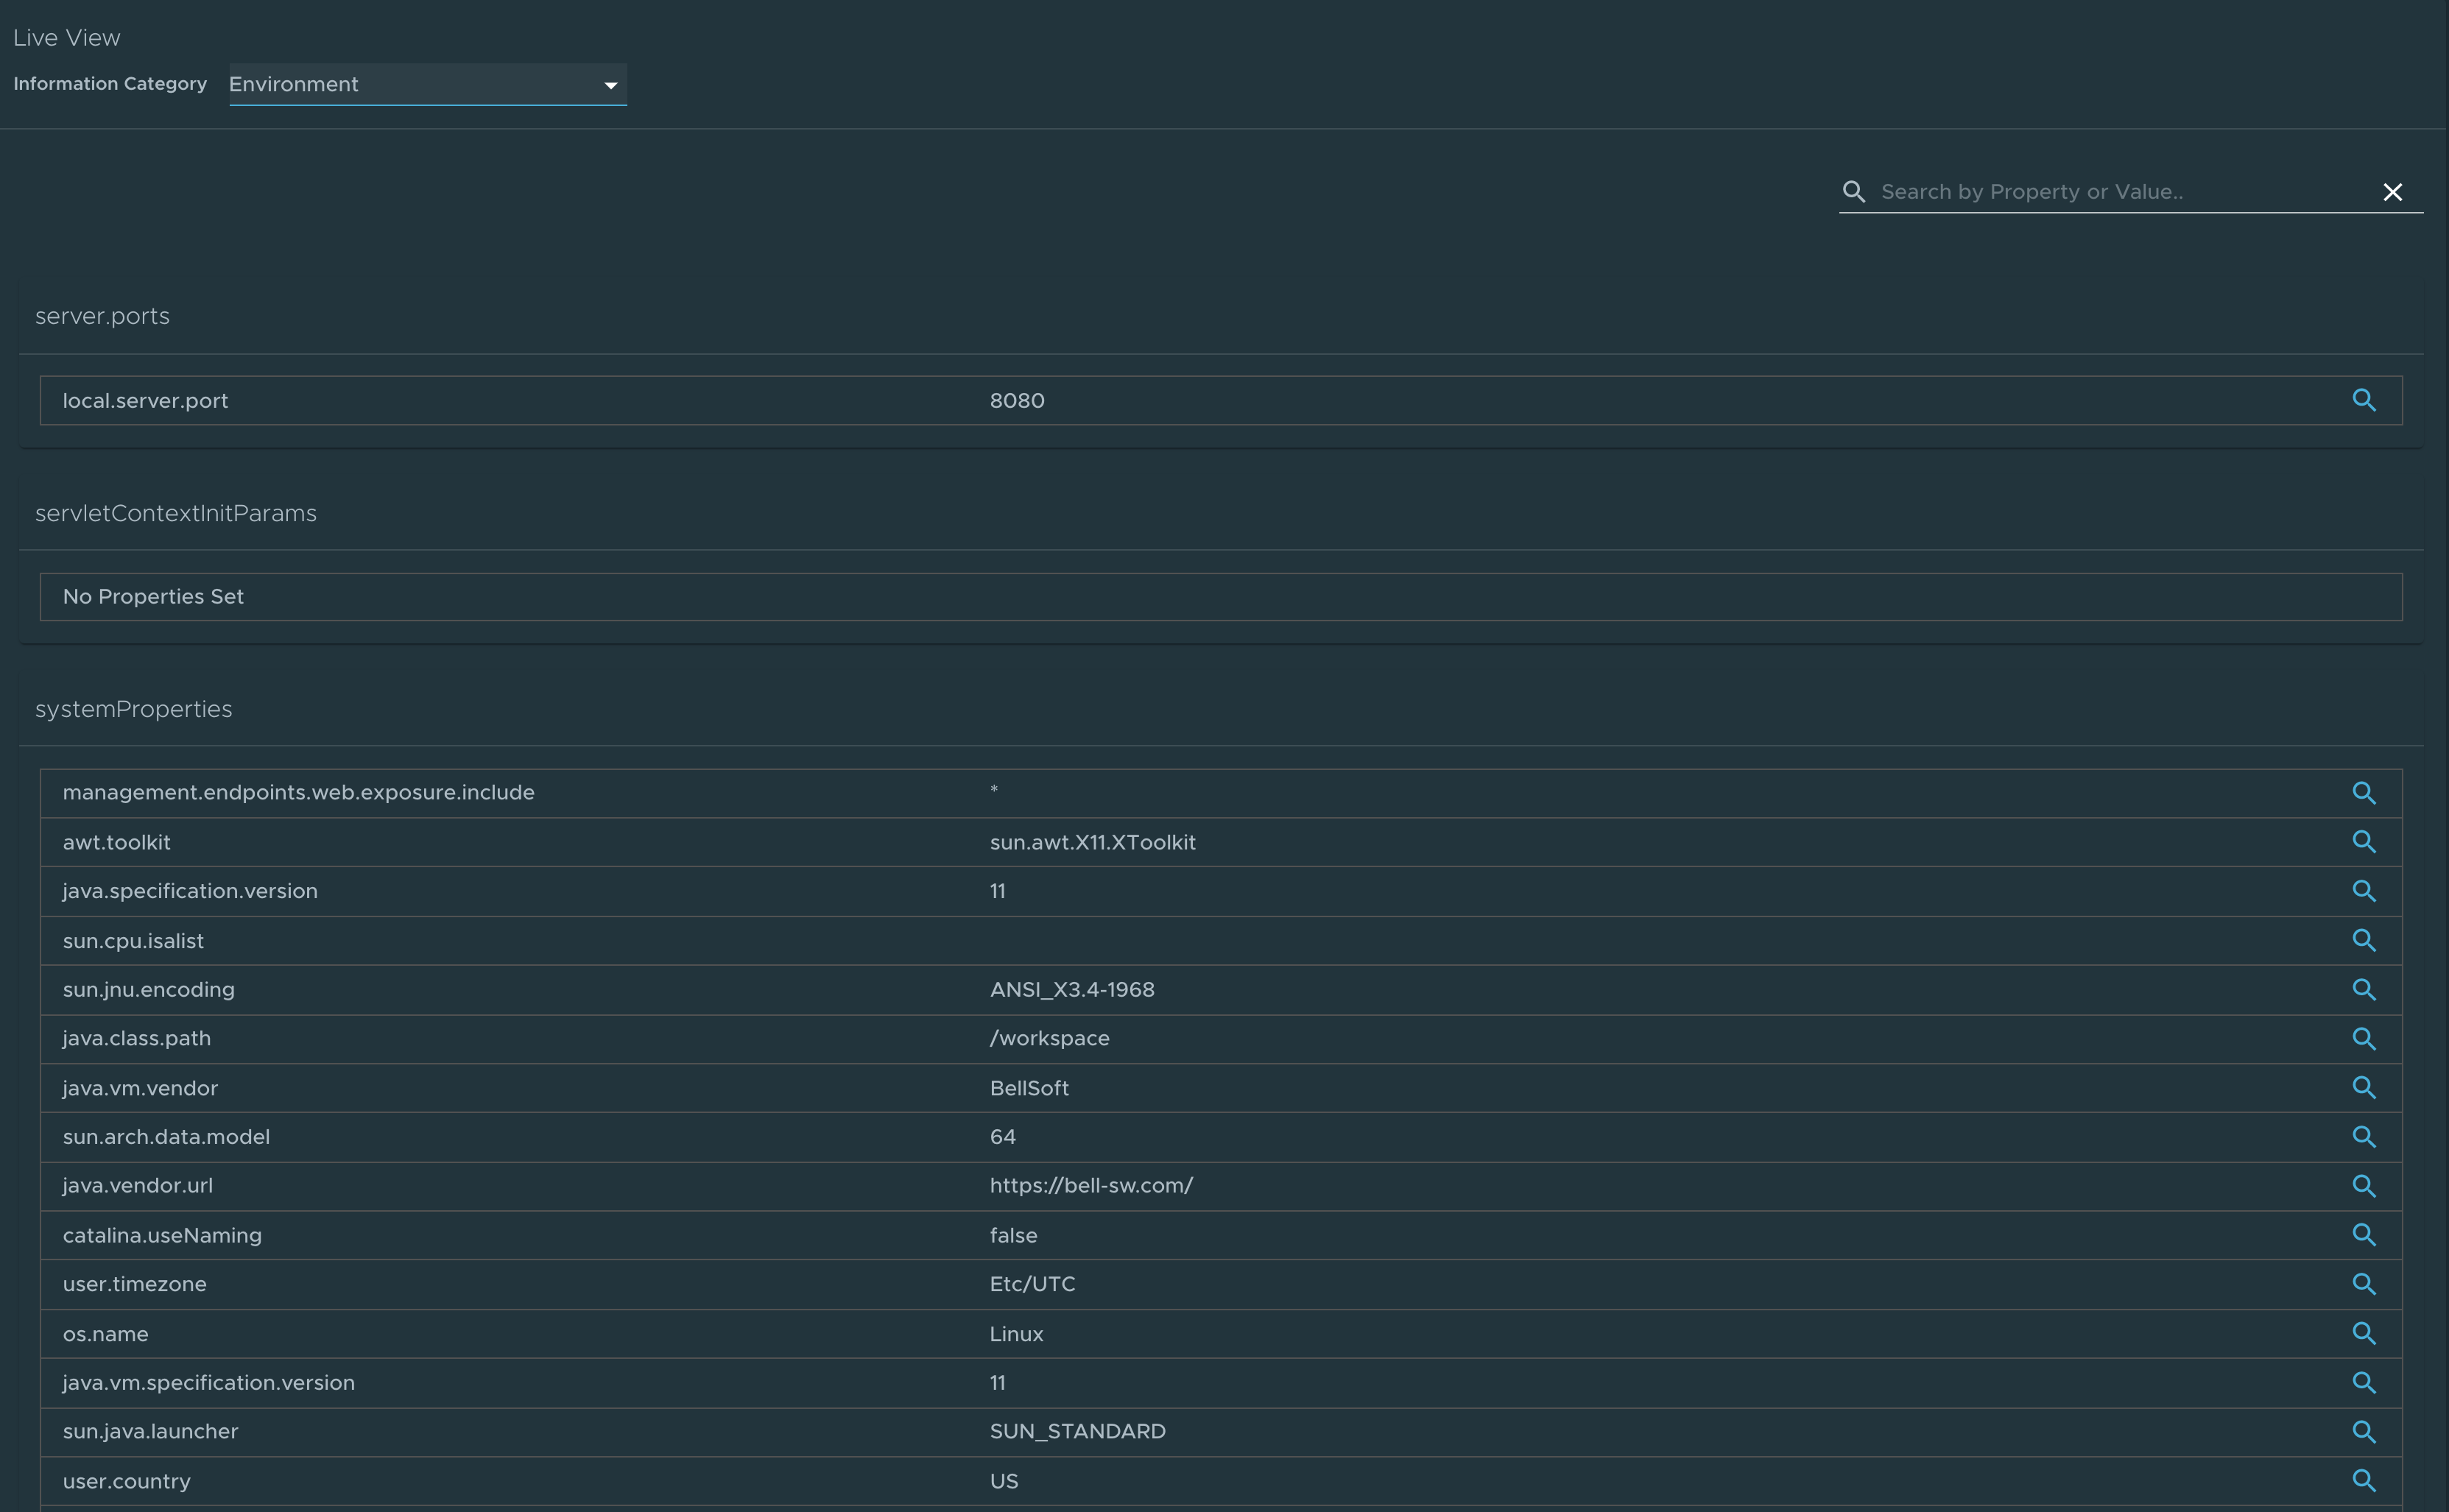
Environment page
To go to the Environment page, select the Environment option from the Information Category drop-down menu. The Environment page contains details of the applications’ environment. It contains properties including, but not limited to, system properties, environment variables, and configuration properties (such as application.properties) in a Spring Boot application.
The page includes the following capabilities for viewing configured environment properties:
- The UI has a search feature that enables you to search for a property or values.
- Each property has a search icon at the right corner which helps you quickly see all the occurrences of a specific property key without manually typing in the search box. Clicking the search button locates the property name.
- The Refresh Scope button on the top right corner of the page probes the application to refresh all the environment properties.
The page also includes the following capabilities for editing configured environment properties:
- The UI allows you to edit environment properties and see the live changes in the application. These edits are temporary and go away if the underlying pod is restarted.
- For each configured environment property, you can edit its value by clicking on the Override button in the same row. After the value is saved, you can view the message that the property was overridden from the initial value. The updated property is visible in the Applied Overrides section at the top of the page. The Reset button in the same row resets the environment property to the initial state.
- You can edit or remove the overridden environment variables in the Applied Overrides section.
- The Applied Overrides section also enables you to add new environment properties to the application.
Note
management.endpoint.env.post.enabled=truemust be set in the application config properties of the application and a corresponding, editable environment must be present in the application.
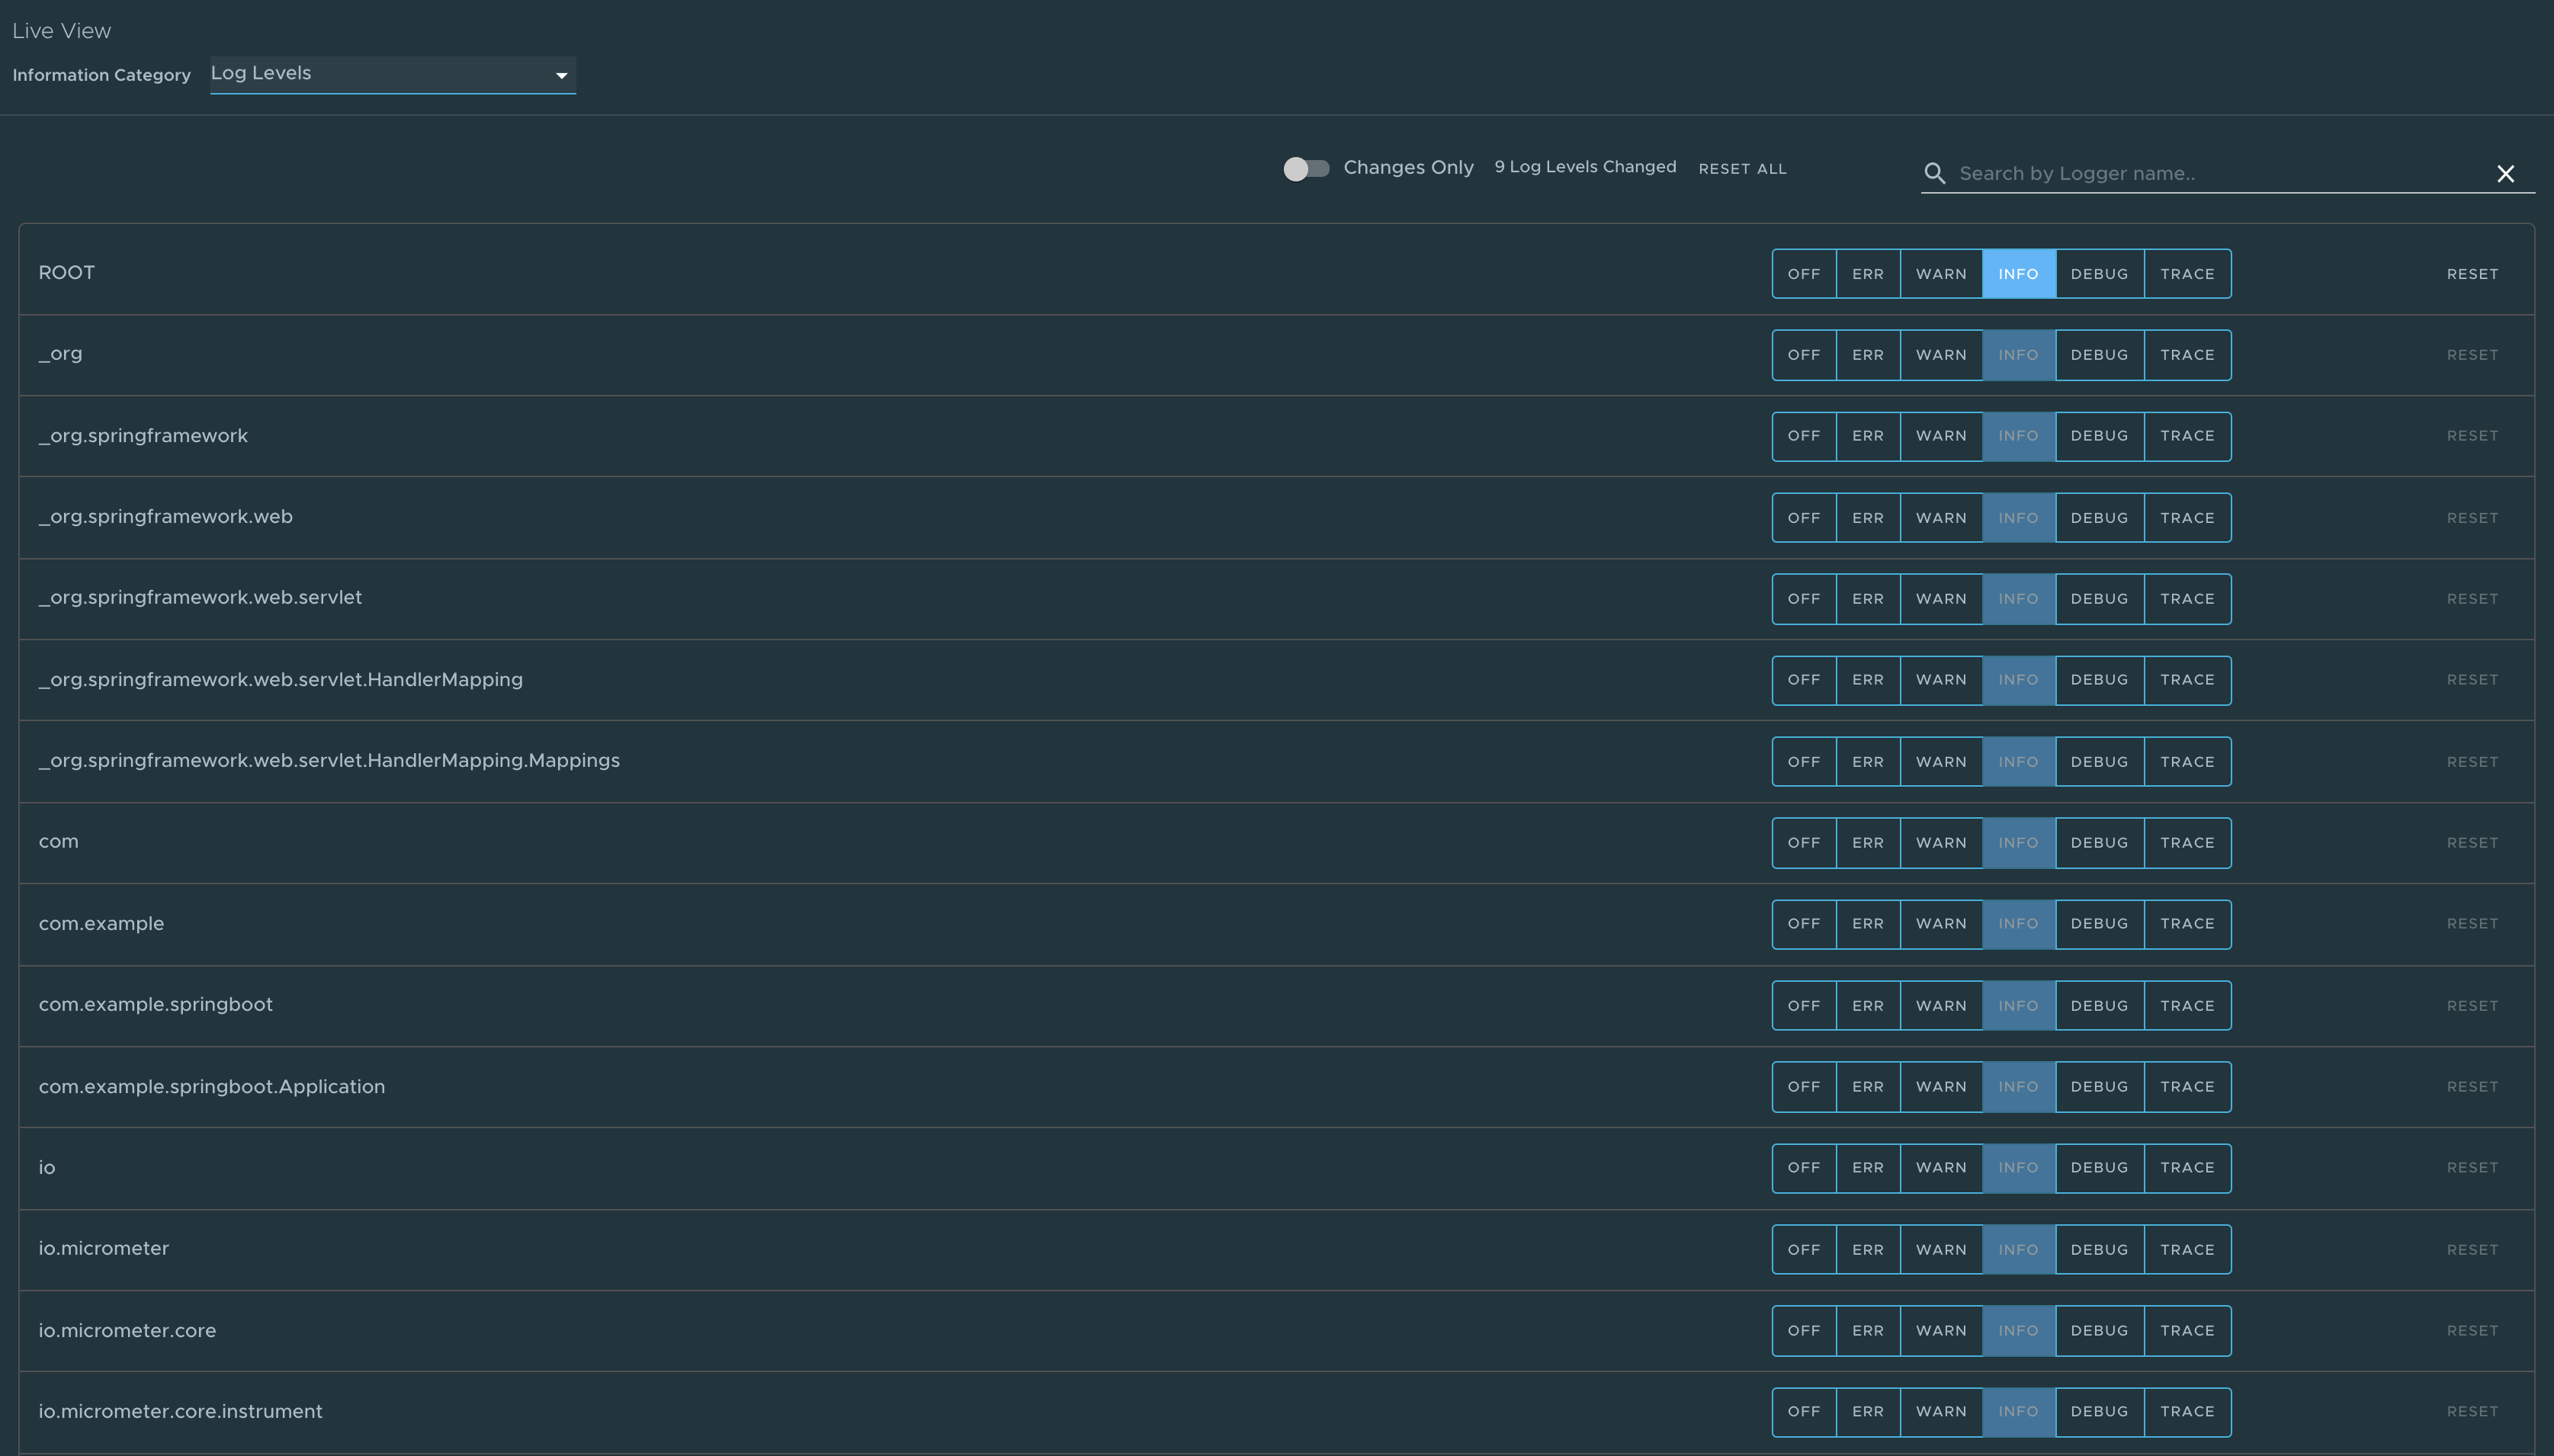
Log Levels page
To go to the Log Levels page, select the Log Levels option from the Information Category drop-down menu. The log levels page provides access to the application’s loggers and the configuration of their levels.
You can configure the log levels such as INFO, DEBUG, and TRACE in real time from the UI. You can search for a package and edit its respective log level. You can configure the log levels at a specific class and package. They can deactivate all the log levels by modifying the log level of root logger to OFF.
The toggle Changes Only displays the changed log levels. Use the search feature to search by logger name. The Reset resets the log levels to the original state. The Reset All on top right corner of the page resets all the loggers to default state.
NoteUse the UI to change the log levels and see the live changes on the application. These changes are temporary and go away if the underlying pod is restarted.
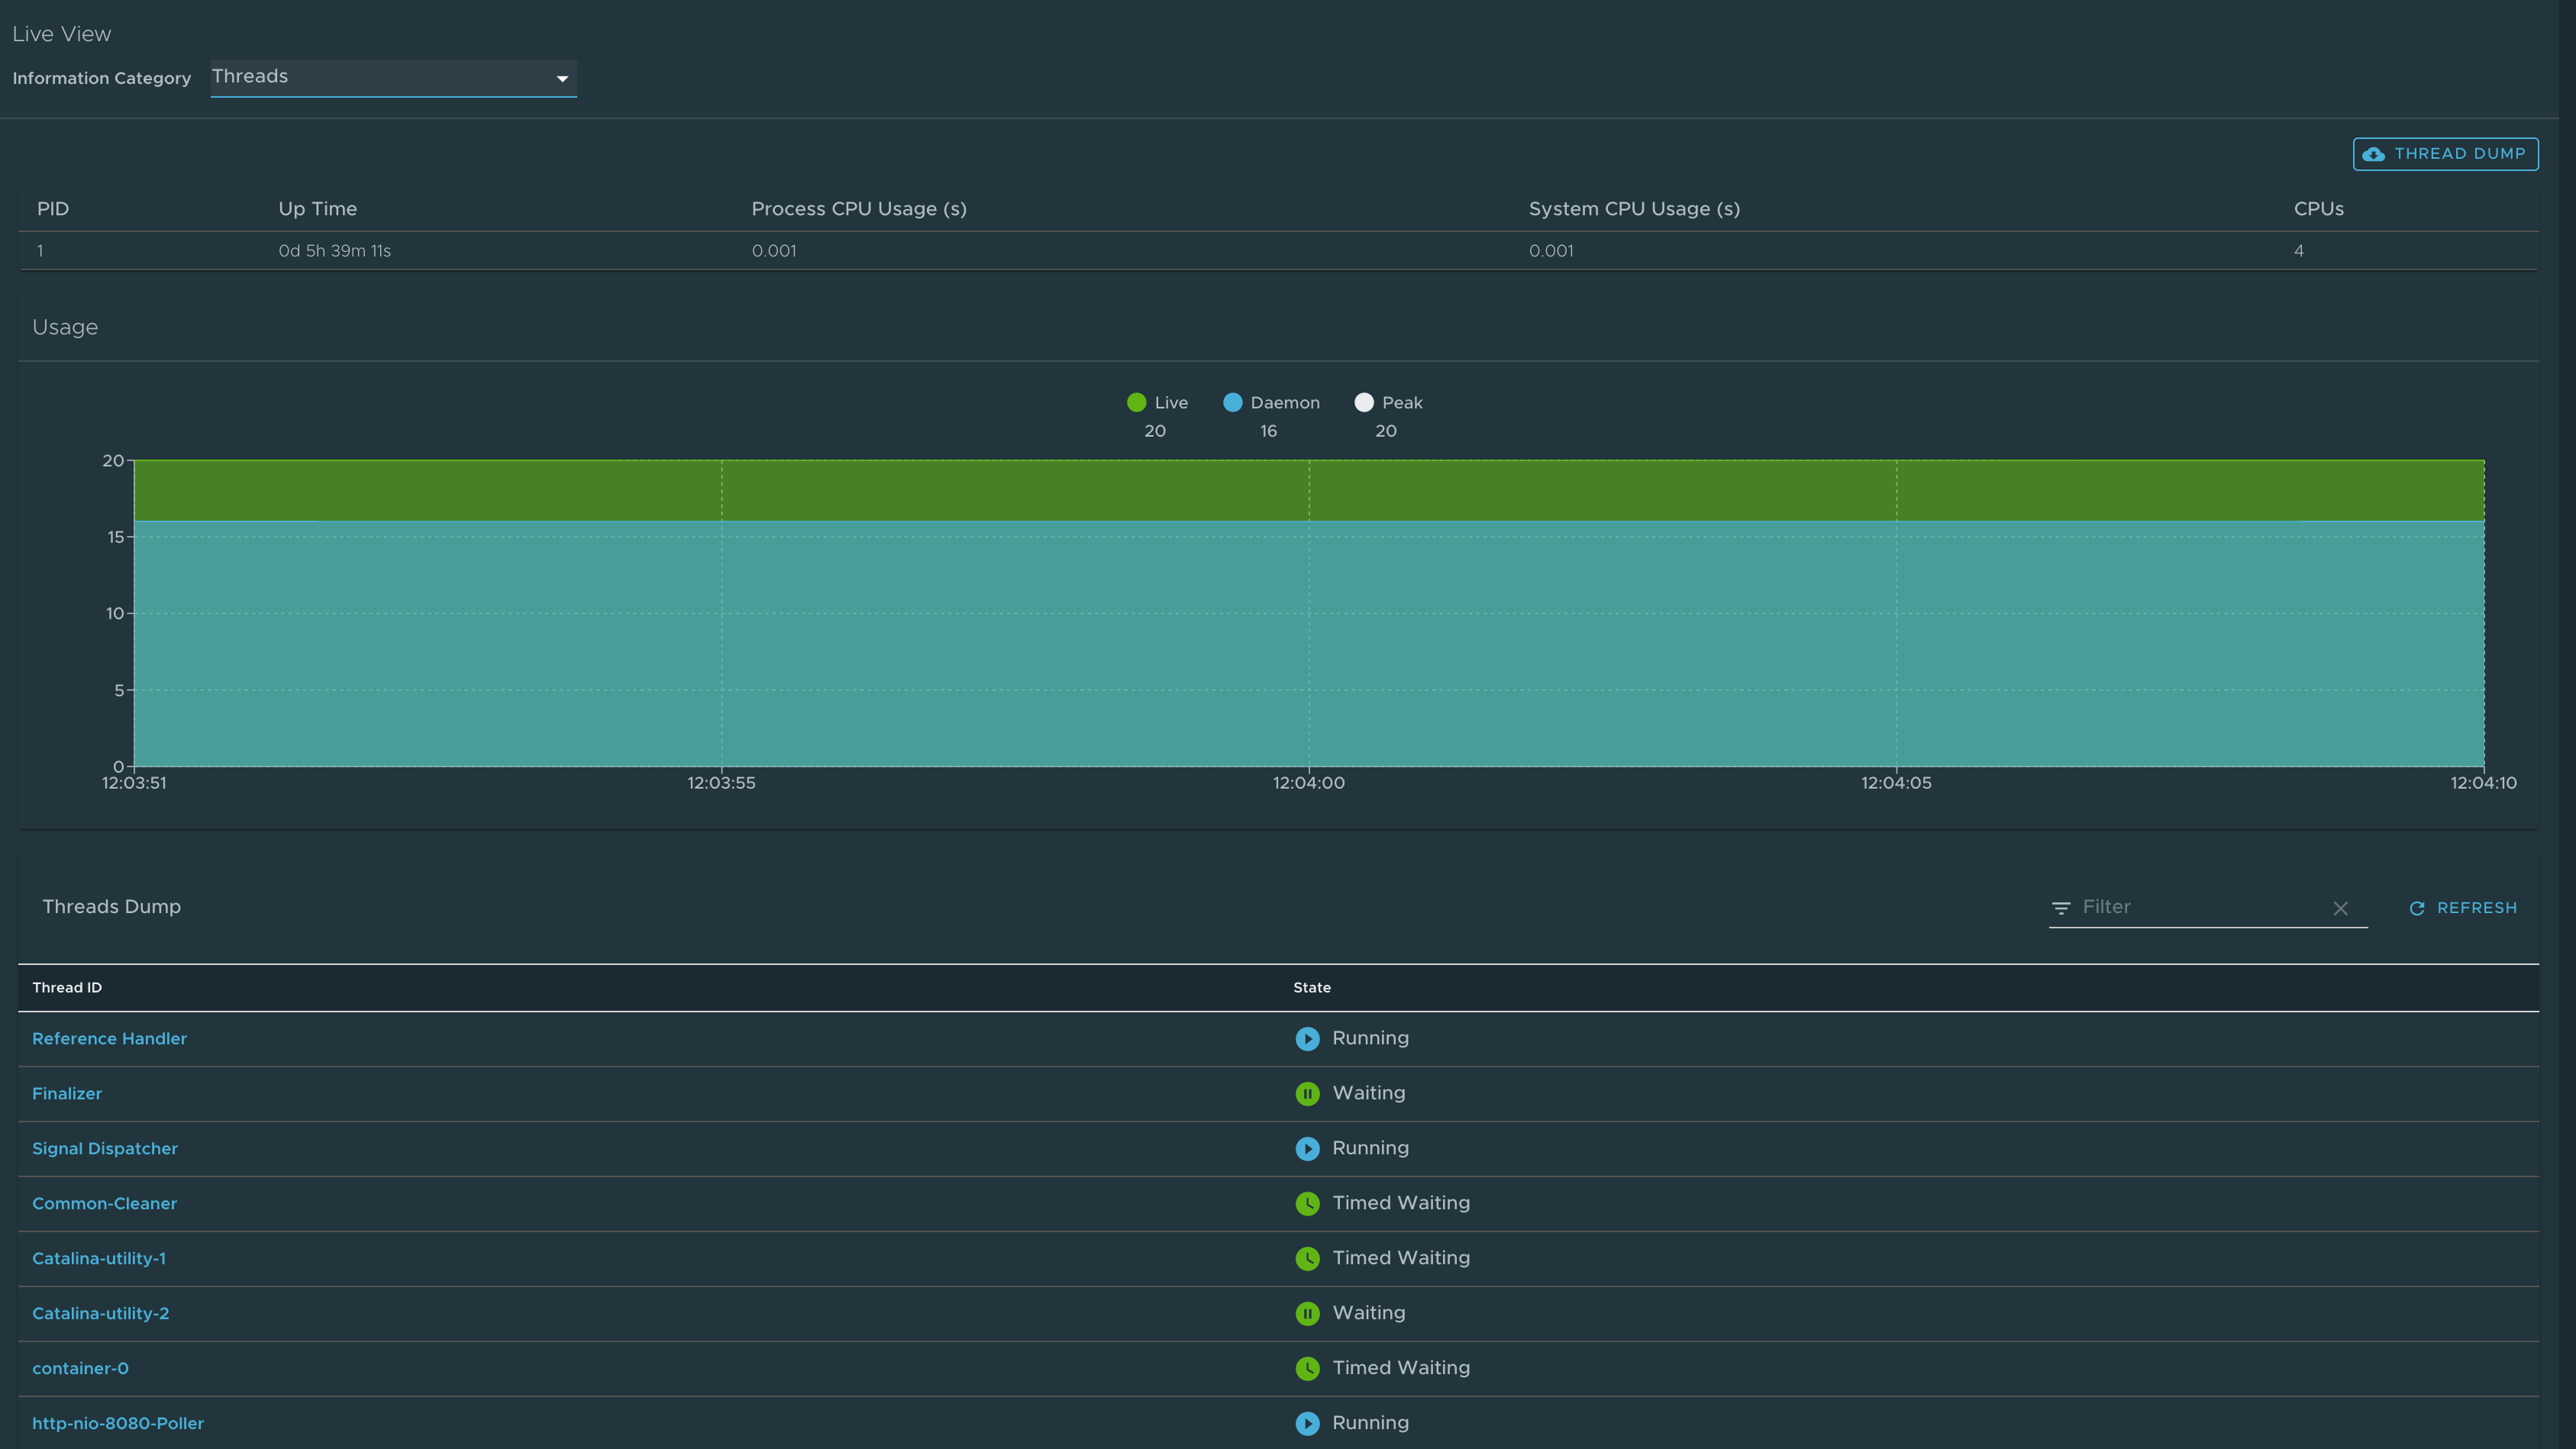
Threads page
To go to the Threads page, select the Threads option from the Information Category drop-down menu.
This page displays all details related to Java Virtual Machine (JVM) threads and running processes of the application. This tracks live threads and daemon threads real-time. It is a snapshot of different thread states. Navigating to a thread state displays all the information about a particular thread and its stack trace.
Use the search feature to search for threads by thread ID or state. The refresh icon refreshes to the latest state of the threads. You can view more thread details by clicking on the Thread ID. The page also has a feature to download thread dump data for analysis purposes.
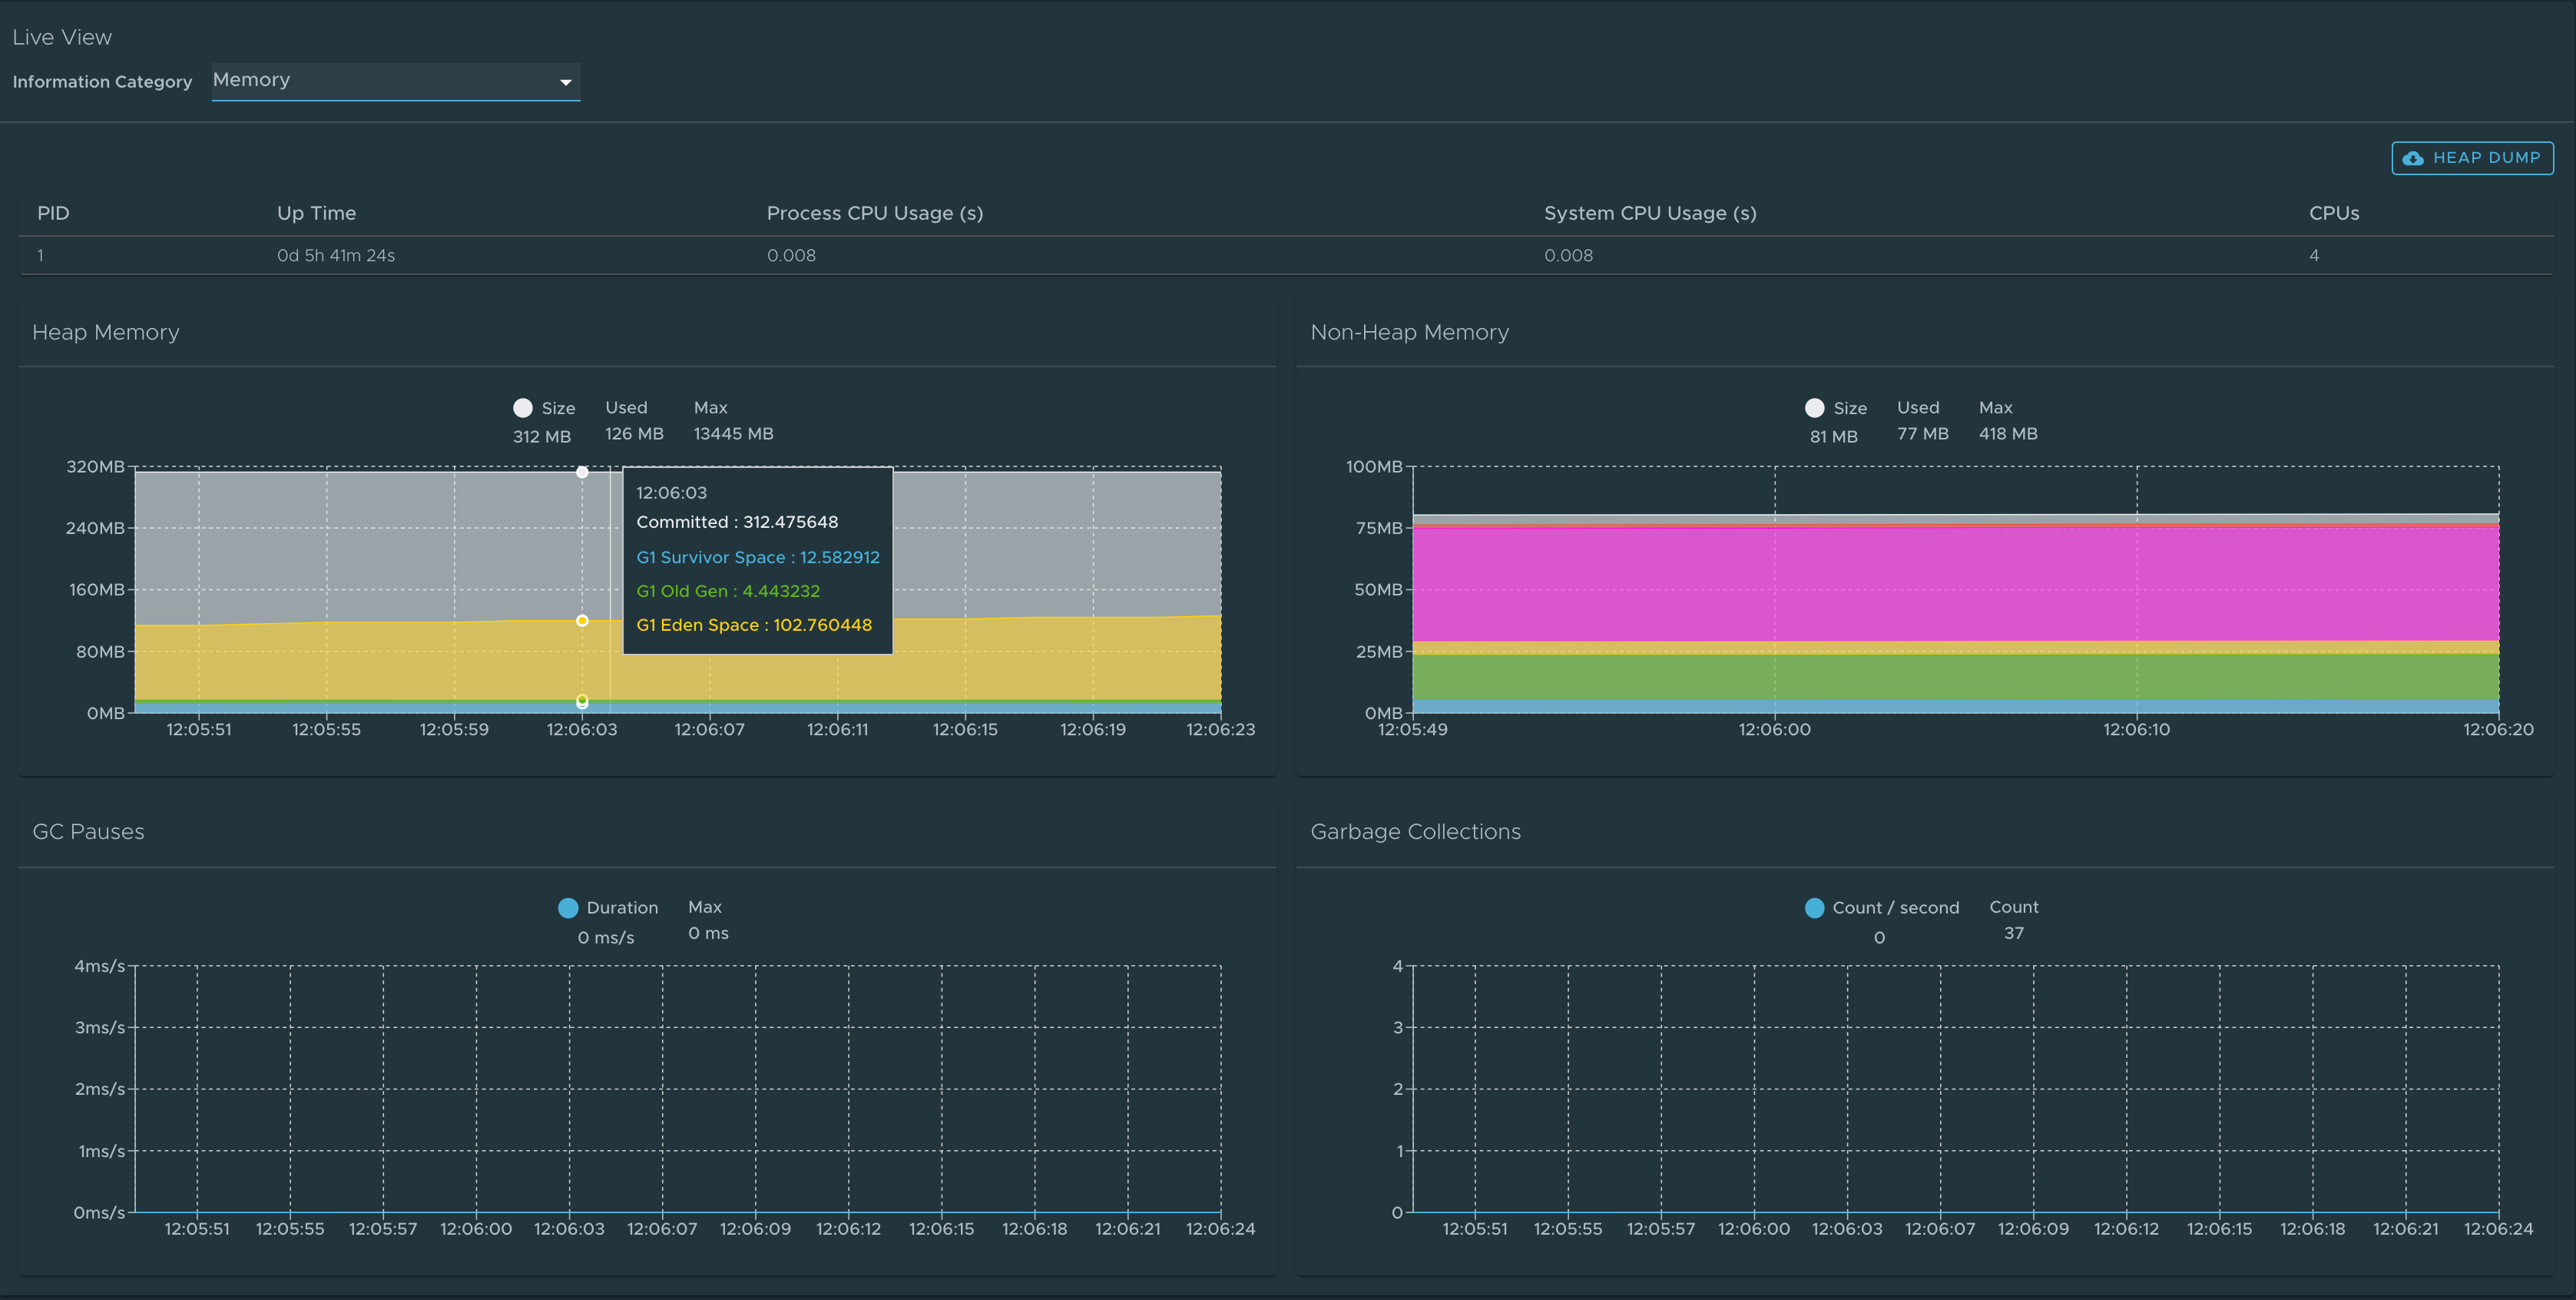
Memory page
To go to the Memory page, select the Memory option from the Information Category drop-down menu.
- The memory page highlights the memory use inside of the JVM. It displays a graphical representation of the different memory regions within heap and non-heap memory. This visualizes data from inside of the JVM (in case of Spring Boot apps running on a JVM) and therefore provides memory insights into the application in contrast to “outside” information about the Kubernetes pod level.
- The real-time graphs displays a stacked overview of the different spaces in memory with the total memory used and total memory size. The page contains graphs to display the GC pauses and GC events.
- The Heap Dump at the top-right corner enables you to download heap dump data.
NoteThis graphical visualization happens in real time and shows real-time data only. As mentioned at the top, the Application Live View features do not store any information. That means the graphs visualize the data over time only for as long as you stay on that page.
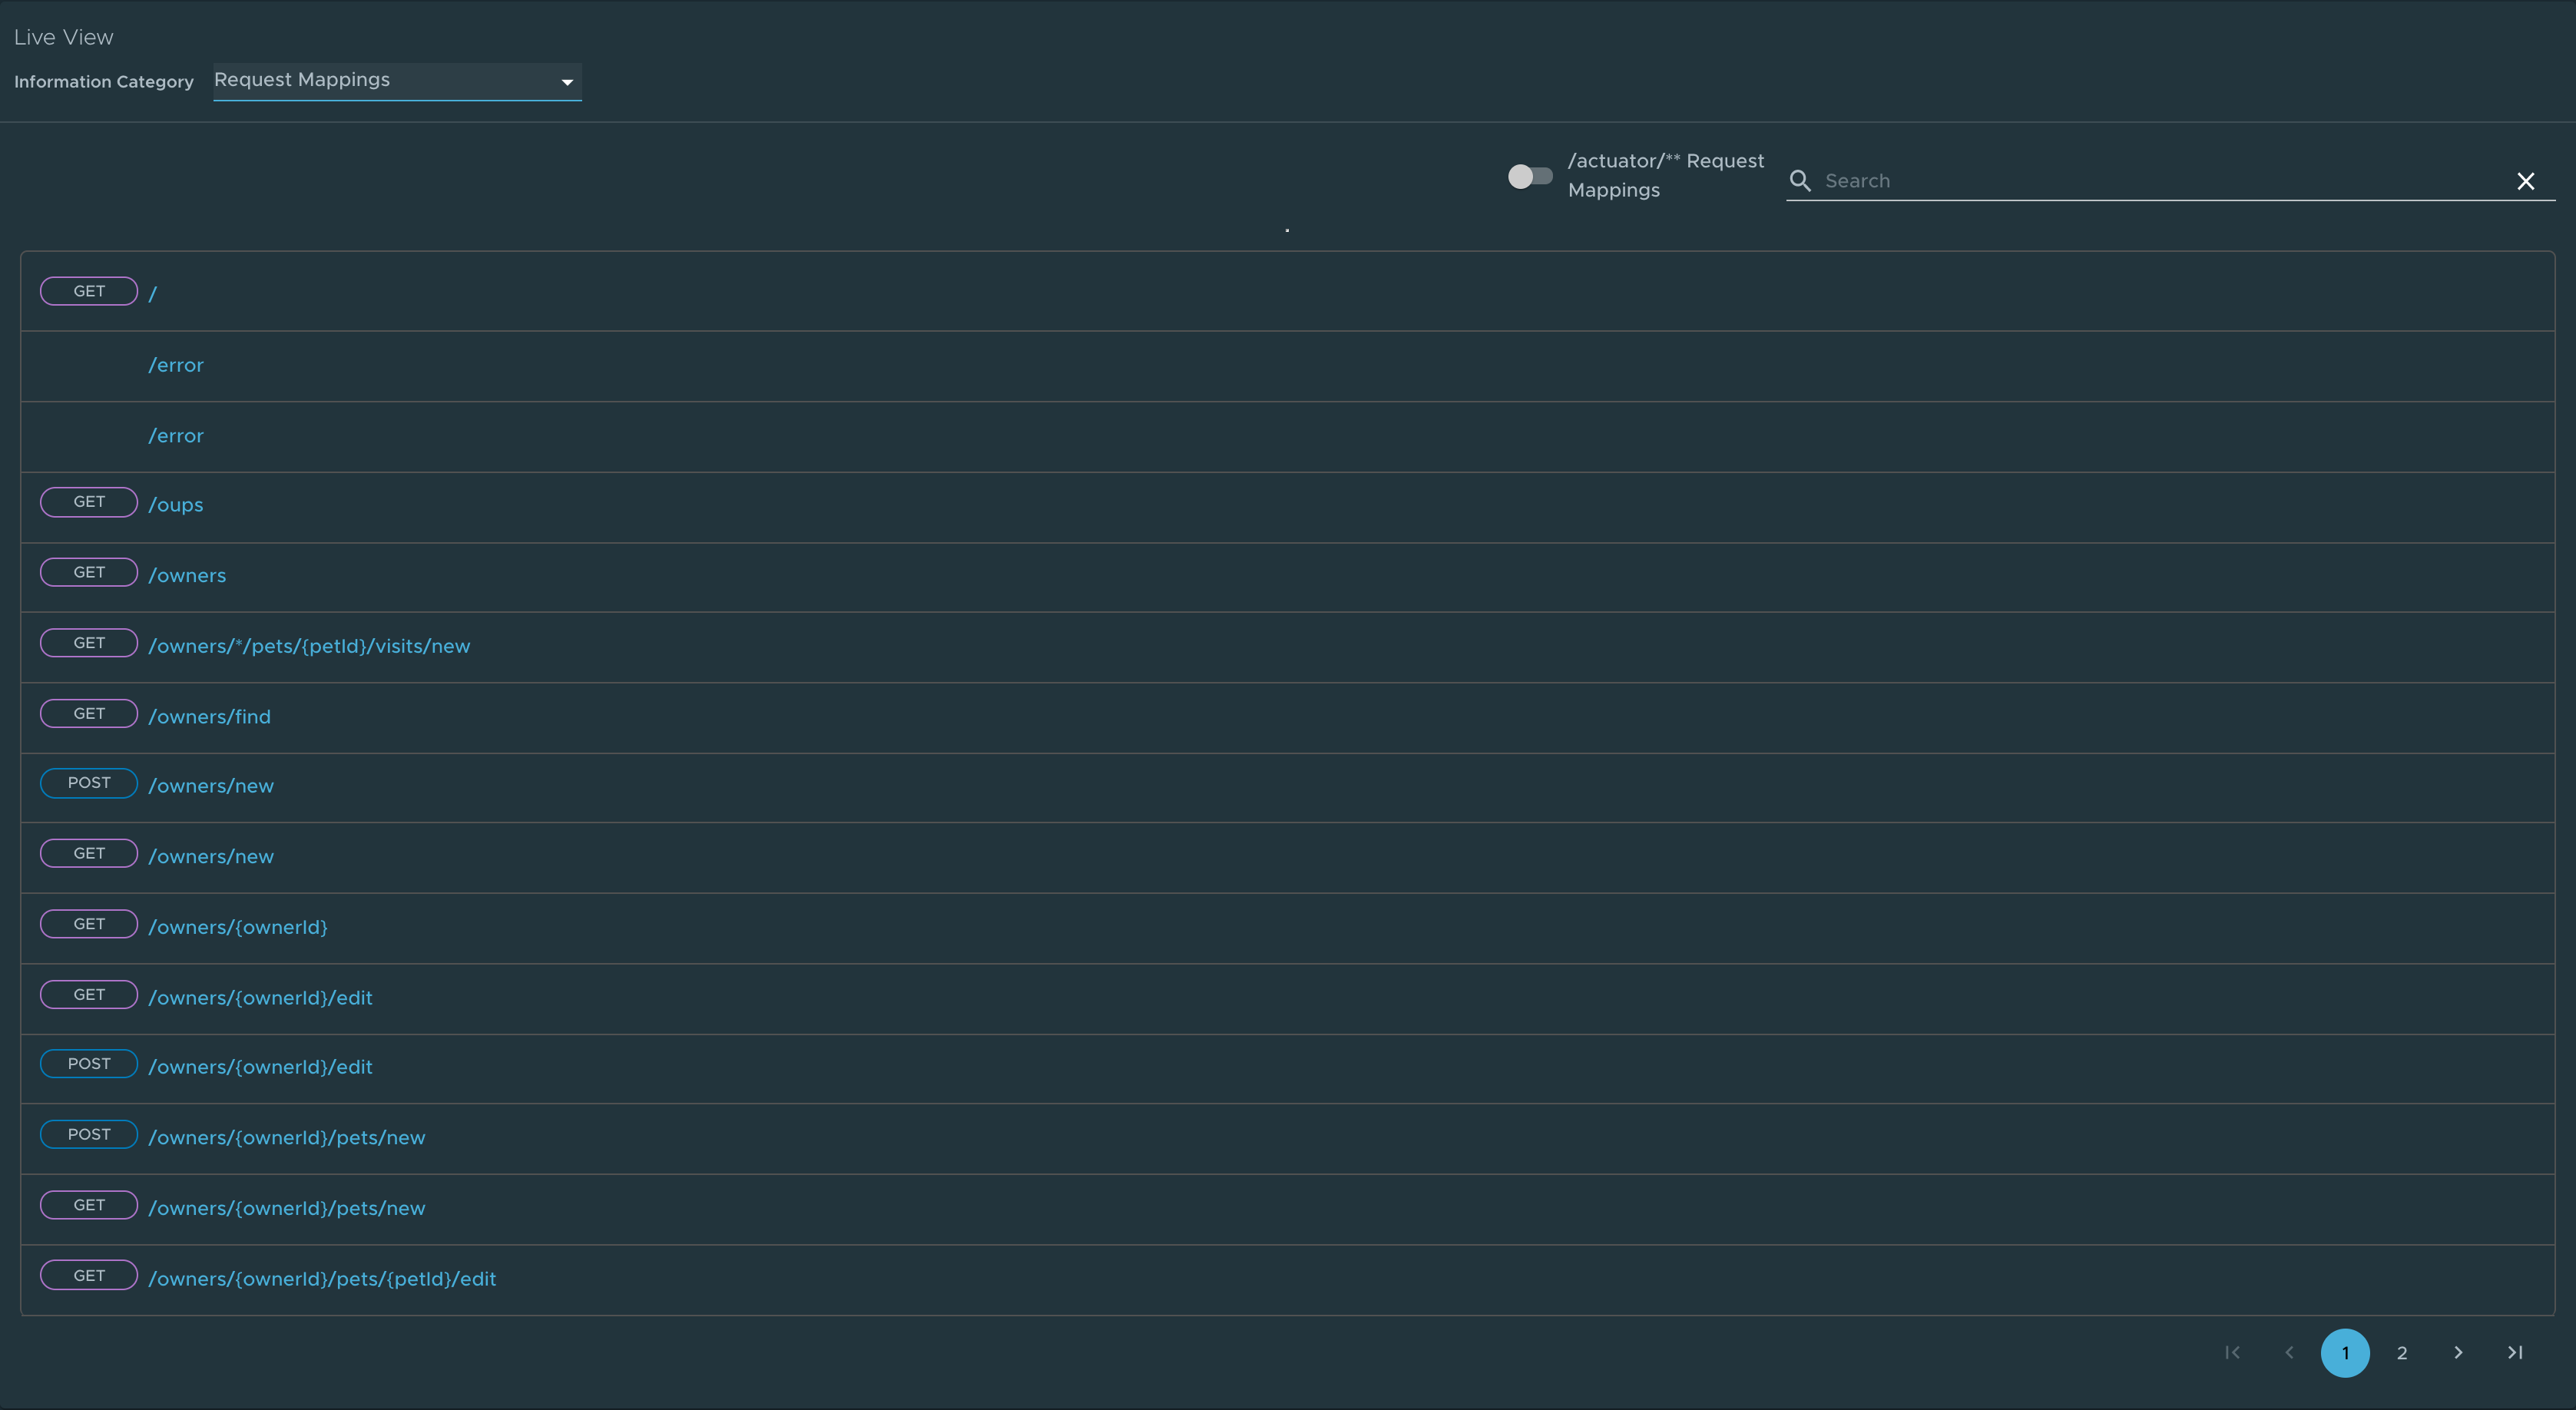
Request Mappings page
To go to the Request Mappings page, select the Request Mappings option from the Information Category drop-down menu.
This page provides information about the application’s request mappings. For each mapping, it displays the request handler method. You can view more details of the request mapping, such as the header metadata of the application.
When you click on the request mapping, a side panel appears. This panel contains information about the mapping-media types Produces and Consumes. The panel also displays the Handler class for the request. Use the search feature to search for the request mapping or the method. The toggle /actuator/** Request Mappings displays the actuator related mappings of the application.
NoteWhen application actuator endpoint is exposed on
management.server.port, the application does not return any actuator request mappings data in the context. The application displays a message when the actuator toggle is enabled.
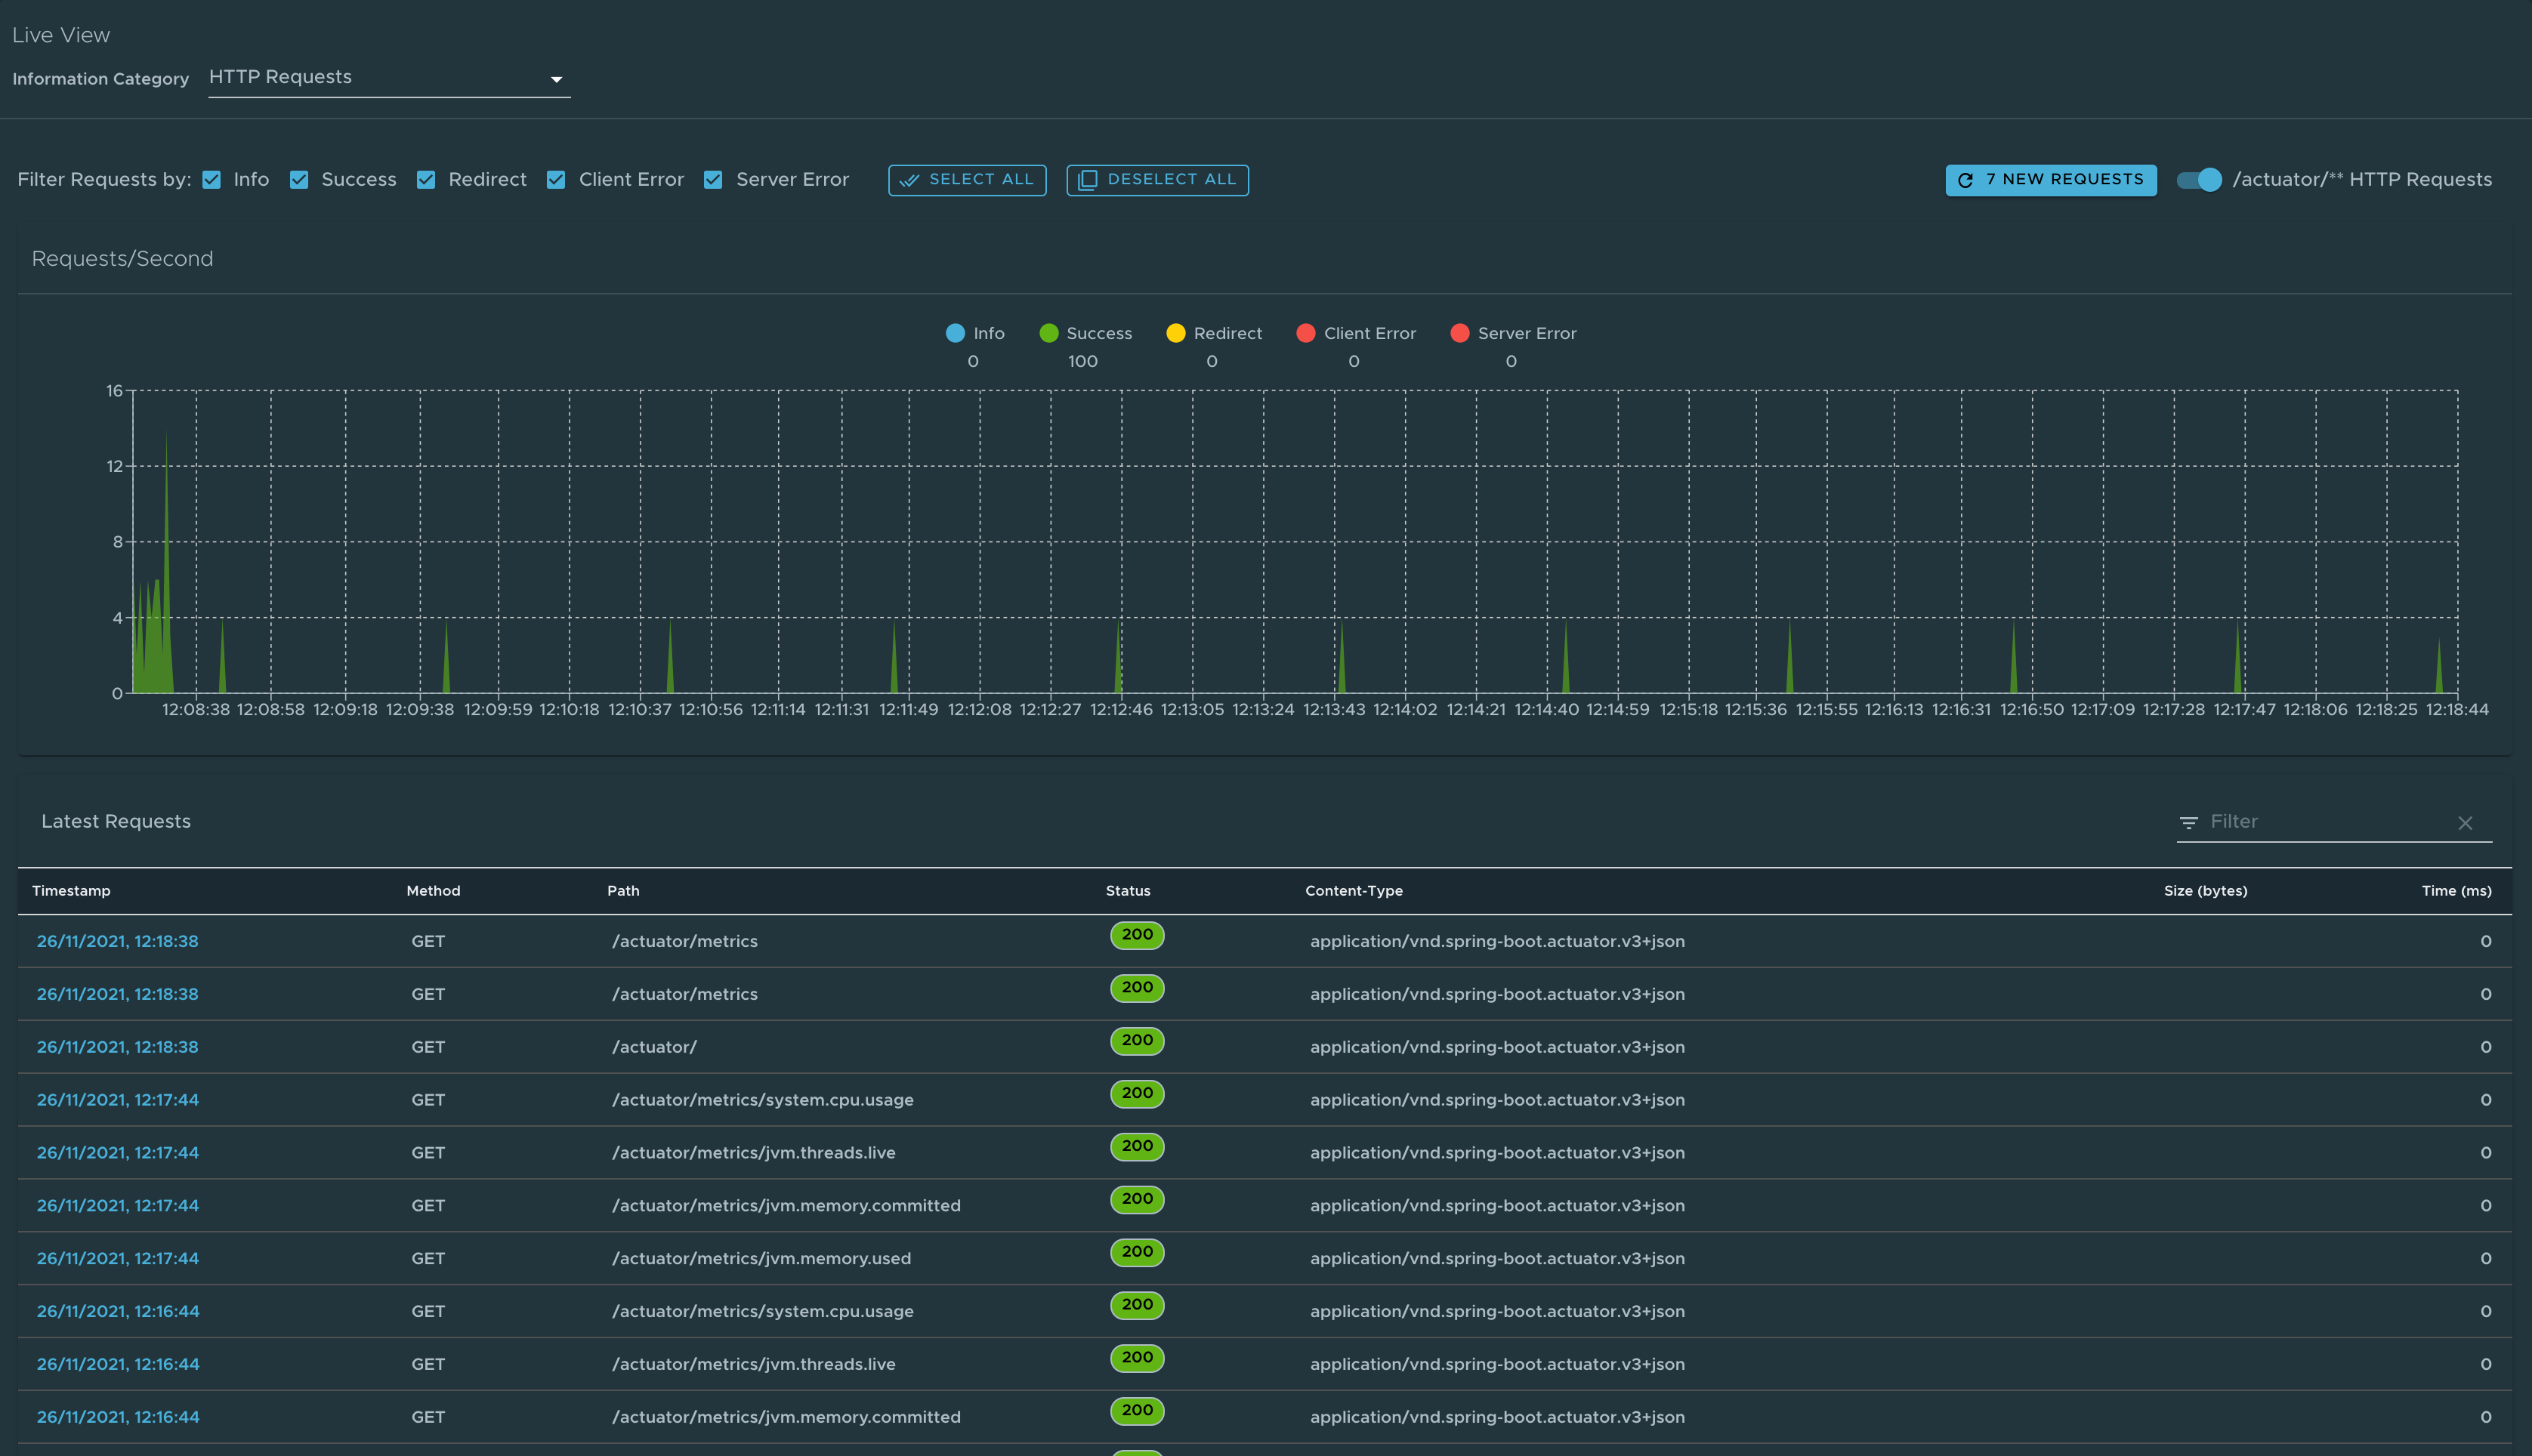
HTTP Requests page
To go to the HTTP Requests page, click HTTP Requests from the Information Category drop-down menu. The HTTP Requests page provides information about HTTP request-response exchanges to the application.
The graph visualizes the requests per second indicating the response status of all the requests. You can filter the response statuses, which include info, success, redirects, client-errors, and server-errors. The trace data is captured in detail in a tabular format with metrics such as timestamp, method, path, status, content-type, length, time.
The search feature on the table filters the traces based on the search field value. You can view more details of the request, such as method, headers, and response of the application by clicking on the timestamp. The refresh icon above the graph loads the latest traces of the application. The toggle /actuator/** on the top right corner of the page displays the actuator related traces of the application.
NoteWhen application actuator endpoint is exposed on management.server.port, no actuator HTTP Traces data is returned for the application. In this case, a message is displayed when the actuator toggle is enabled.
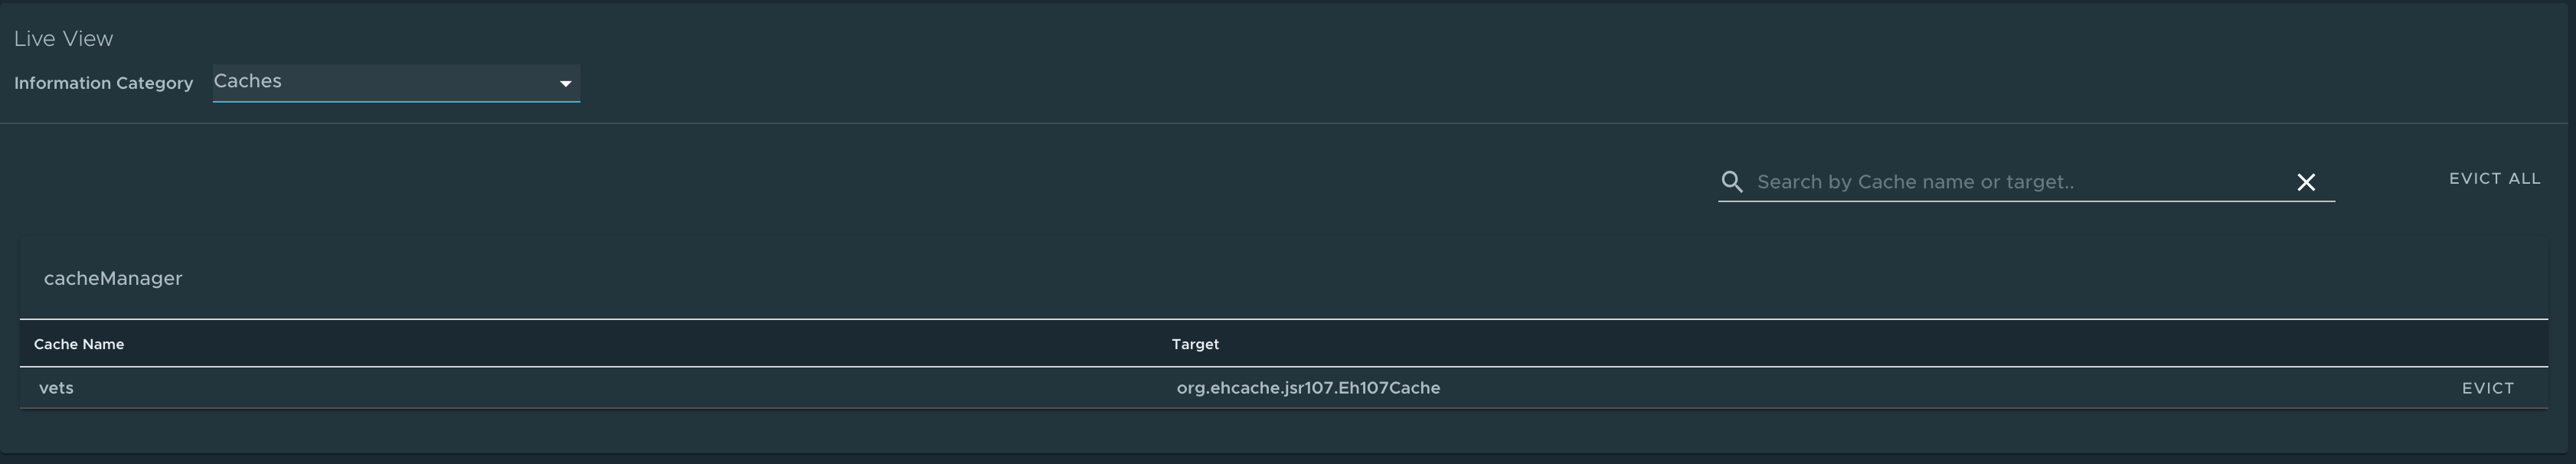
Caches page
To go to the Caches page, select the Caches option from the Information Category drop-down menu.
The Caches page provides access to the application’s caches. It gives the details of the cache managers associated with the application including the fully qualified name of the native cache.
Use the search feature in the Caches Page to search for a specific cache/cache manager. You can clear individual caches by clicking Evict. You can clear all the caches completely by clicking Evict All. If there are no cache managers for the application, the message No cache managers available for the application is displayed.
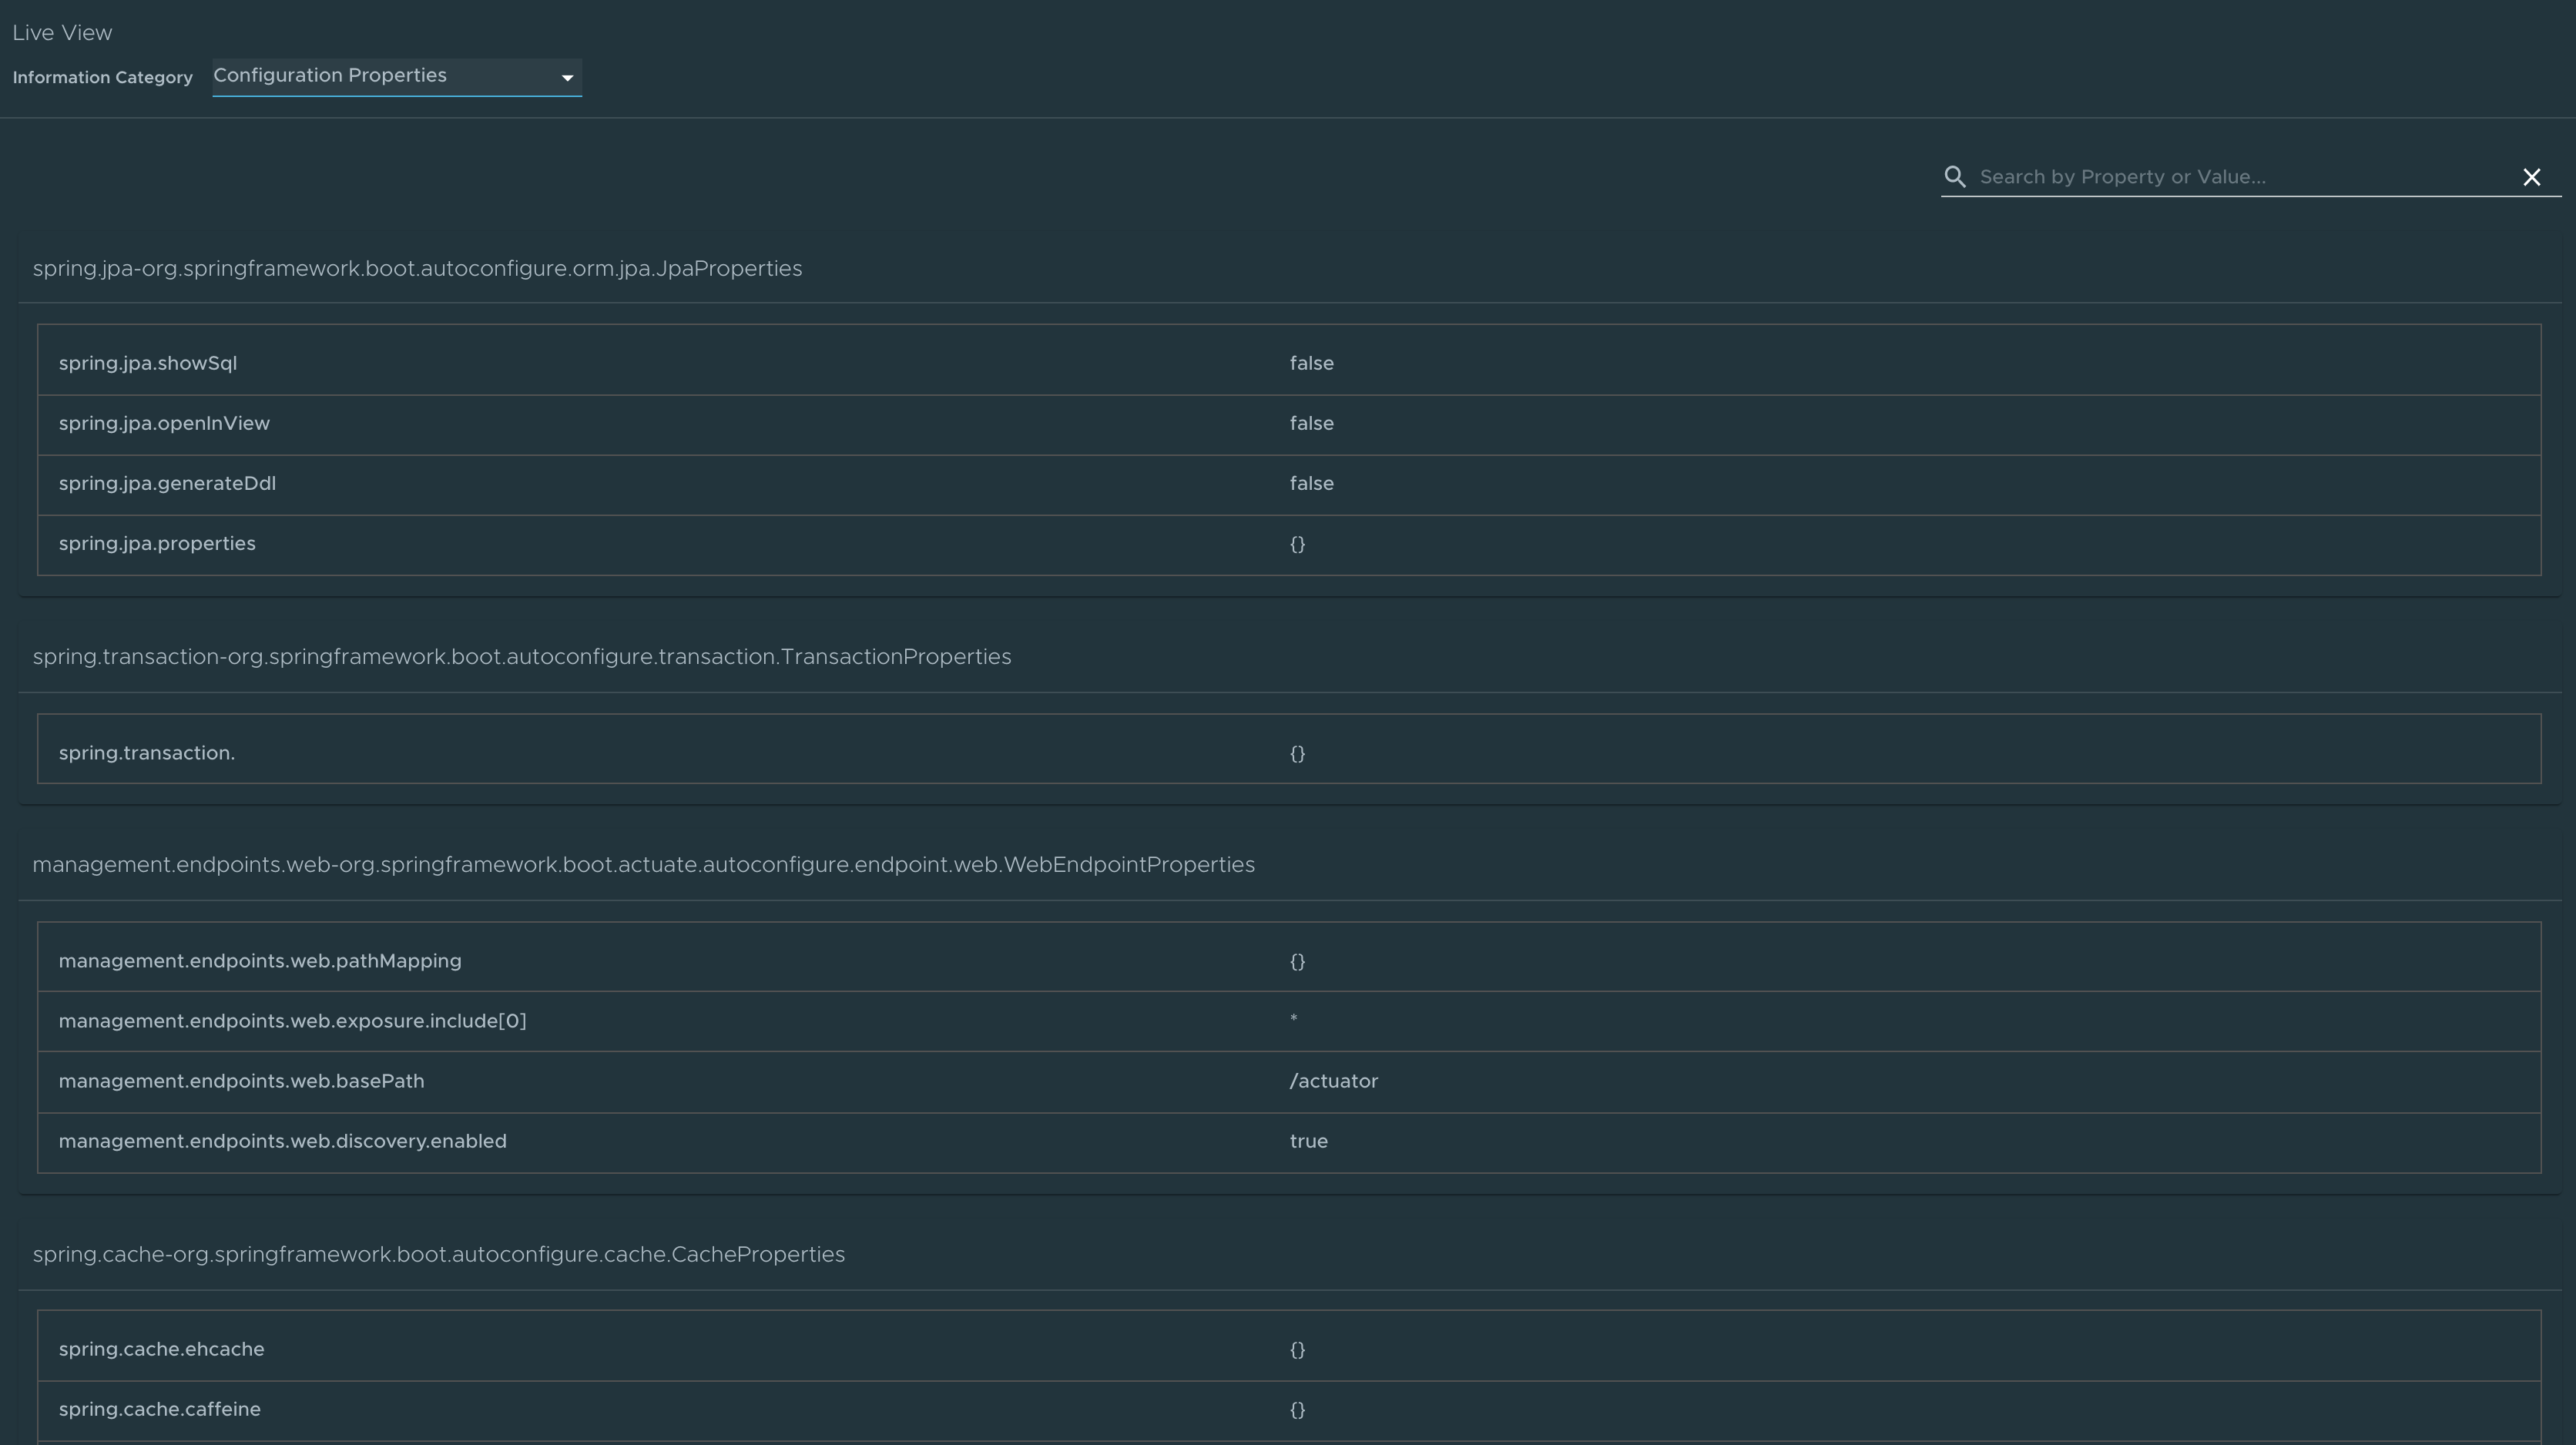
Configuration Properties page
To go to the Configuration Properties page, select the Configuration Properties option from the Information Category drop-down menu.
The configuration properties page provides information about the configuration properties of the application. In case of Spring Boot, it displays application’s @ConfigurationProperties beans. It gives a snapshot of all the beans and their associated configuration properties. Use the search feature to search for a property’s key/value or the bean name.
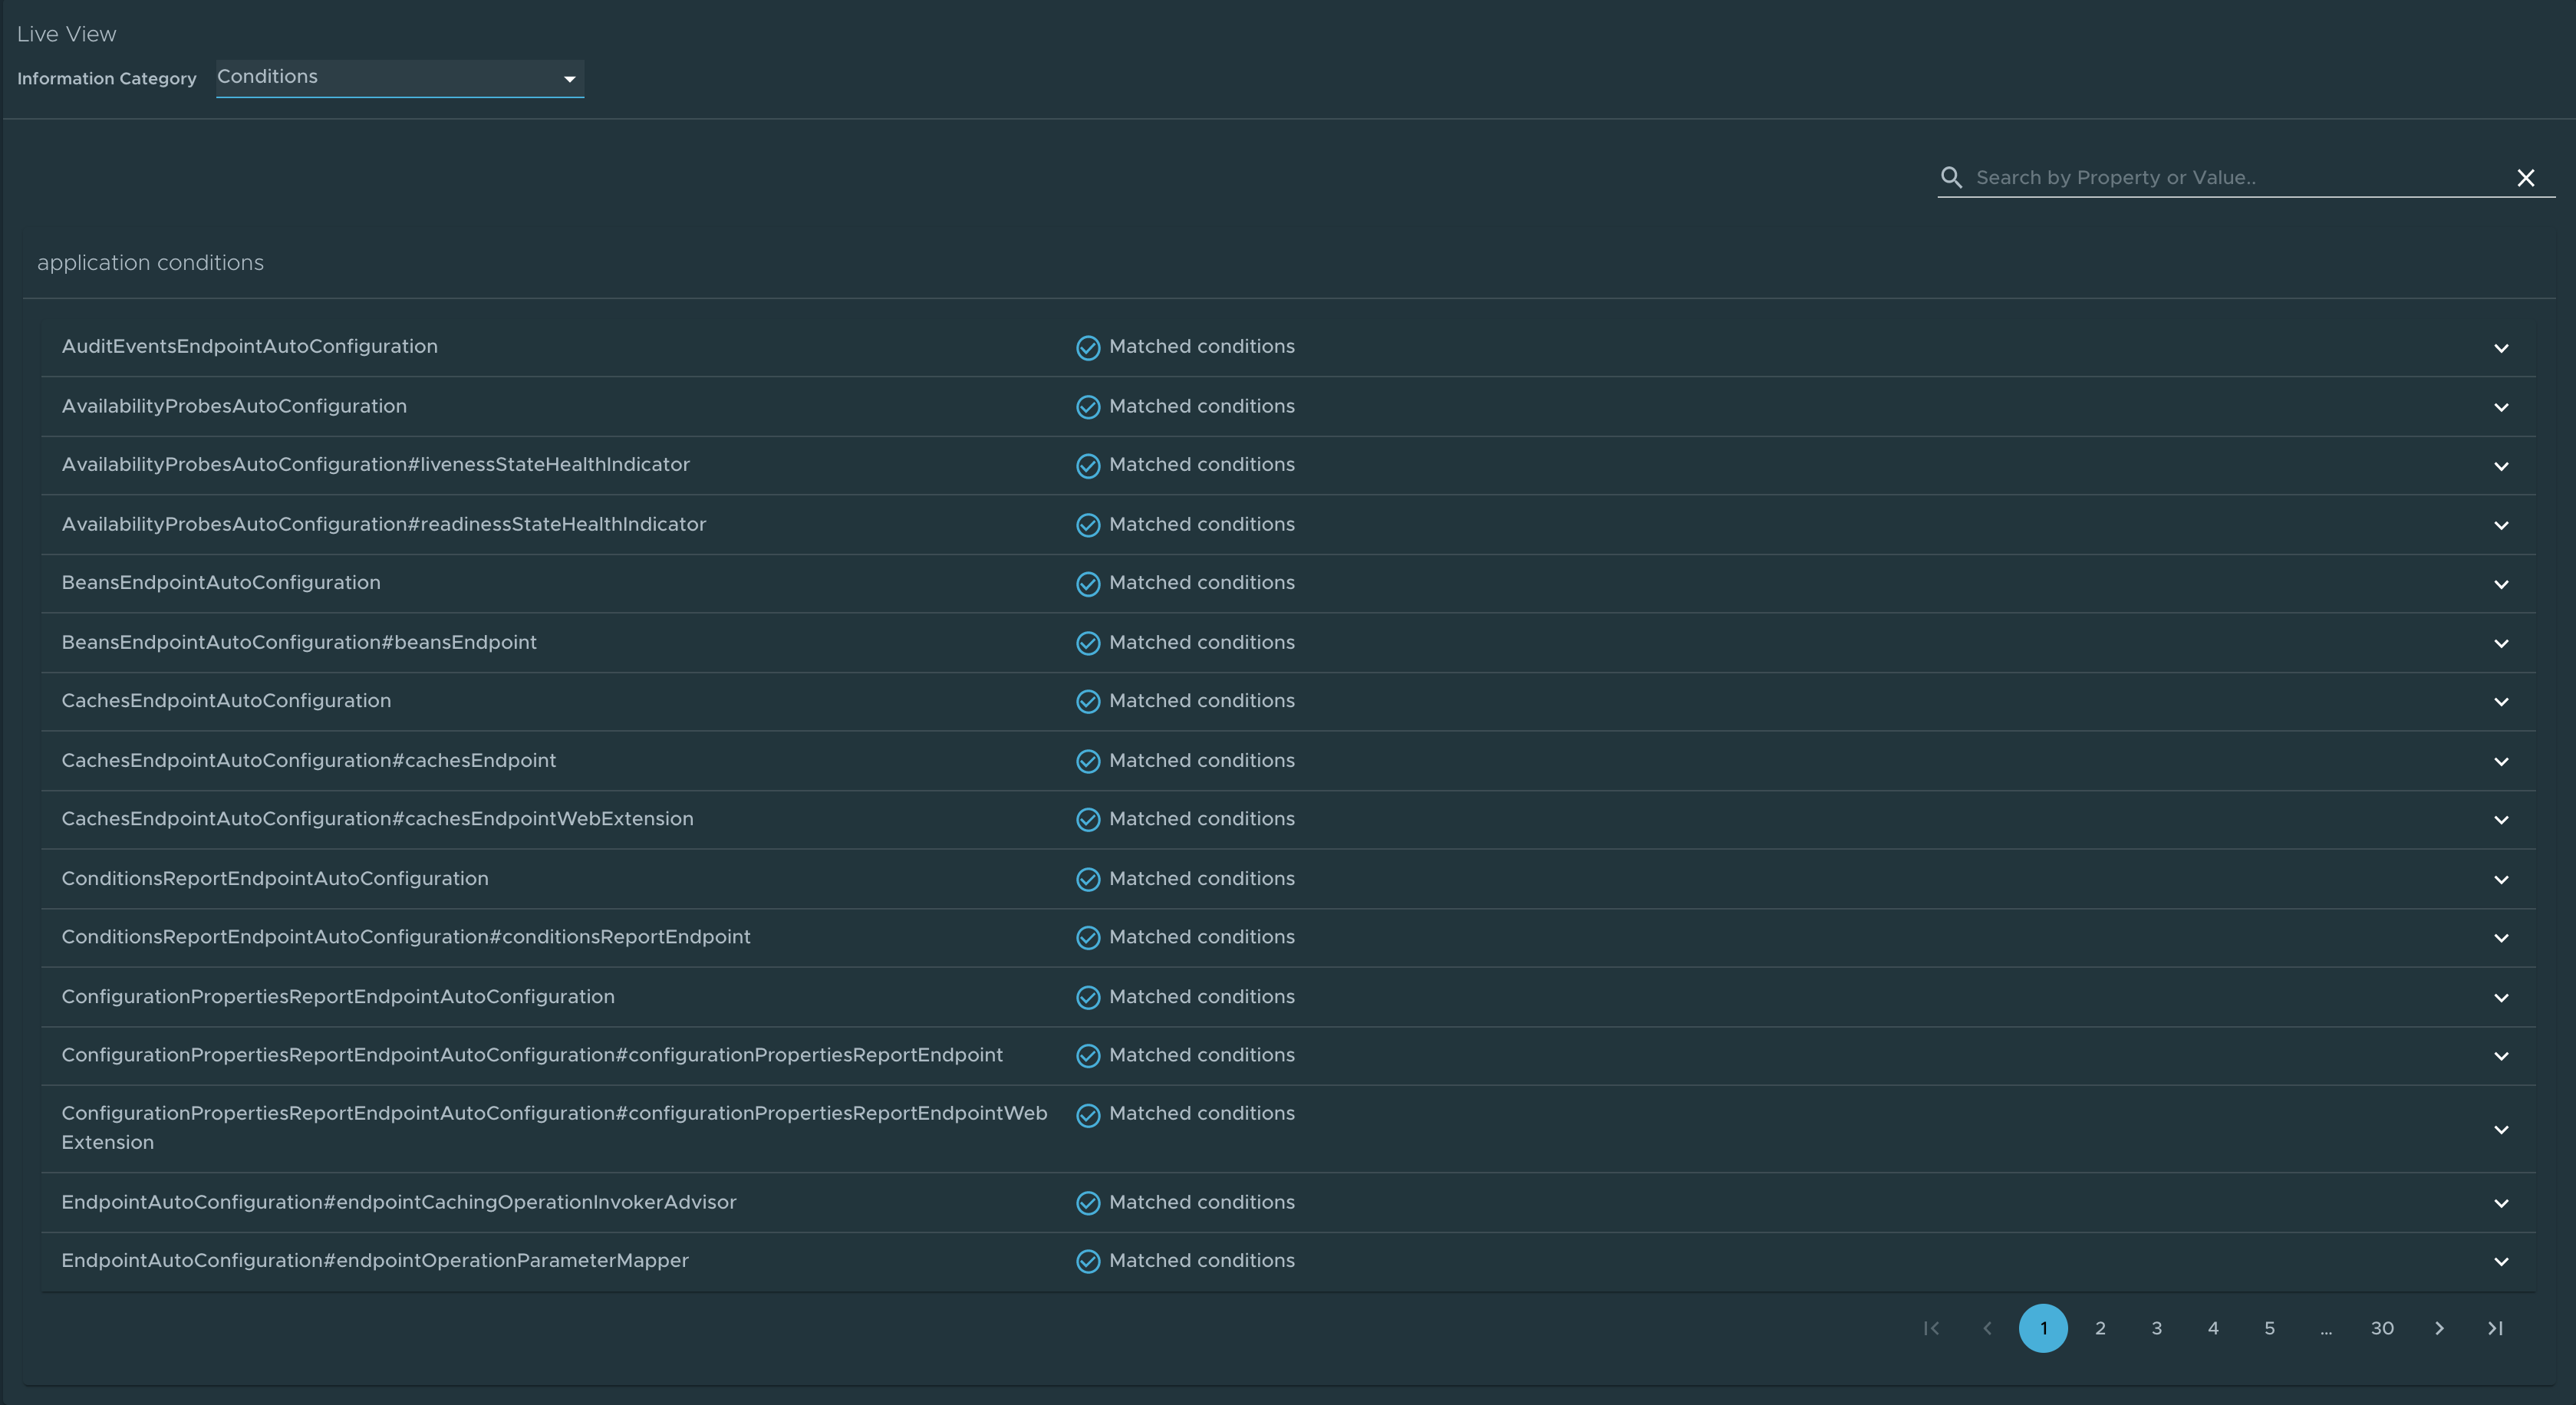
Conditions page
To go to the Conditions page, select the Conditions option from the Information Category drop-down menu. The conditions evaluation report provides information about the evaluation of conditions on configuration and auto-configuration classes.
In the case of Spring Boot, this gives you a view of all the beans configured in the application. When you click on the bean name, the conditions and the reason for the conditional match is displayed.
In the case of non-configured beans, it shows both the matched and unmatched conditions of the bean if any. In addition to this, it also displays names of unconditional auto configuration classes if any. You can use the search feature to filter out the beans and the conditions.
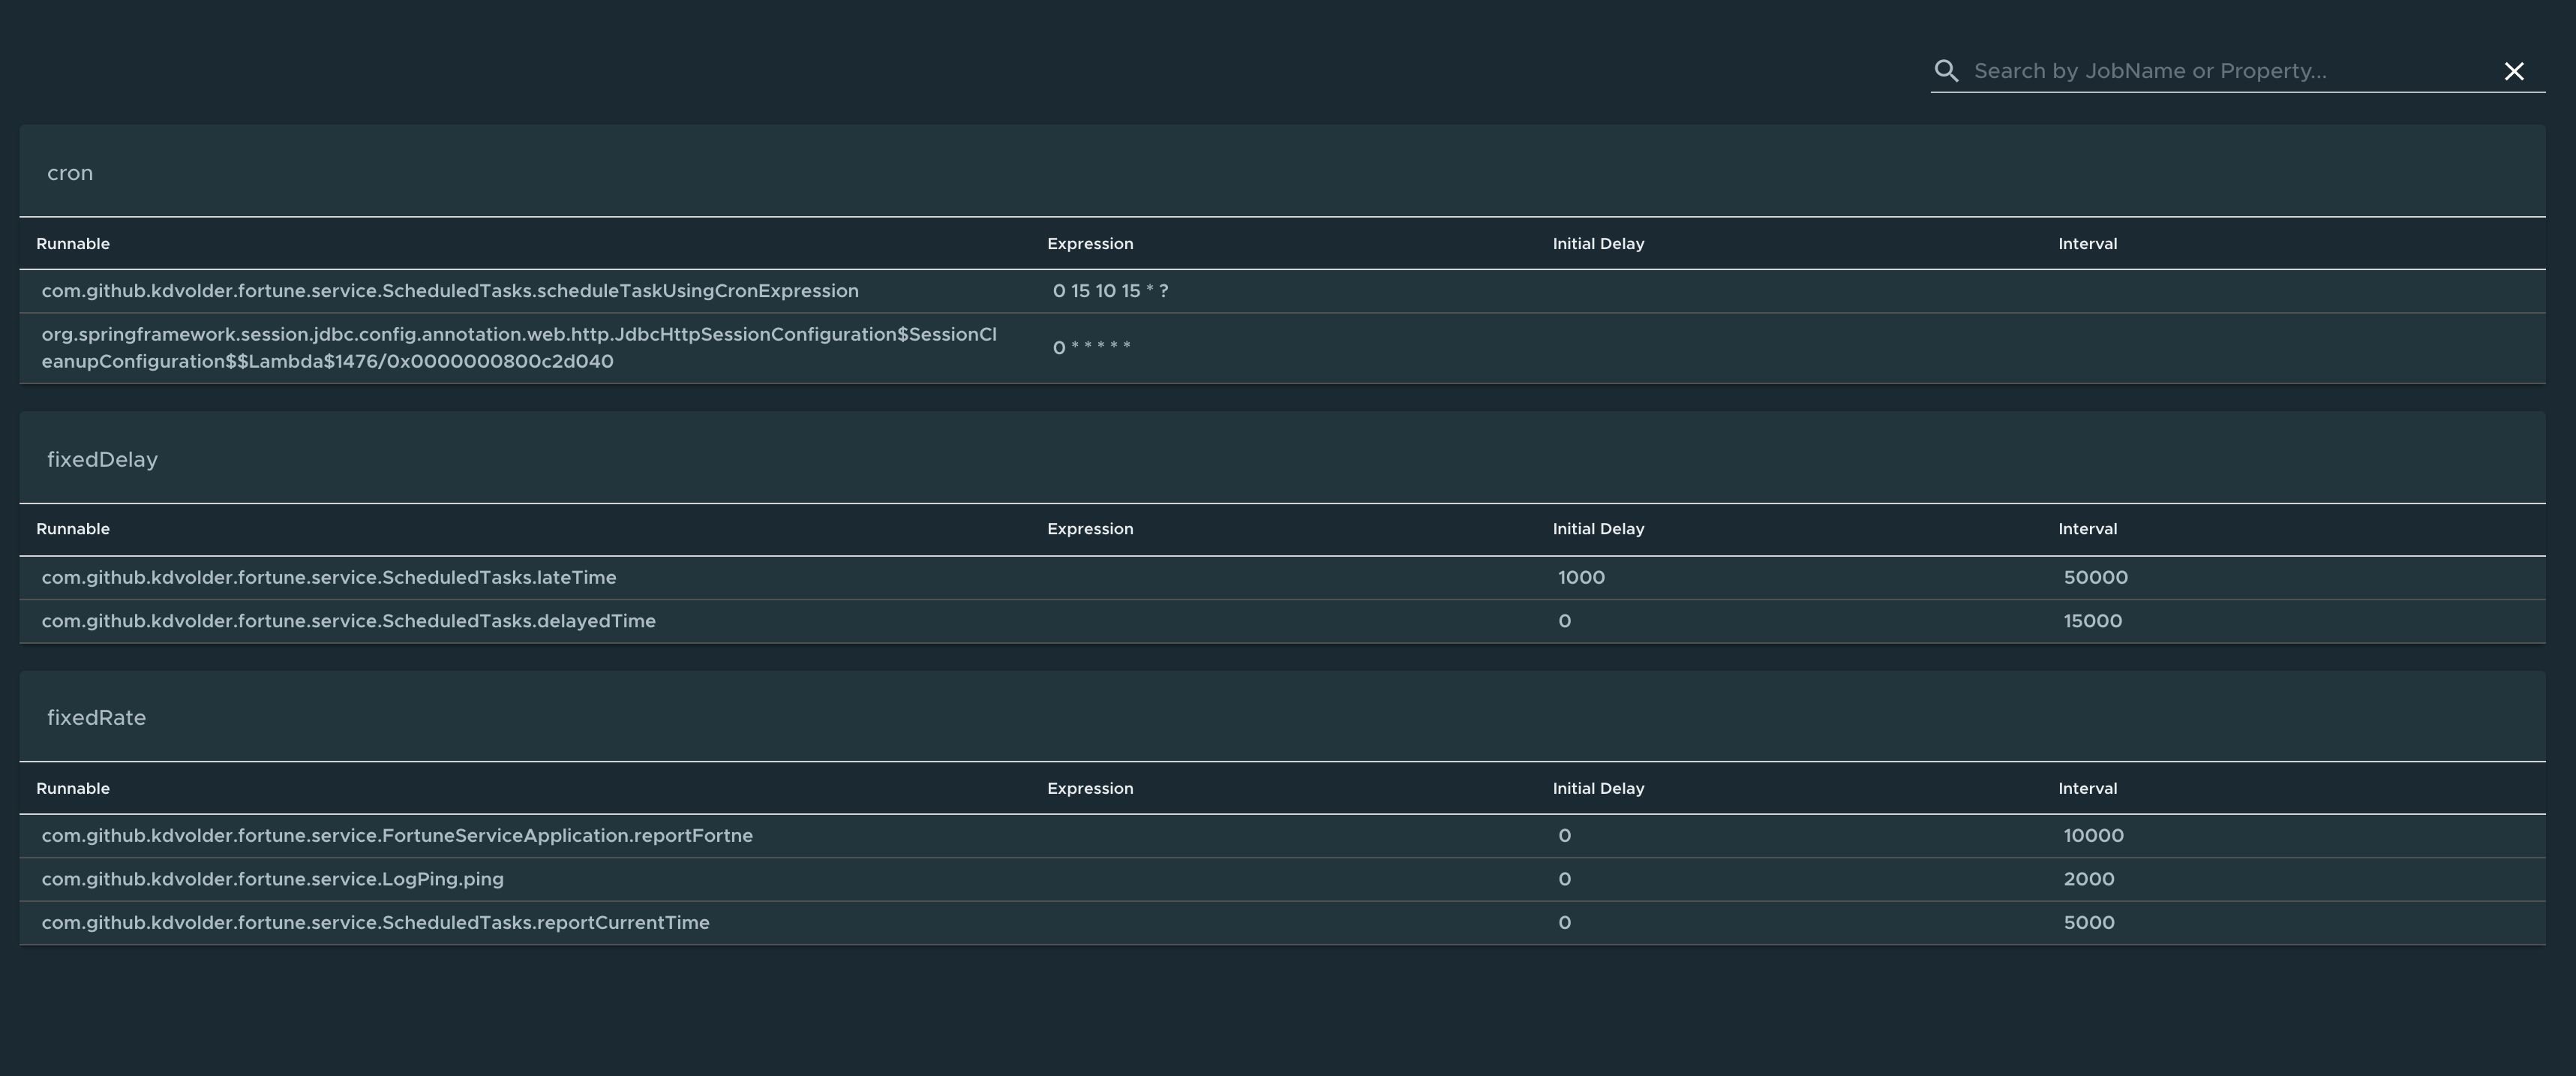
Scheduled Tasks page
To go to the Scheduled Tasks page, select the Scheduled Tasks option from the Information Category drop-down menu.
The scheduled tasks page provides information about the application’s scheduled tasks. It includes cron tasks, fixed delay tasks and fixed rate tasks, custom tasks and the properties associated with them.
You can search for a particular property or a task in the search bar to retrieve the task or property details.
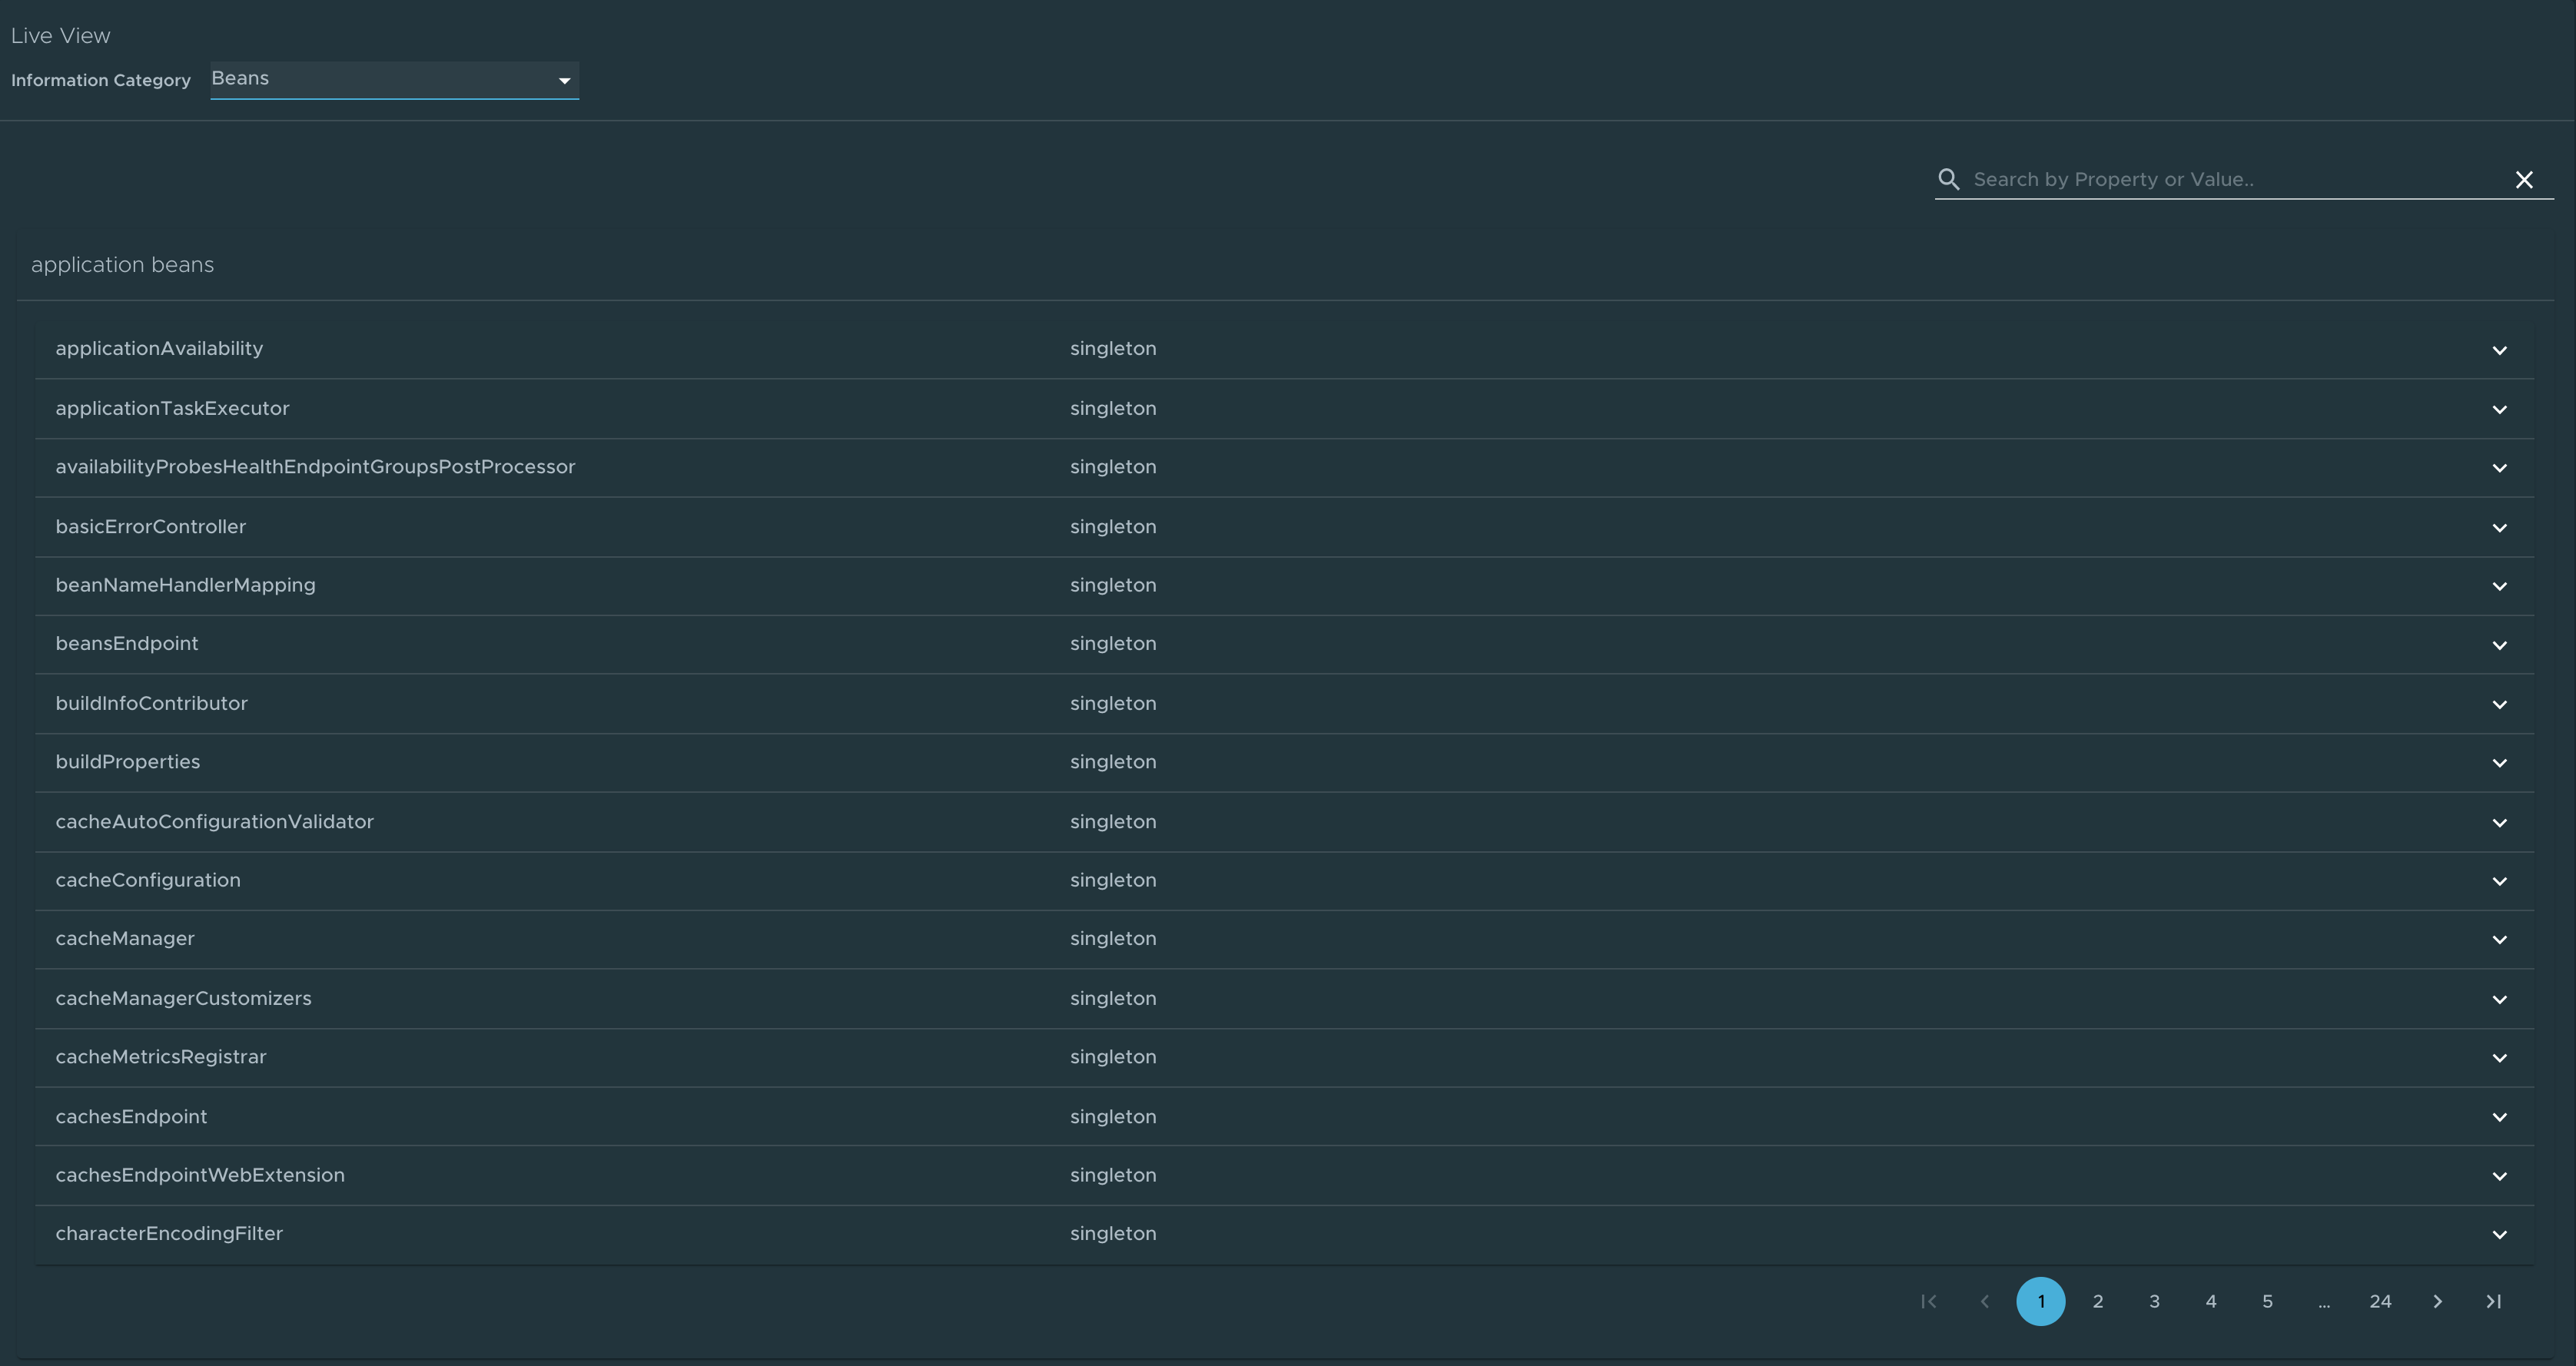
Beans page
To go to the Beans page, select the Beans option from the Information Category drop-down menu. The beans page provides information about a list of all application beans and its dependencies. It displays the information about the bean type, dependencies, and its resource. You can search by the bean name or its corresponding fields.
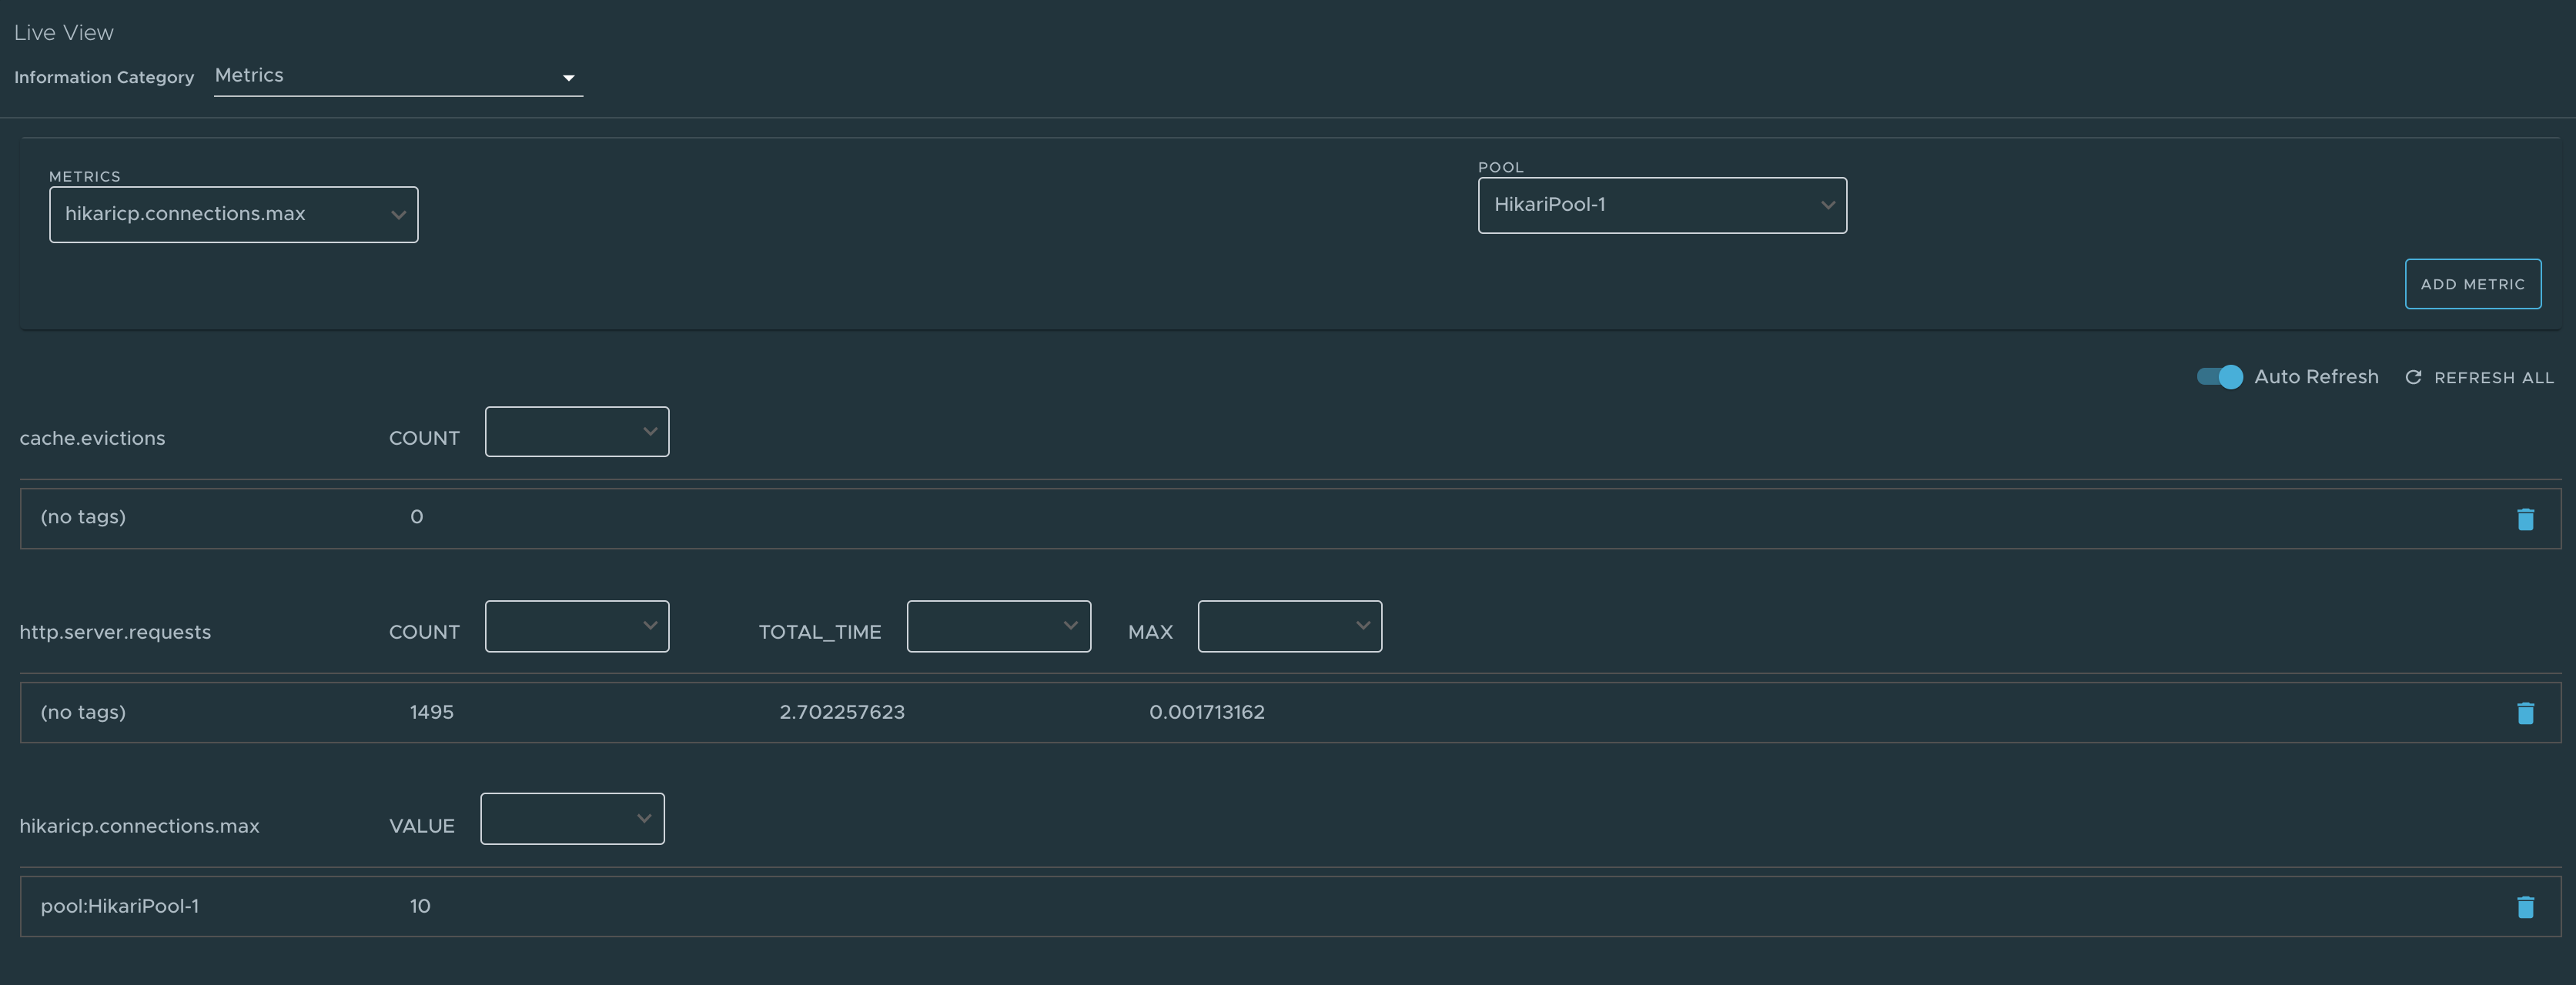
Metrics page
To go to the Metrics page, select the Metrics option from the Information Category drop-down menu.
The metrics page provides access to application metrics information. You can choose from the list of various metrics available for the application, such as jvm.memory.used, jvm.memory.max, http.server.request, and so on.
After the metric is chosen, you can view the associated tags. You can choose the value of each tag based on filtering criteria. Clicking Add Metric adds the metric to the page which is refreshed every 5 seconds by default.
You can pause the auto refresh feature by deactivating the Auto Refresh toggle. You can refresh the metrics manually by clicking Refresh All. The format of the metric value can be changed according to your needs. They can delete a particular metric by clicking the minus symbol in the same row.
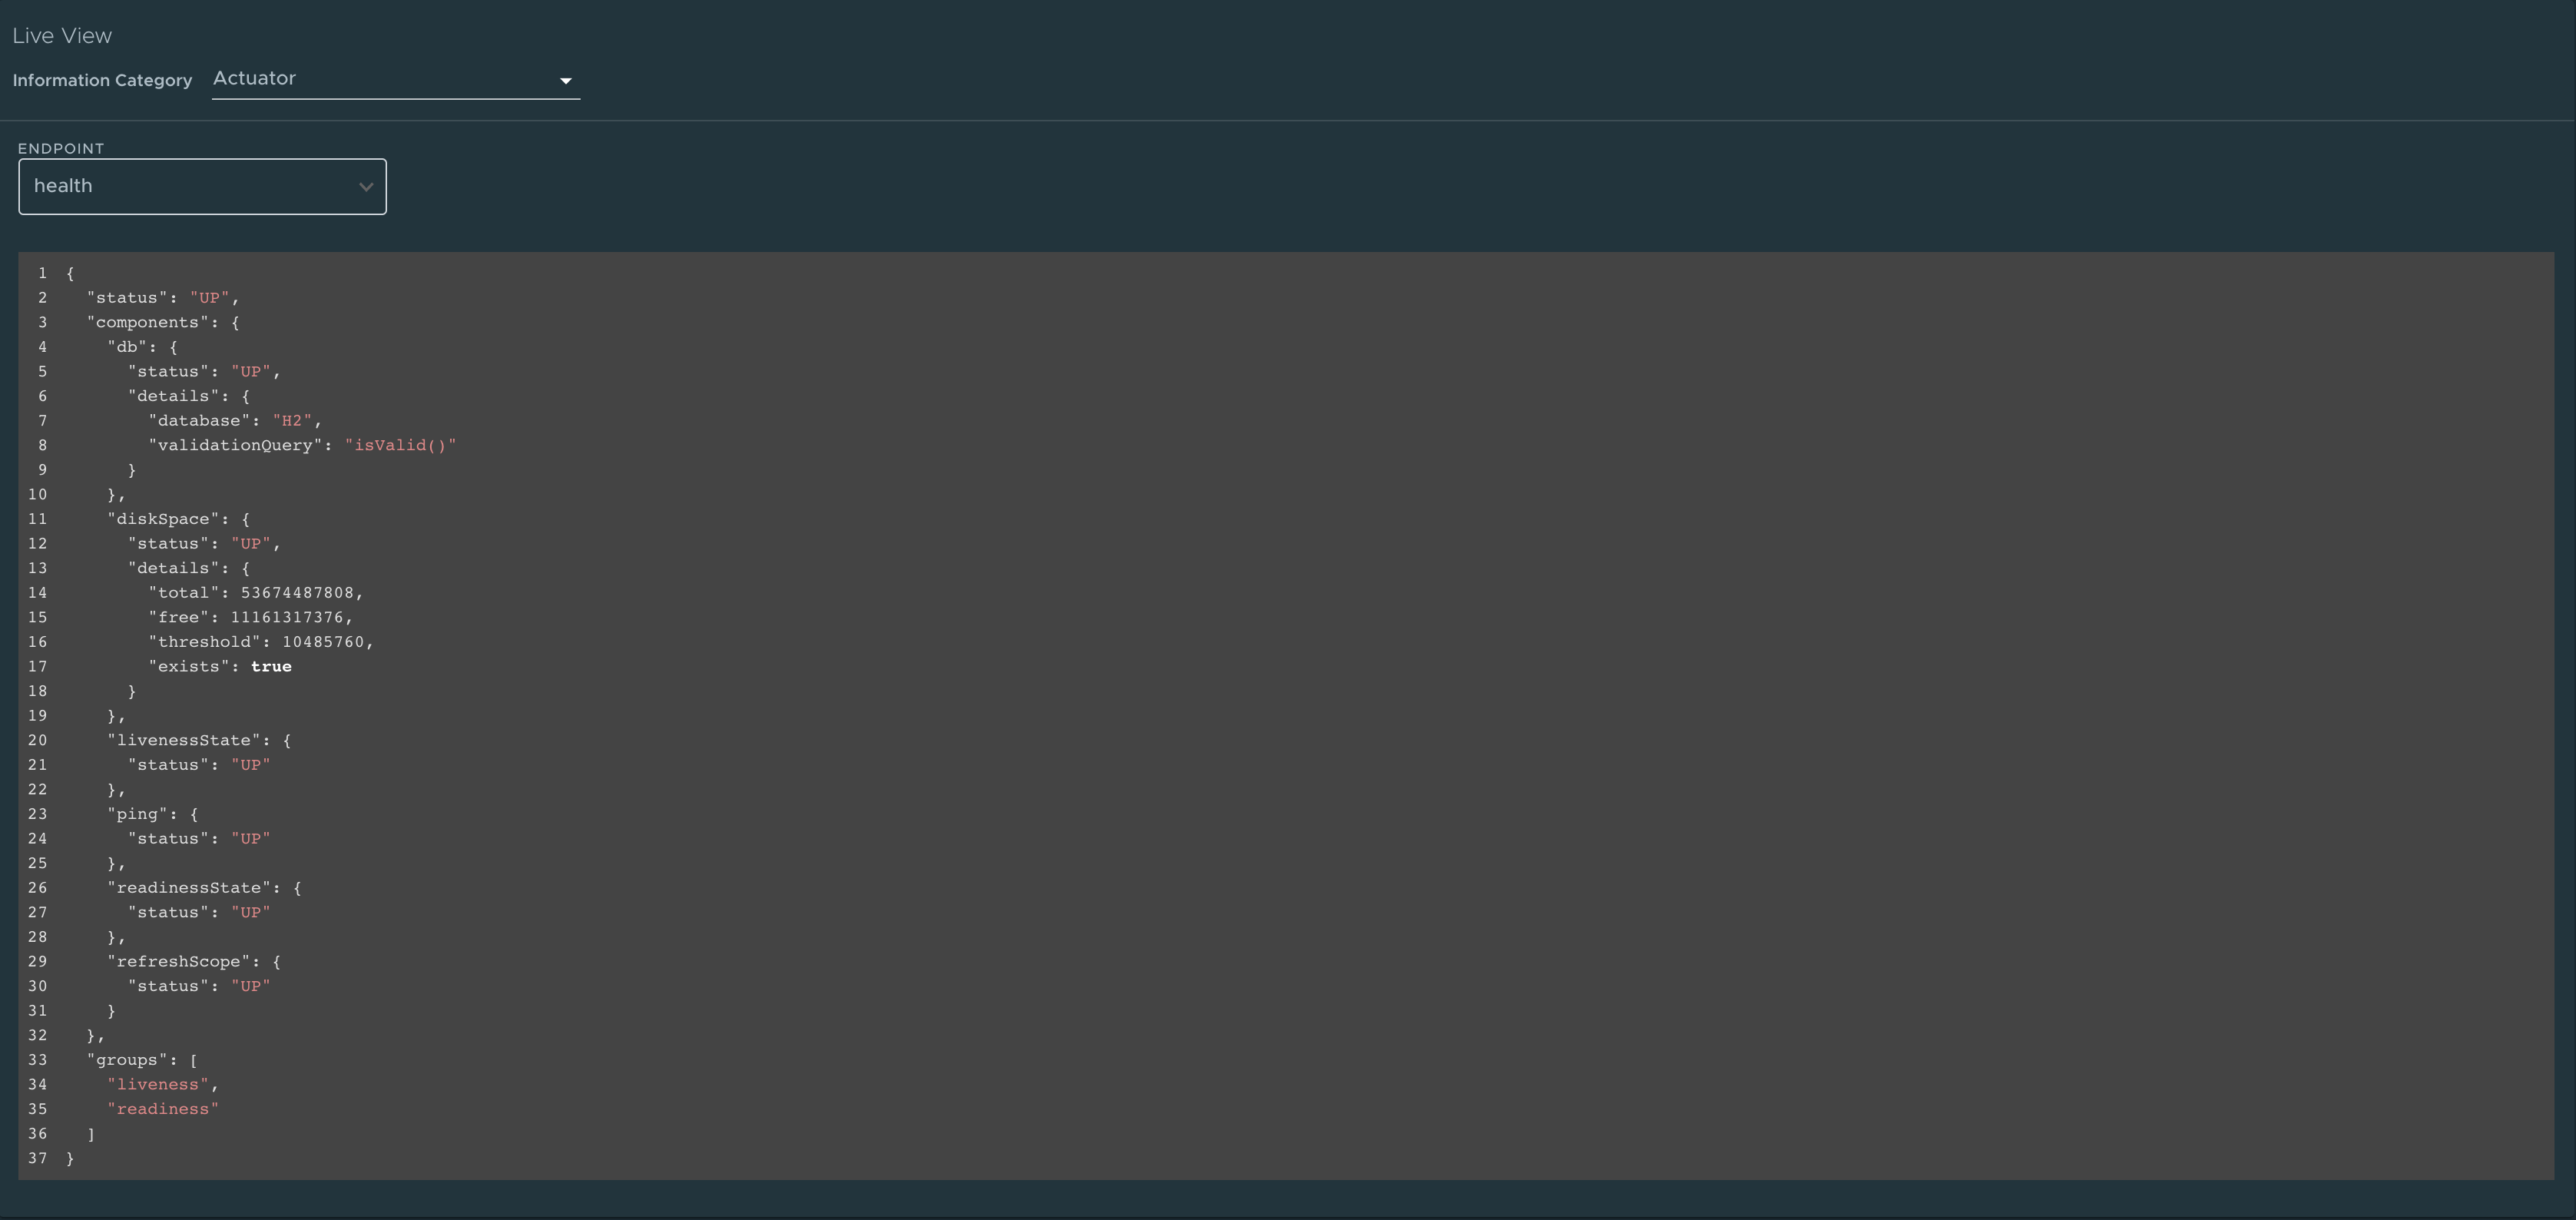
Actuator page
To go to the Actuator page, select the Actuator option from the Information Category drop-down menu. The actuator page provides a tree view of the actuator data. You can choose from a list of actuator endpoints and parse through the raw actuator data.
Troubleshooting
You might run into cases where a workload running on your cluster does not appear in the Application Live View overview, the detail pages do not load any information while running, or similar issues. If you encounter issues, see Troubleshooting in the Application Live View documentation.
