Integrate Live Hover by using Spring Boot Tools
For more information about this feature, see the Live application information hovers section of the Spring Boot Tools Marketplace page.
Prerequisites
To integrate Live Hover by using Spring Boot Tools you need:
- A Tanzu Spring Boot application, such as tanzu-java-web-app
- Spring Boot Extension Pack (includes Spring Boot Dashboard) extension
Activate the Live Hover feature
Activate the Live Hover feature by enabling it in Code > Preferences > Settings > Extensions > Tanzu Developer Tools.
Deploy a Workload to the Cluster
Follow these steps to deploy the workload for an app to a cluster, making live hovers appear. The examples in some steps reference the sample tanzu-java-web-app.
-
Clone the repository by running:
git clone REPOSITORY-ADDRESSWhere
REPOSITORY-ADDRESSis your repository address. For example,https://github.com/vmware-tanzu/application-accelerator-samples. -
Open the project in VS Code, with the Live Hover feature enabled, by running:
TAP_LIVE_HOVER=true code ./PROJECT-DIRECTORYWhere
PROJECT-DIRECTORYis your project directory. For example,./application-accelerator-samples/tanzu-java-web-app. -
Verify that you are targeting the cluster on which you want to run the workload by running:
kubectl cluster-infoFor example:
$ kubectl cluster-info
Kubernetes control plane is running at https://...
CoreDNS is running at https://...

To further debug and diagnose cluster problems, use 'kubectl cluster-info dump'.
Tanzu Developer Tools for VS Code periodically connects to your cluster to search for pods from which live data can be extracted and shown. Tanzu Developer Tools for VS Code uses your current context from
~/.kube/configto choose which cluster to connect with. -
If you don’t have the workload running yet, run
Tanzu: Apply Workloadfrom the Command Palette. Tanzu Developer Tools for VS Code periodically searches for pods in your cluster that correspond to the workload configurations it finds in your workspace. -
The workload takes time to build and then start a running pod. To see if a pod has started running, run:
kubectl get podsFor example:
$ kubectl get pods
NAME                                                   READY   STATUS      RESTARTS   AGE
tanzu-java-web-app-00001-deployment-8596bfd9b4-5vgx2   2/2     Running     0          20s
tanzu-java-web-app-build-1-build-pod                   0/1     Completed   0          2m26s
tanzu-java-web-app-config-writer-fpnzb-pod             0/1     Completed   0          67s
In this example, live data can be extracted from the
...-0001-deployment-...pod. -
Open a Java file, such as
HelloController.java. After a delay of up to 30 seconds, because of a 30-second polling loop, green highlights appear in your code.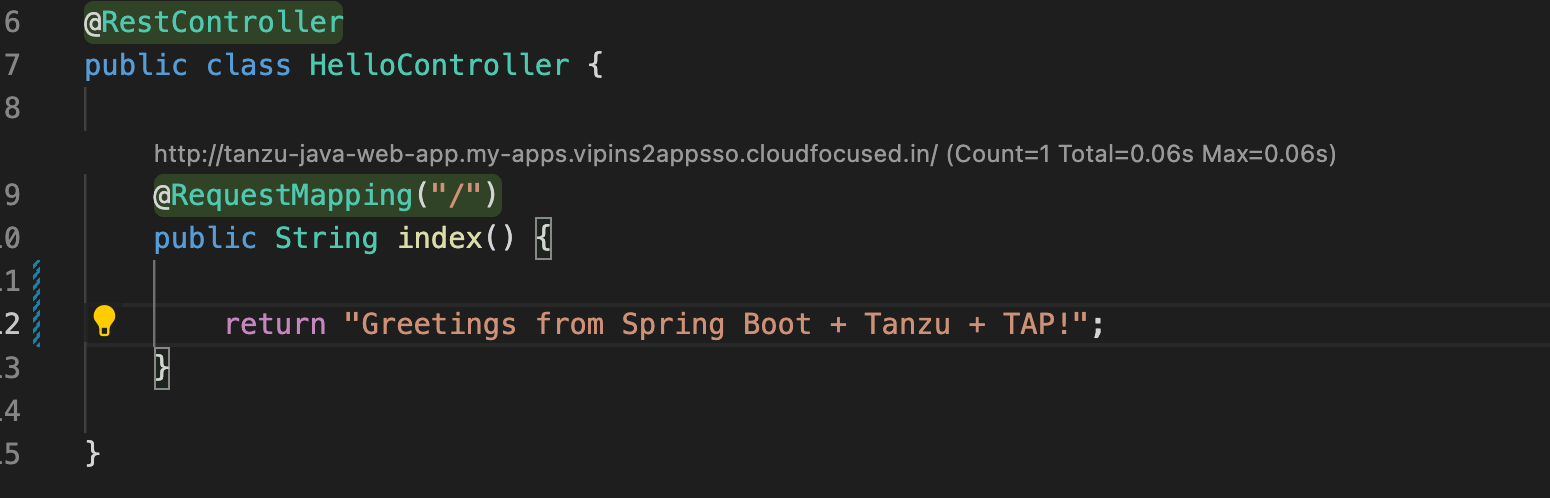
-
Hover over any of the bubbles to see live information about the corresponding element.
-
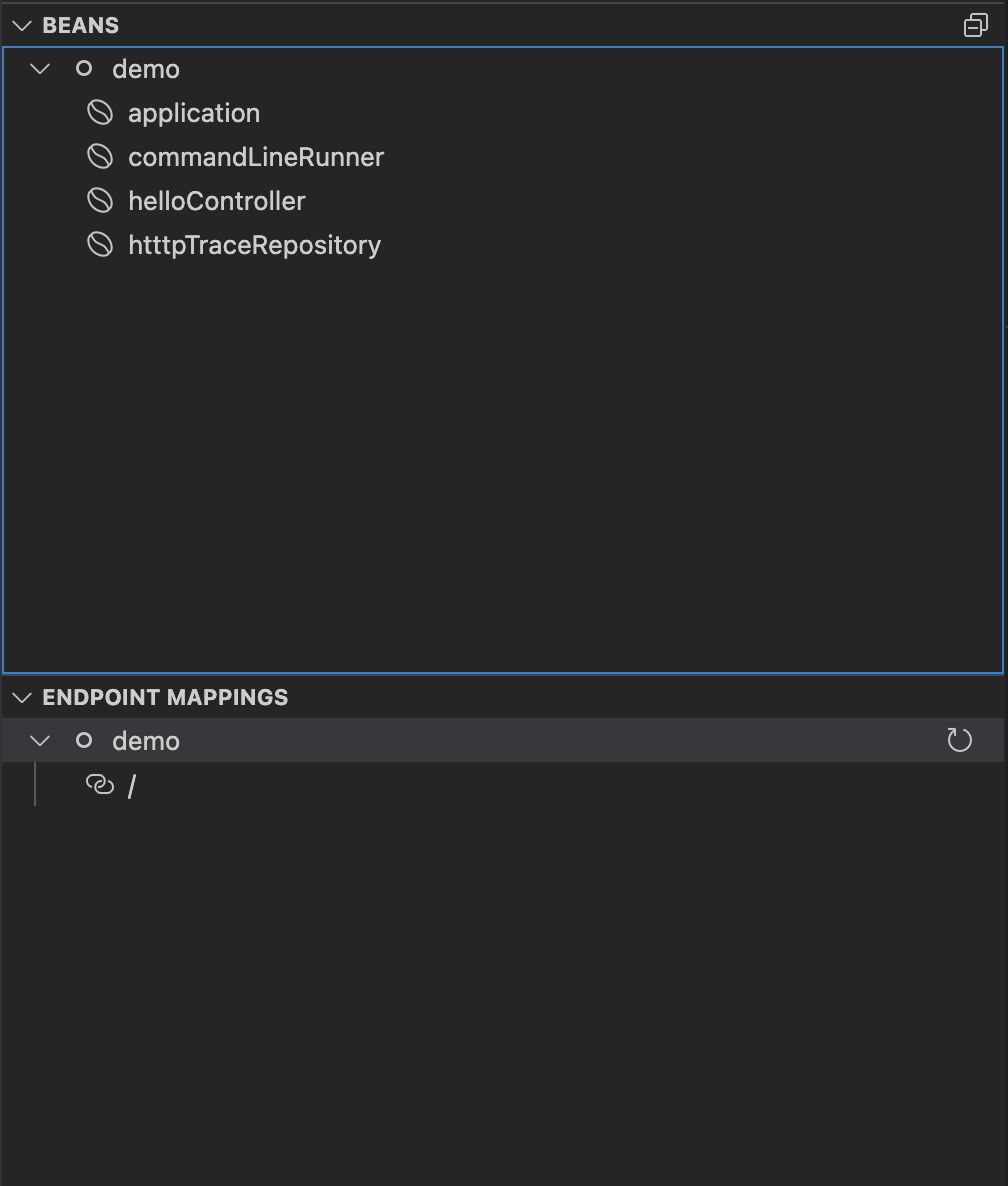
The
Live BeansandLive Endpoint Mappinginformation are displayed in Spring Boot Dashboard. To view the Spring Boot Dashboard, runView: Show Spring Boot Dashboardfrom the Command Palette.