


Use Tanzu Developer Tools for Visual Studio
This topic tells you how to use VMware Tanzu Developer Tools for Visual Studio.
NoteThis extension is in the beta stage of development.
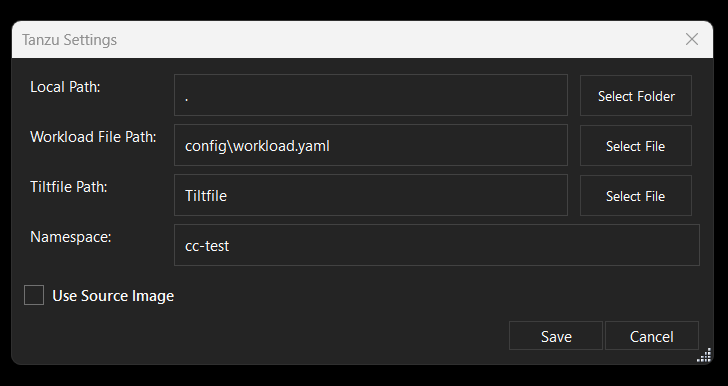
Configure settings
To configure settings, right-click anywhere in the Solution Explorer and click Tanzu > Settings….
Workload Actions
The extension enables you to apply, debug, and Live Update your application on a Kubernetes cluster that has Tanzu Application Platform. The developer sandbox experience enables you to Live Update your code, and simultaneously debug the updated code, without deactivating Live Update.
Apply a workload
To apply a workload, right-click anywhere in the Solution Explorer and click Tanzu > Apply Workload. Alternatively, right-click an associated workload in the Tanzu Panel and click Apply Workload.
Delete a workload
To delete a workload, right-click anywhere in the Solution Explorer and click Tanzu > Delete Workload. Alternatively, right-click an associated workload in the Tanzu Panel and click Delete Workload.
Start debugging on the cluster
To remote debug a workload, right-click anywhere in the Solution Explorer and click Tanzu > Debug Workload. Alternatively, right-click an associated workload in the Tanzu Panel and click Debug Workload.
CautionDo not use the red square Stop button to end your debugging session. Using the red square Stop button might cause the Tanzu Application Platform workload to fail. Instead, in the top menu click Debug > Detach All.
If the name of your running app process (the app DLL process), does not match the name of your .NET project as shown in the Visual Studio Solution Explorer, the remote debugging agent might fail to attach.
Live Update
See the following sections for how to use Live Update.
Start Live Update
Ensure that the following Tanzu Settings parameters are set:
- Local Path, which is the path on the local file system to a directory of source code to build.
- Namespace, which is the namespace that workloads are deployed into. Optional.
- Source Image, which is the registry location for publishing local source code. For example,
registry.io/yourapp-source. It must include both a registry and a project name. The source image parameter is not needed if you configured Local Source Proxy.
To start Live Update, right-click anywhere in the Solution Explorer and click Tanzu > Start Live Update. Alternatively, right-click an associated workload in the Tanzu Panel and click Start Live Update.
After starting Live Update, local builds changes are synchronized with the container.
Stop Live Update
To stop Live Update, right-click anywhere in the Solution Explorer and click Tanzu > Stop Live Update. Alternatively, right-click an associated workload in the Tanzu Panel and click Stop Live Update.
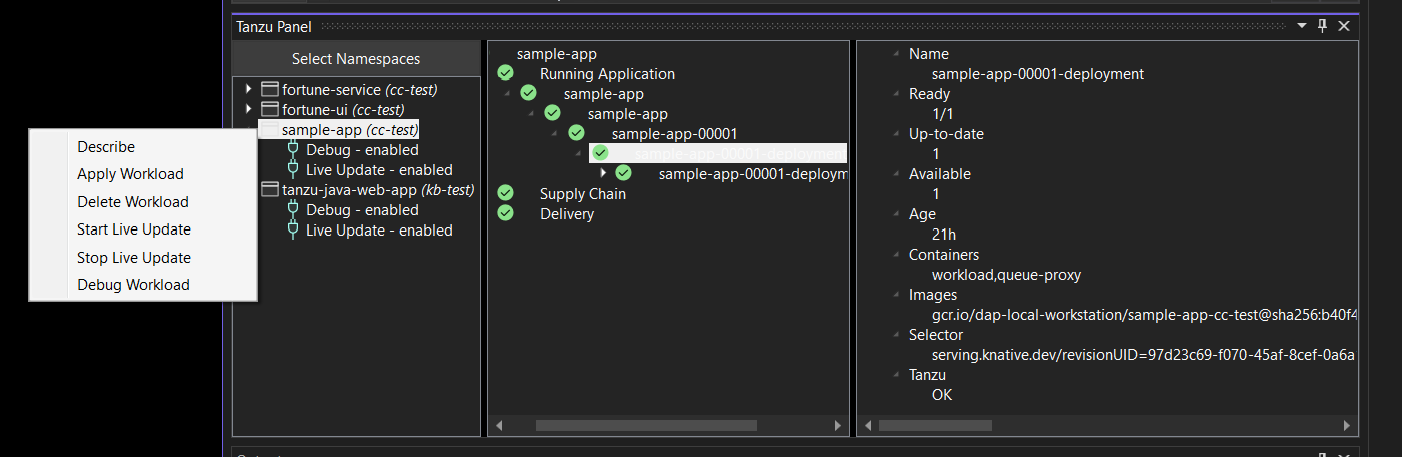
Tanzu Workloads panel
The current state of the workloads is visible in the Tanzu Workloads view. This view is a separate section in the bottom of the Explorer view in the Side Bar. The view shows the current status of each workload, namespace, and cluster. It also shows whether Live Update and Debug is running, stopped, or deactivated.
The Tanzu Activity tab in the Panels view enables developers to visualize the supply chain, delivery, and running application pods. The tab enables a developer to view and describe logs on each resource associated with a workload from within their IDE. The tab displays detailed error messages for each resource in an error state.
Workload commands are available from the Tanzu Workloads panel on workloads that have an associated module in the current project.
This association is based on a module name and a workload name matching. For example, a project with a module named my-app is associated with a deployed workload named my-app.
When taking an action from the Tanzu Workloads panel, the action uses the namespace of the deployed workload regardless of the configuration in the module.
For example, you might have a Live Update configuration with a namespace argument of my-apps-1, but running the action from a deployed workload in namespace my-apps-2 starts a Live Update session with a namespace argument of my-apps-2.
The Tanzu Workloads panel uses the cluster and defaults to the namespace specified in the current kubectl context. To view the Tanzu Workloads panel, right-click anywhere in the Solution Explorer and click Tanzu > View Workloads.
Extension logs
The extension creates log entries in two files named tanzu-dev-tools-{GUID}.log and tanzu-language-server-{GUID}.log. These files are in the directory where Visual Studio Installer installed the extension.
To find the log files from PowerShell, run:
dir $Env:LOCALAPPDATA\Microsoft\VisualStudio\*\Extensions\*\Logs\tanzu-*.log
To find the log files from CMD, run:
dir %LOCALAPPDATA%\Microsoft\VisualStudio\*\Extensions\*\Logs\tanzu-*.log
You can override the log file paths by setting the environment variables TANZU_DT_LOG and TANZU_LS_LOG.
