With App Autoscaler, you can scale an app in your TAS for VMs deployment based on a custom metric. This tutorial walks you through the steps.
Overview
In a VMware Tanzu Application Service for VMs (TAS for VMs) deployment, Autoscaler can automatically scale apps based on custom metrics. The following table describes the main components involved in this workflow and how they correspond to steps in this tutorial.
| Component | Description | Related Tutorial Steps |
|---|---|---|
| App | The app must emit custom metrics by exposing a Prometheus endpoint. This tutorial includes a sample Spring app, java-spring-security, that emits such metrics. For more information about Prometheus, see the Prometheus documentation. |
Review the Sample App and Push the Sample App |
| Metric Registrar | The Metric Registrar is a component of TAS for VMs that allows you to export custom app metrics to Loggregator. You issue commands to the Metric Registrar through the Metric Registrar CLI plug-in. For more information about the Metric Registrar, see Metric Registrar and Custom App Metrics. | Register a Custom Metrics Endpoint |
| App Autoscaler | Autoscaler is a service integrated with Apps Manager that automatically scales apps in your TAS for VMs deployment based on the scaling metrics or schedule that you configure. For more information, see Scaling an App Using App Autoscaler. | Create and Autoscaling Rule and Trigger Scaling |
Prerequisites
This tutorial requires the following:
- A TAS for VMs deployment in which the Metric Registrar is activated. To configure the Metric Registrar, see Configure the Metric Registrar in Metric Registrar and Custom App Metrics.
- Access to Apps Manager in the TAS for VMs deployment. To access Apps Manager, see Logging In to Apps Manager.
- The ability to push an app to the TAS for VMs deployment. For more information, see Prerequisites in Pushing an App and Manage Users and Roles in Getting Started with the cf CLI.
- You have
SpaceDeveloperpermissions in at least one space. - The Cloud Foundry Command-Line Interface (cf CLI). To install the cf CLI, see Installing the cf CLI.
- A Java 17 JRE.
- Access to a command-line for running commands such as cf CLI and git commands.
Review the sample app
To review the code for the sample app, java-spring-security, see the metric-registrar-examples repository on GitHub. This sample app is a Spring app with a simple user interface (UI) that includes several buttons to call different endpoints. Some of these endpoints are instrumented to produce metrics.
You can see what the UI looks like in the Push the Sample App section, which includes a screenshot. The following sections provide some details about the code.
Dependencies
You can view the app dependencies in the build.gradle file.
The dependencies include Micrometer Prometheus, which creates a prometheus metrics endpoint at /actuator/prometheus that can be scraped by Metric Registrar.
Instrumentation
This section describes how the app is instrumented. Instrumentation refers to how metrics have been added for a particular function.
See the ExampleController.java file from the sample app code:
-
The
ExampleControllerclass includes aMeterRegistryobject, which is passed and set in the constructor.private MeterRegistry registry; private AtomicLong custom; public ExampleController(MeterRegistry registry) { this.registry = registry; this.custom = new AtomicLong(0L); } -
It also includes a
customvariable that is initialized in the constructor. In the customMetric handler, this variable gets passed to the registry and incremented or decremented.public ResponseEntity<String> customMetric(@RequestParam(value="inc", defaultValue="") String increment) { AtomicLong customGauge = registry.gauge("custom", this.custom); if (!"".equals(increment)) { customGauge.incrementAndGet(); } else { customGauge.decrementAndGet(); }Note The App Autoscaler only scales on a gauge, or metric, that can go up and down. The standard metrics of CPU, disk, HTTP throughput, and HTTP latency are all gauges.
Push the sample app
To push the sample app:
-
Open a terminal window and clone the git repository that contains the sample app:
git clone https://github.com/pivotal-cf/metric-registrar-examples.git -
Navigate to the
java-spring-securityapp directory:cd metric-registrar-examples/java-spring-security -
Build the app by running:
./gradlew build -
Push the app with a random route:
cf push java-spring-security --random-routeThe previous command returns output similar to the following example:
Waiting for app to start...
Uploaded droplet (60.5M)
Uploading complete
Cell 333e7fdf-806e-424d-b3a0-78967ecb6d28 stopping instance 6f345835-8beb-48a5-b578-921f5de442c6

name:              java-spring-security
requested state:   started
routes:            java-spring-security-random-route.cfapps.io
last uploaded:     Wed 28 Aug 11:02:33 PDT 2019
-
From the
routessection of the terminal output, record the URL of thejava-spring-securityapp. In the example output in the previous step, this URL istutorial-example-random-route.cfapps.io. -
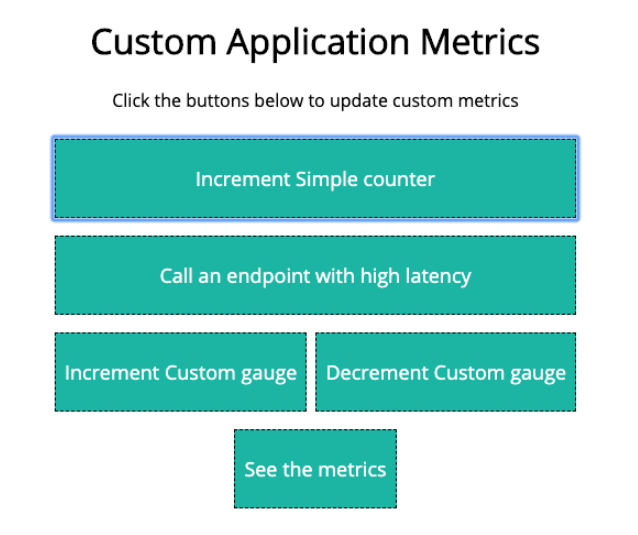
<a id="sample-app-ui>In a browser, go to the app URL you recorded in the previous step. The app UI looks like what you see in the following image:

It has the following buttons:
- Increment Custom gauge: Causes the
custommetric to increase by a value of1. You use this button in Trigger Scaling. - Decrement custom gauge: Causes the
custommetric to decrease by a value of1. - See the metrics: Opens
/actuator/prometheusin your browser. The Metric Registrar uses this page to collect metrics. You can use this page to view the values of thecustommetric and all metrics from the Micrometer Prometheus library. - Increment Simple counter and Call an endpoint with high latency: These buttons are not used in this tutorial. To learn more about the functions of these buttons, see java-spring-security on GitHub.
- Increment Custom gauge: Causes the
Register a custom metrics endpoint
When you want to your app to emit custom metrics, you register the app as a metric source with the Metric Registrar.
To register a custom metrics endpoint for the app:
-
Install the Metric Registrar CLI:
cf install-plugin -r CF-Community "metric-registrar" -
Register the metrics endpoint of the
java-spring-securityapp by running:cf register-metrics-endpoint java-spring-security /actuator/prometheus --insecureBecause the app dependencies include the Micrometer Prometheus library, there is automatically a metrics endpoint at
/actuator/prometheus.Caution When you include the
--insecureflag in the above command, the Metric Registrar scrapes the metrics endpoint on the default app port. Exposing metrics on the default app port makes the metrics available to anyone with access to the app. VMware strongly recommends that you do not use the--insecureflag in a production environment. Instead, specify an alternative port by including the--internal-portflag. Specifying an alternative port the--internal-portflag exposes the metrics endpoint on that port and limits access to the app. -
Install the Log Cache CLI by running:
cf install-plugin -r CF-Community "log-cache"Log Cache is a component of TAS for VMs that caches logs and metrics from across the platform.
-
View the app metrics as they are emitted using the command below. The
--followflag appends output as metrics are emitted.cf tail java-spring-security --envelope-class metrics --followThe output looks similar to the following example. The
custommetric displays in the output.
 Retrieving logs for app  in org sandbox / space development as example@user...

 2019-08-28T09:17:56.28-0700 [tutorial-example/1] GAUGE cpu:0.289158 percentage disk:135716864.000000 bytes disk_quota:1073741824.000000 bytes memory:399979315.000000 bytes memory_quota:2147483648.000000 bytes
 2019-08-28T09:17:56.50-0700 [tutorial-example/0] GAUGE custom:1.000000
<div class="note">
<span class="note__title">Note</span>
	<ul>
		<li>In the <code>java-spring-security</code> app UI, you must click <strong>Increment Custom gauge</strong> at least one time to cause the app to emit the <code>custom</code> metric.</li>
		<li>If you do not see output similar to the previous example, the Metric Registrar might not exist in your TAS for VMs deployment. To
		verify this, consult the operator of your TAS for VMs deployment.</li>
	</ul>
</div>
Create an autoscaling rule
Autoscaler is integrated with Apps Manager. You can create autoscaling rules in Apps Manager.
To create an autoscaling rule for the java-spring-security app that uses the custom metric as its scaling metric:
-
Log in to Apps Manager. For more information, see Logging In to Apps Manager.
-
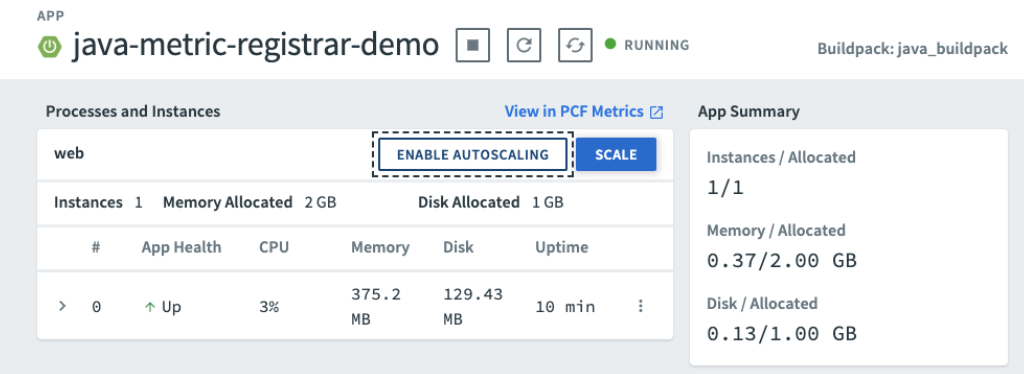
In Apps Manager, go to the
java-spring-securityapp overview. For more information, see View App Overview in Managing Apps and Service Instances Using Apps Manager. -
Click Enable Autoscaling.

-
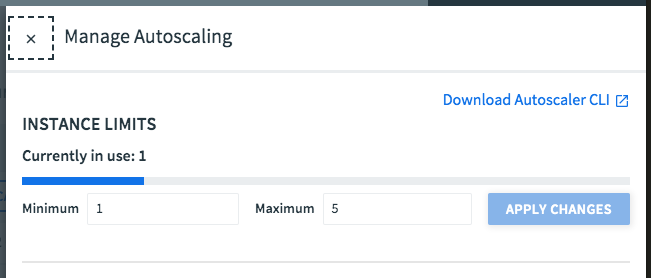
Click Manage Autoscaling.
-
Under Instance Limits, configure upper and lower scaling limits for the
java-spring-securityapp:- For Minimum, enter
1. - For Maximum, enter
5. - Click Apply Changes.
- For Minimum, enter
-
Under Instance Limits, configure upper and lower scaling limits for the
java-spring-securityapp:- For Minimum, enter
1. - For Maximum, enter
5. -
Click Apply Changes.

-
To create an autoscaling rule:
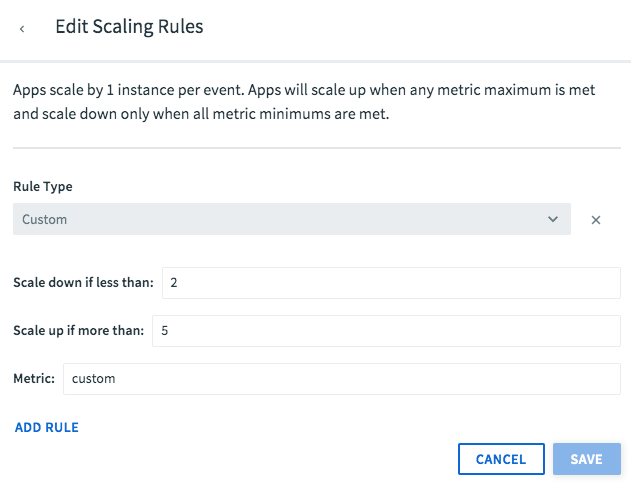
- Next to Scaling Rules, click Edit. The Edit Scaling Rules window appears.
- Click Add rule. The Select type dropdown appears.
- From the Select type dropdown, select Custom. More configuration fields appear below.
- For Rule Type, select
Custom. - For Scale down if less than, enter
2. If the average value of thecustommetric falls below this number, Autoscaler scales the number of app instances down. - For Scale up if more than, enter
5. If the average value of thecustommetric rises above this number, Autoscaler scales the number of app instances up. - For Metric, enter
custom. - Click Save.
- For Minimum, enter

Trigger scaling
Now that you have pushed an app that emits a custom metric and configured autoscaling rules, you can trigger a scaling action. App Autoscaler scales the app when the custom metric goes above or below the threshold specified in the scaling rule.
To trigger scaling:
-
Go to the web UI of the app. Use the same URL from Push the Sample App.
-
Click Increment Custom gauge enough times to bring the custom metric over the threshold of
5that you set in the scaling rule. You can check the value of thecustommetric using the See Metrics button. -
Monitor the app page in Apps Manager for about two minutes. App Autoscaler begins to scale the app. It adds one instance at a time until it reaches the Maximum instance limit of
5.
Next steps
Now that you have completed this tutorial, try emitting custom metrics and creating scaling rules with your own app. Review the resources listed in the Overview section to learn more. Once you have instrumented your app to emit custom metrics, you can follow the steps outlined in this tutorial to scale based on those metrics.