


Logging and metrics architecture includes components that transport logs and metrics from your TAS for VMs deployment to destinations such as the Cloud Foundry Command-Line Interface (cf CLI), monitoring tools, or internal system components.
Log and metric egress is the process by which logs and metrics are transported from the your deployment to destinations such as the cf CLI, monitoring tools, or other internal system components. These logs and metrics can either flow directly from the VMs that produce them to their consumers, or pass through the Loggregator Firehose.

How logs and metrics egress from VMs
Logs and metrics are sent from VMs via the following process:
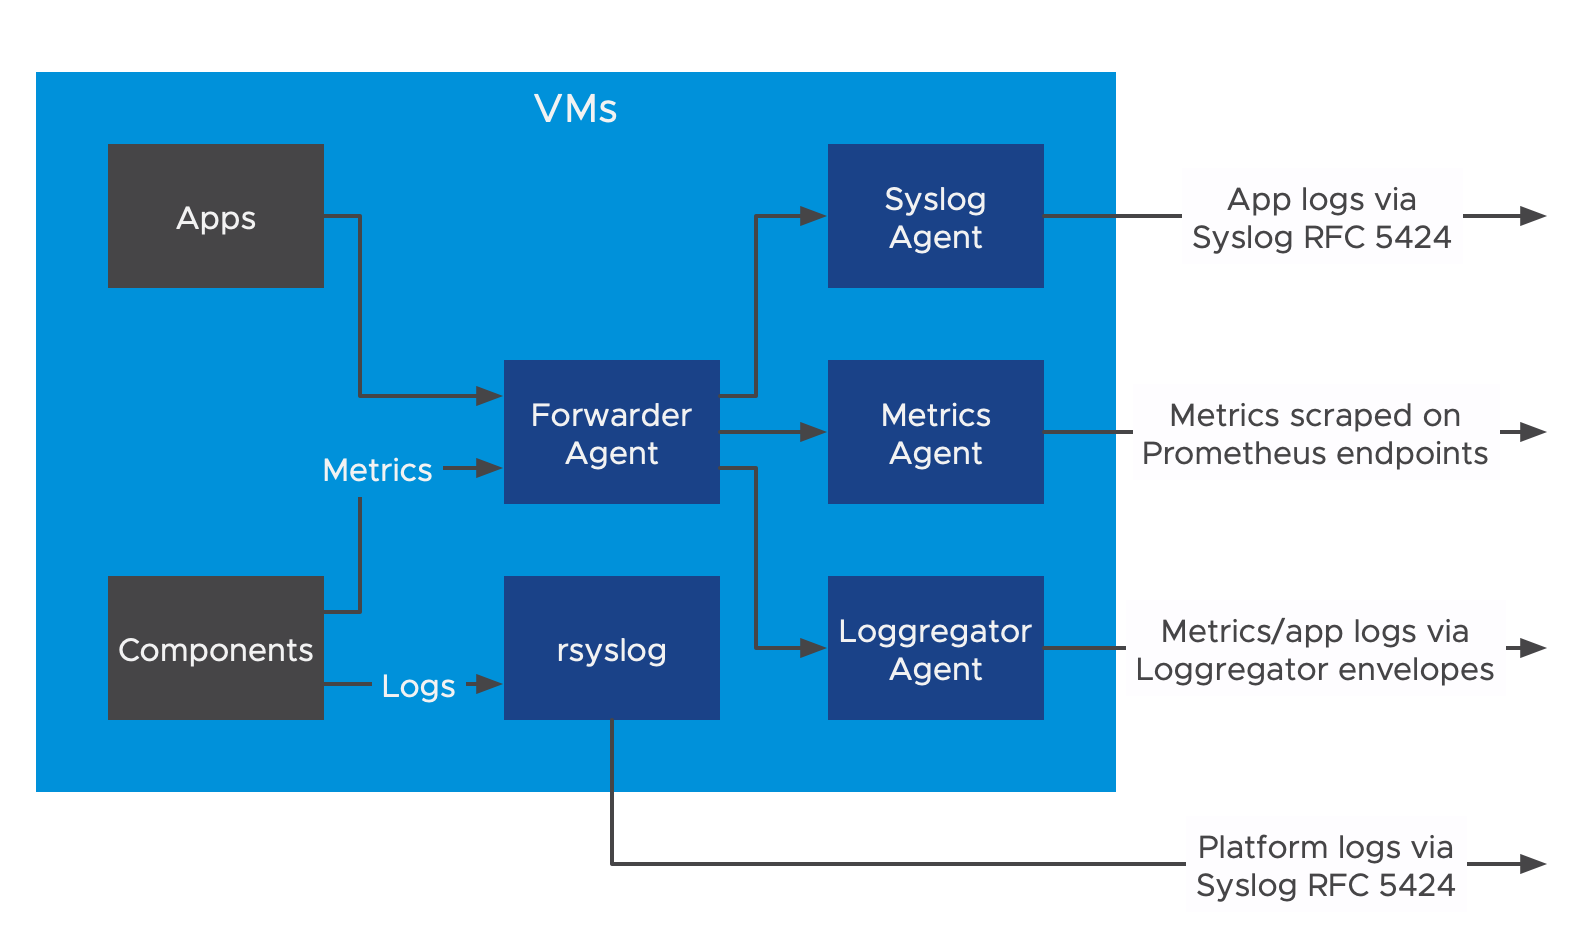
- Applications and components on the system emit logs and metrics.
- Logs and metrics pass through two forwarders:
- rsyslog, which sends platform logs in Syslog RFC5424 format.
- The Forwarder Agent, which sends metrics and application logs to three agents.
- Metrics and application logs are sent through each of the following:
- The Syslog Agent sends application logs in Syslog RFC5424 format to aggregate and application log destinations.
- The Metrics Agent exposes metrics for Prometheus-style scraping.
- The Loggregator Agent sends metrics and application logs to the Loggregator Firehose.
How the Firehose forwards logs and metrics
The Loggregator Firehose sends logs and metrics through the V1 and V2 Firehose APIs, via the following process:
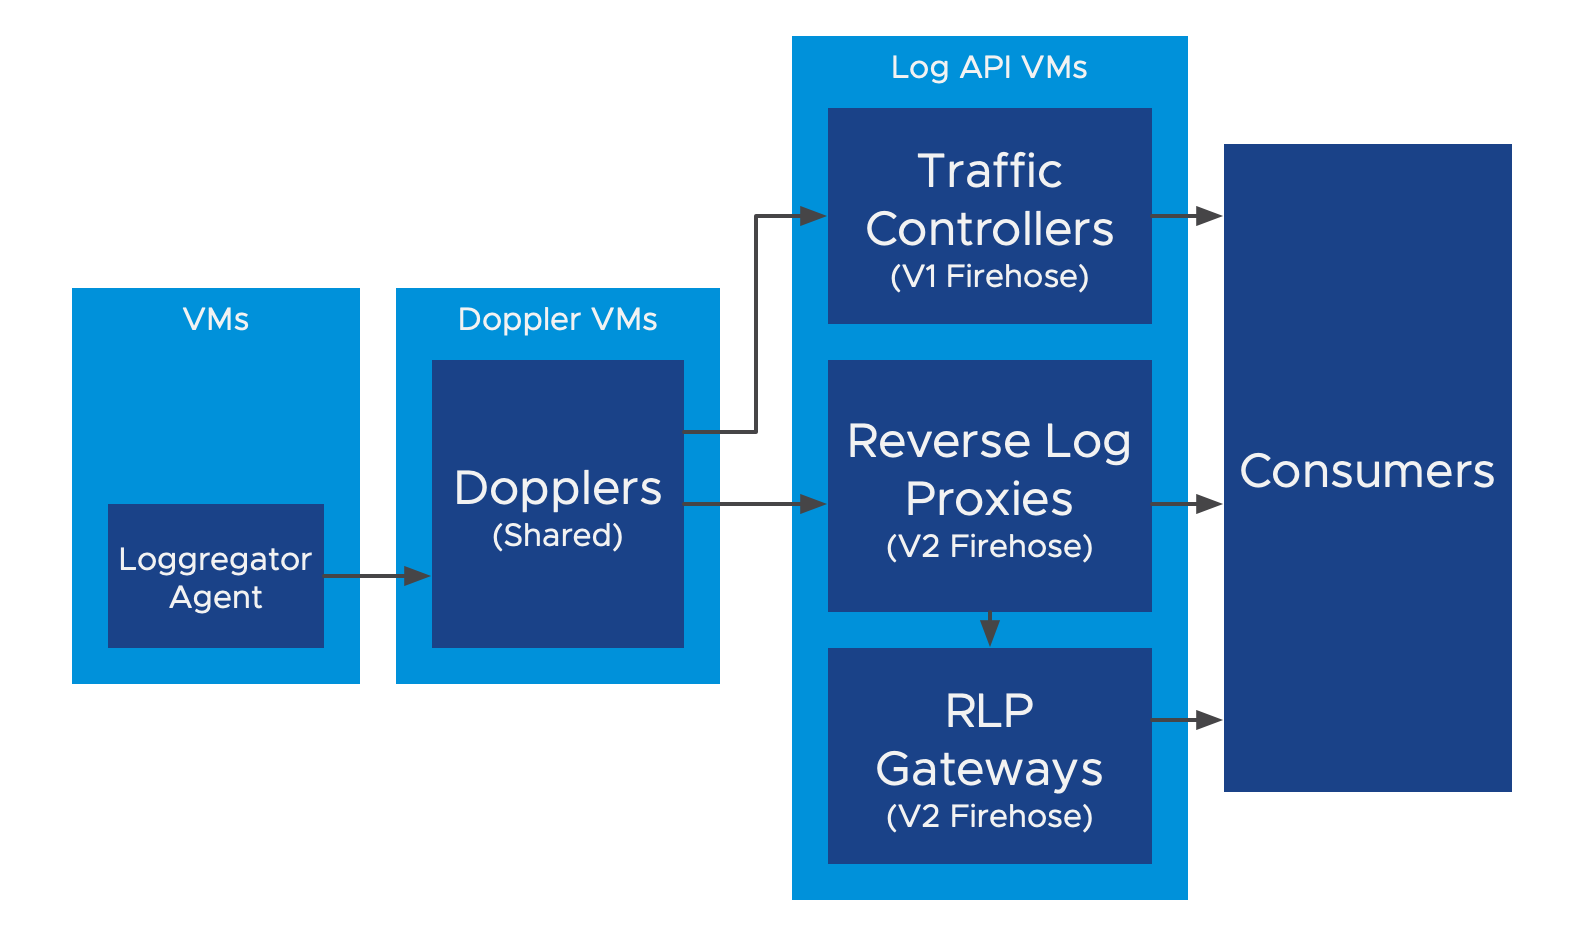
- The Loggregator Agent takes each log/metric and sends it to one downstream Doppler (distributing among a rondom subset of 5 Dopplers).
- Dopplers then make a copy of log/metric for each consumer and send them to the Traffic Controllers and Reverse Log Proxies for distribution.
- These two components forward logs and metrics differently:
- Traffic Controllers receive Websocket connections from V1 Firehose Consumers, and send logs/metrics as V1 Envelopes.
If any of these consumers start to fall behind, Traffic Controllers will log a slow consumer alert and disconnect that particular consumer. - Reverse Log Proxies receive gRPC connections from V2 Firehose Consumers, and send logs/metrics as V2 Envelopes.
If a consumer falls behind, the envelopes will just be dropped. - Reverse Log Proxy Gateways (RLP Gateways) receive HTTP connections from V2 Firehose consumers, and send logs/metrics as JSON-encoded V2 Envelopes.
Reverse Log Proxy Gateways connect to Reverse Log Proxies, rather than directly to Dopplers.
- Traffic Controllers receive Websocket connections from V1 Firehose Consumers, and send logs/metrics as V1 Envelopes.
How consumers receive logs and metrics
Consumers of logs and metrics may receive them through a few different paths:
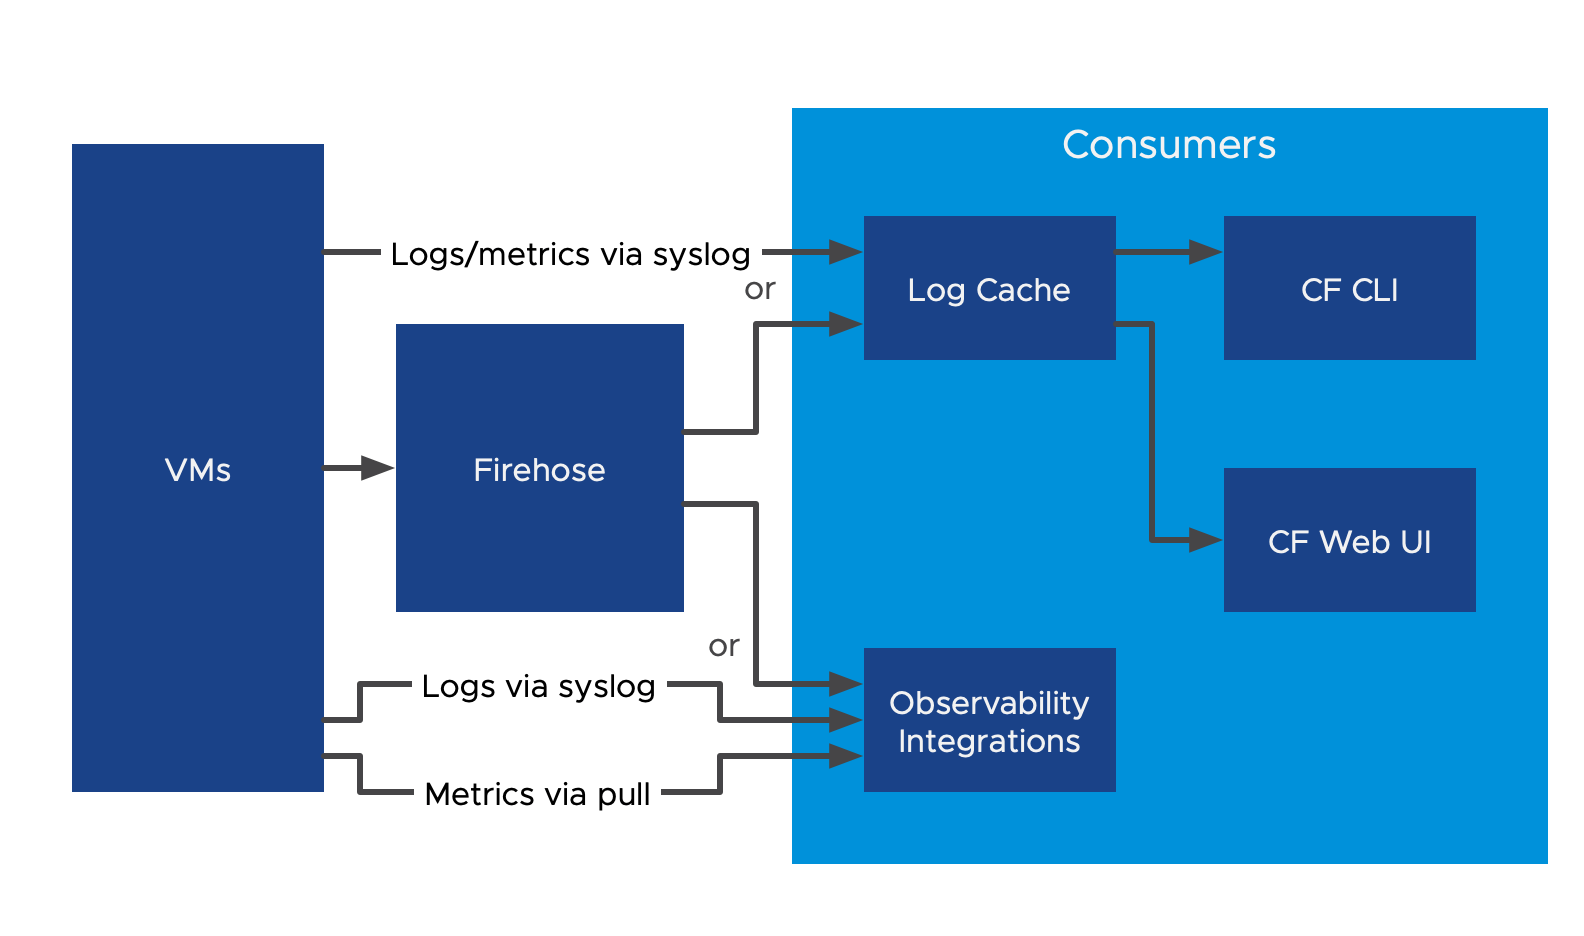
Log Cache provides a short-term snapshot of logs and metrics to the CF CLI and any CF Web UIs (such as Stratos or Tanzu Application Service Apps Manager). It receives logs and metrics either from the Firehose or directly from VMs via Syslog.
Observability integrations can consume logs and metrics via either:
- connecting to the Loggregator Firehose, or
- receiving logs in Syslog RFC 5424 format and scraping metrics from Prometheus endpoints.
Full Architecture references
The architectures described in this topic include components for collecting, storing, and forwarding logs and metrics.
Architecture reference diagrams
This section provides architecture diagrams that show the components that collect, store, and forward logs and metrics in your TAS for VMs deployment.
In VMware Tanzu Application Service for VMs (TAS for VMs) v2.13, Loggregator architecture uses Syslog Agents and removes Syslog Adapters.
Platform operators can also enable System Metrics Agents on all VMs deployed with TAS for VMs to collect system-level metrics.
Firehose architecture
The following diagram shows how logs and metrics are transported from components and apps in your deployment to Loggregator Firehose consumers, such as nozzles, monitoring tools, or third-party software.
You can use this diagram to:
- Understand the components that transport logs and metrics to the Firehose.
- Diagnose performance issues related to logging and metrics.
- Make decisions about how to scale the components or Firehose consumers described in this architecture.
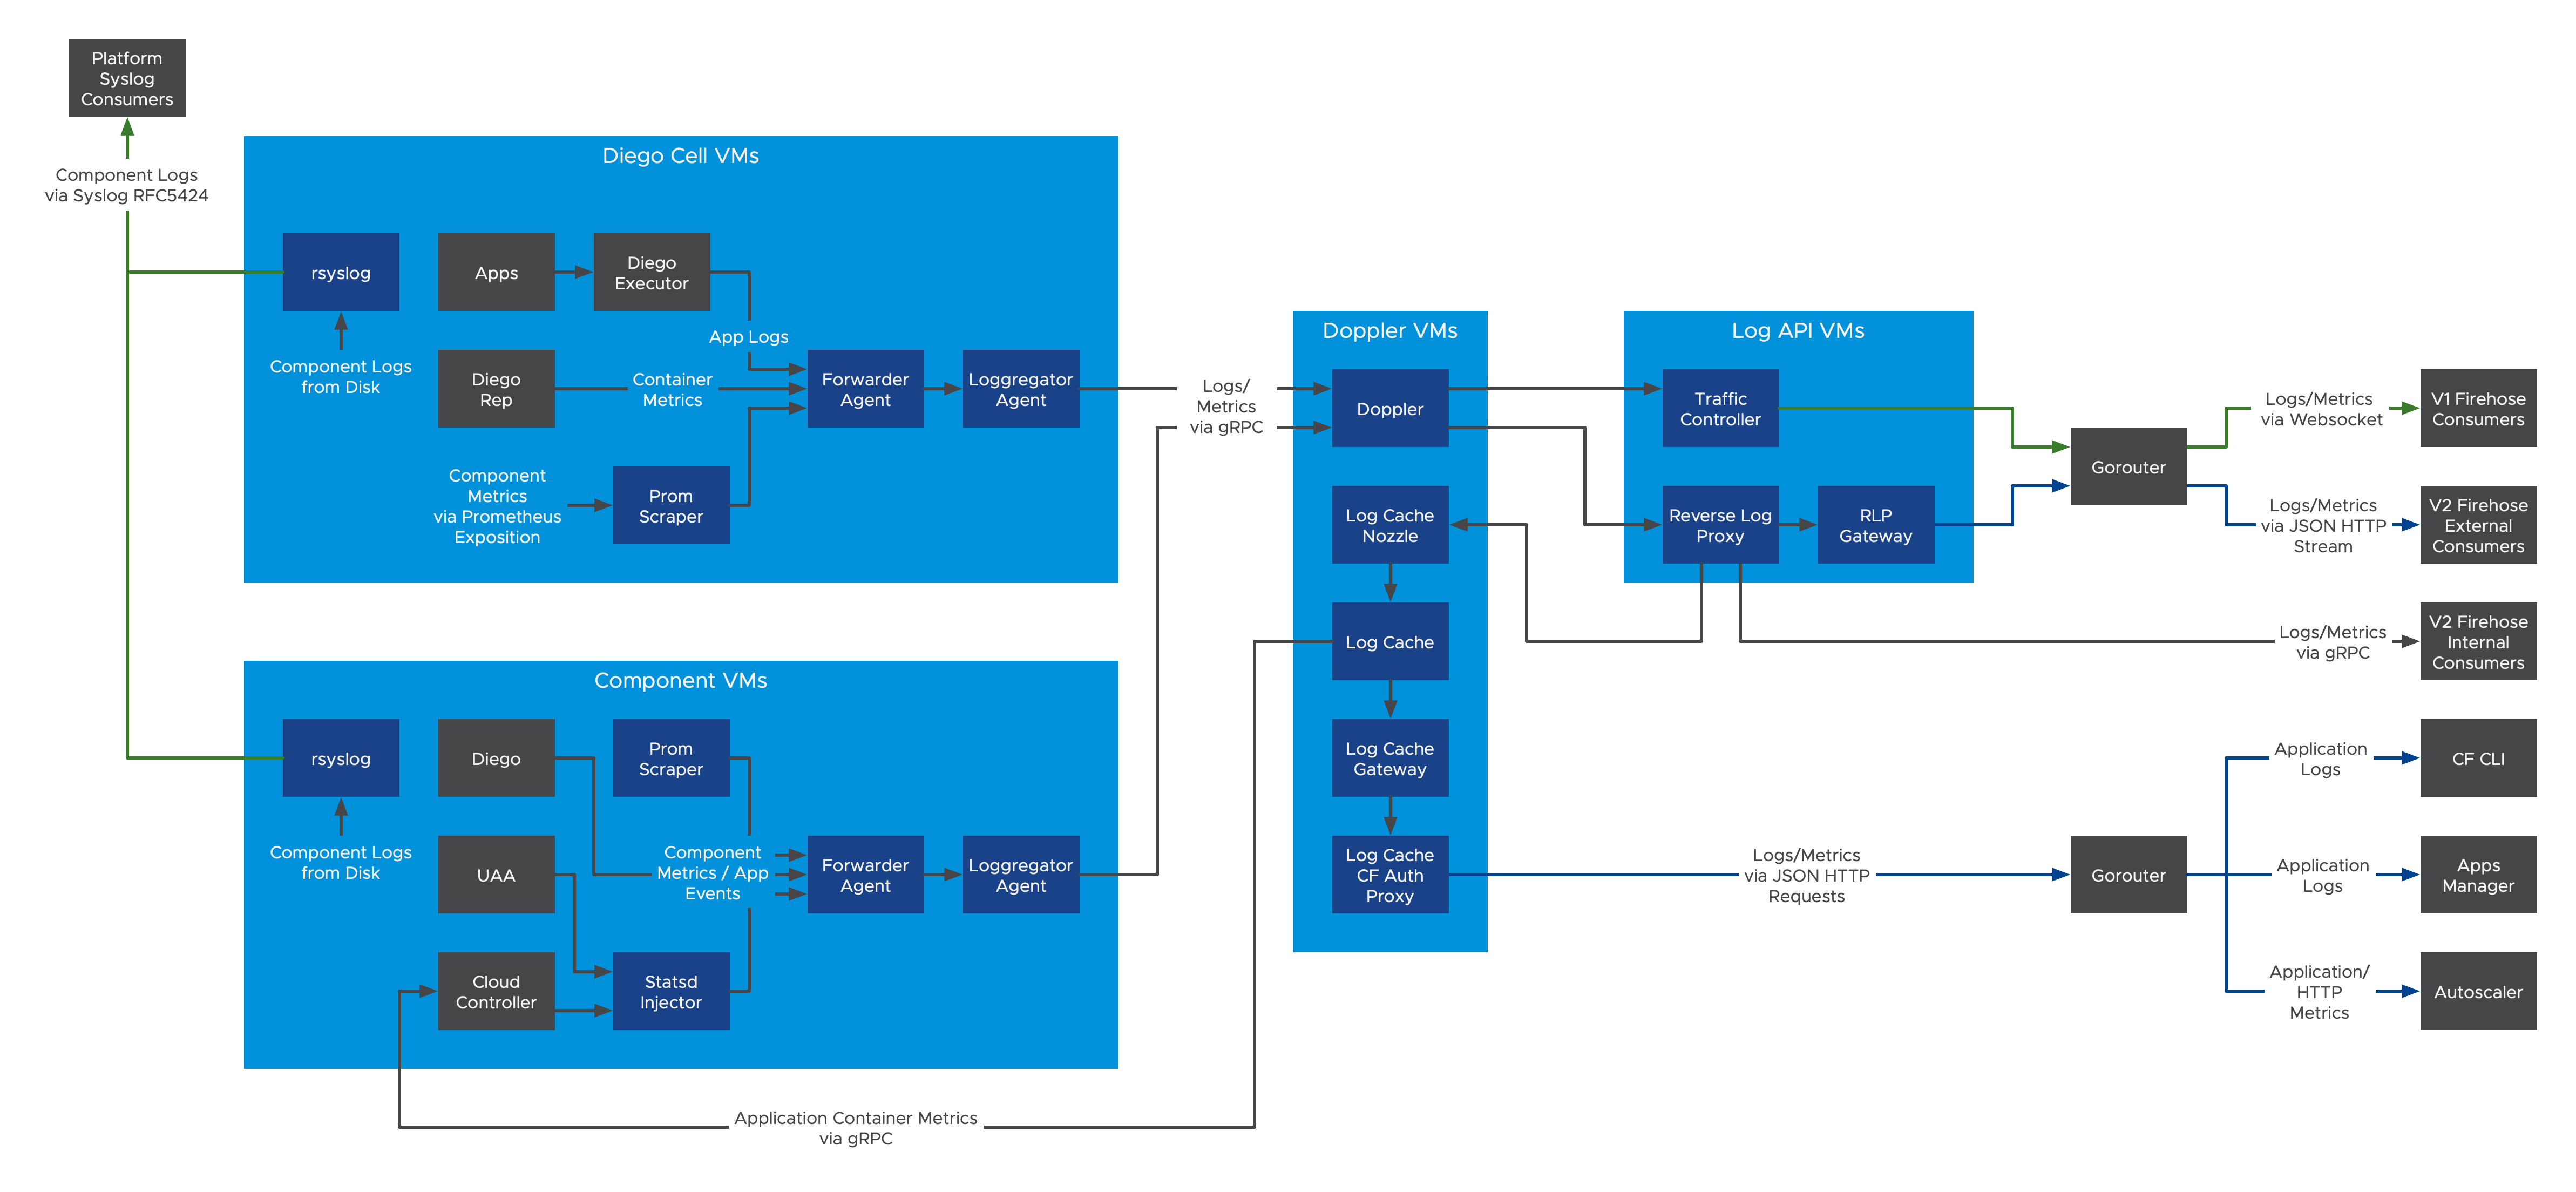
View a larger version of this image.
The following components are included in the Loggregator Firehose, as shown in the diagram above:
-
Prom Scraper: Prom Scrapers run on both Ops Manager component VMs and Diego Cell VMs. They aggregate metrics from Ops Manager components located on those VMs via Prometheus exposition. Prom Scrapers then forward those metrics to Forwarder Agents.
-
Statsd Injector: Statsd Injectors run on Ops Manager component VMs. They receive metrics from Ops Manager components over the Statsd protocol. Statsd Injectors then forward those metrics to Forwarder Agents.
-
Forwarder Agent: Forwarder Agents run on both Ops Manager component VMs and Diego Cell VMs. They receive logs and metrics from the apps and Ops Manager components located on those VMs. Forwarder Agents then forward the logs and metrics to Loggregator Agents and other agents.
-
Loggregator Agent: Loggregator Agents run on both Ops Manager component VMs and Diego Cell VMs. They receive logs and metrics from the Forwarder Agents, then forward the logs and metrics via multiple downstream Dopplers.
-
Doppler: Dopplers receive logs and metrics from Loggregator Agents, store them in temporary buffers, and forward them to Traffic Controllers and Reverse Log Proxies.
-
Traffic Controller: Traffic Controllers poll Doppler servers for logs and metrics, then translate these messages from the Doppler servers as necessary for external and legacy APIs. It services the Firehose Endpoint (also known as the V1 Firehose). The Firehose cf CLI plugin allows you to view the output of the Firehose. For more information about the Firehose plugin, see Installing the Loggregator Firehose Plugin for cf CLI.
-
Reverse Log Proxy (V2 Firehose): Reverse Log Proxies (RLPs) collect logs and metrics from Dopplers and forward them to Log Cache and other consumers via gRPC. Operators can scale up the number of RLPs based on overall log volume.
-
Reverse Log Proxy Gateway (V2 Firehose): Reverse Log Proxies Gateways (RLP Gateways) collect logs and metrics from Reverse Log Proxies and forward them to consumers via HTTP. Collecting logs and metrics via the RLP Gateway will have lower throughput compared to consuming from the Traffic Controller or Reverse Log Proxy.
-
Log Cache: Log Cache allows you to view logs and metrics over a specified period of time. The Log Cache includes API endpoints and a CLI plug-in to query and filter logs and metrics. To download the Log Cache CLI plugin, see Cloud Foundry Plugins. The Log Cache API endpoints are available by default. For more information about using the Log Cache API, see Log Cache on GitHub.
-
rsyslog: While not part of the firehose itself, rsyslog is responsible for delivering logs from platform components to outside consumers.
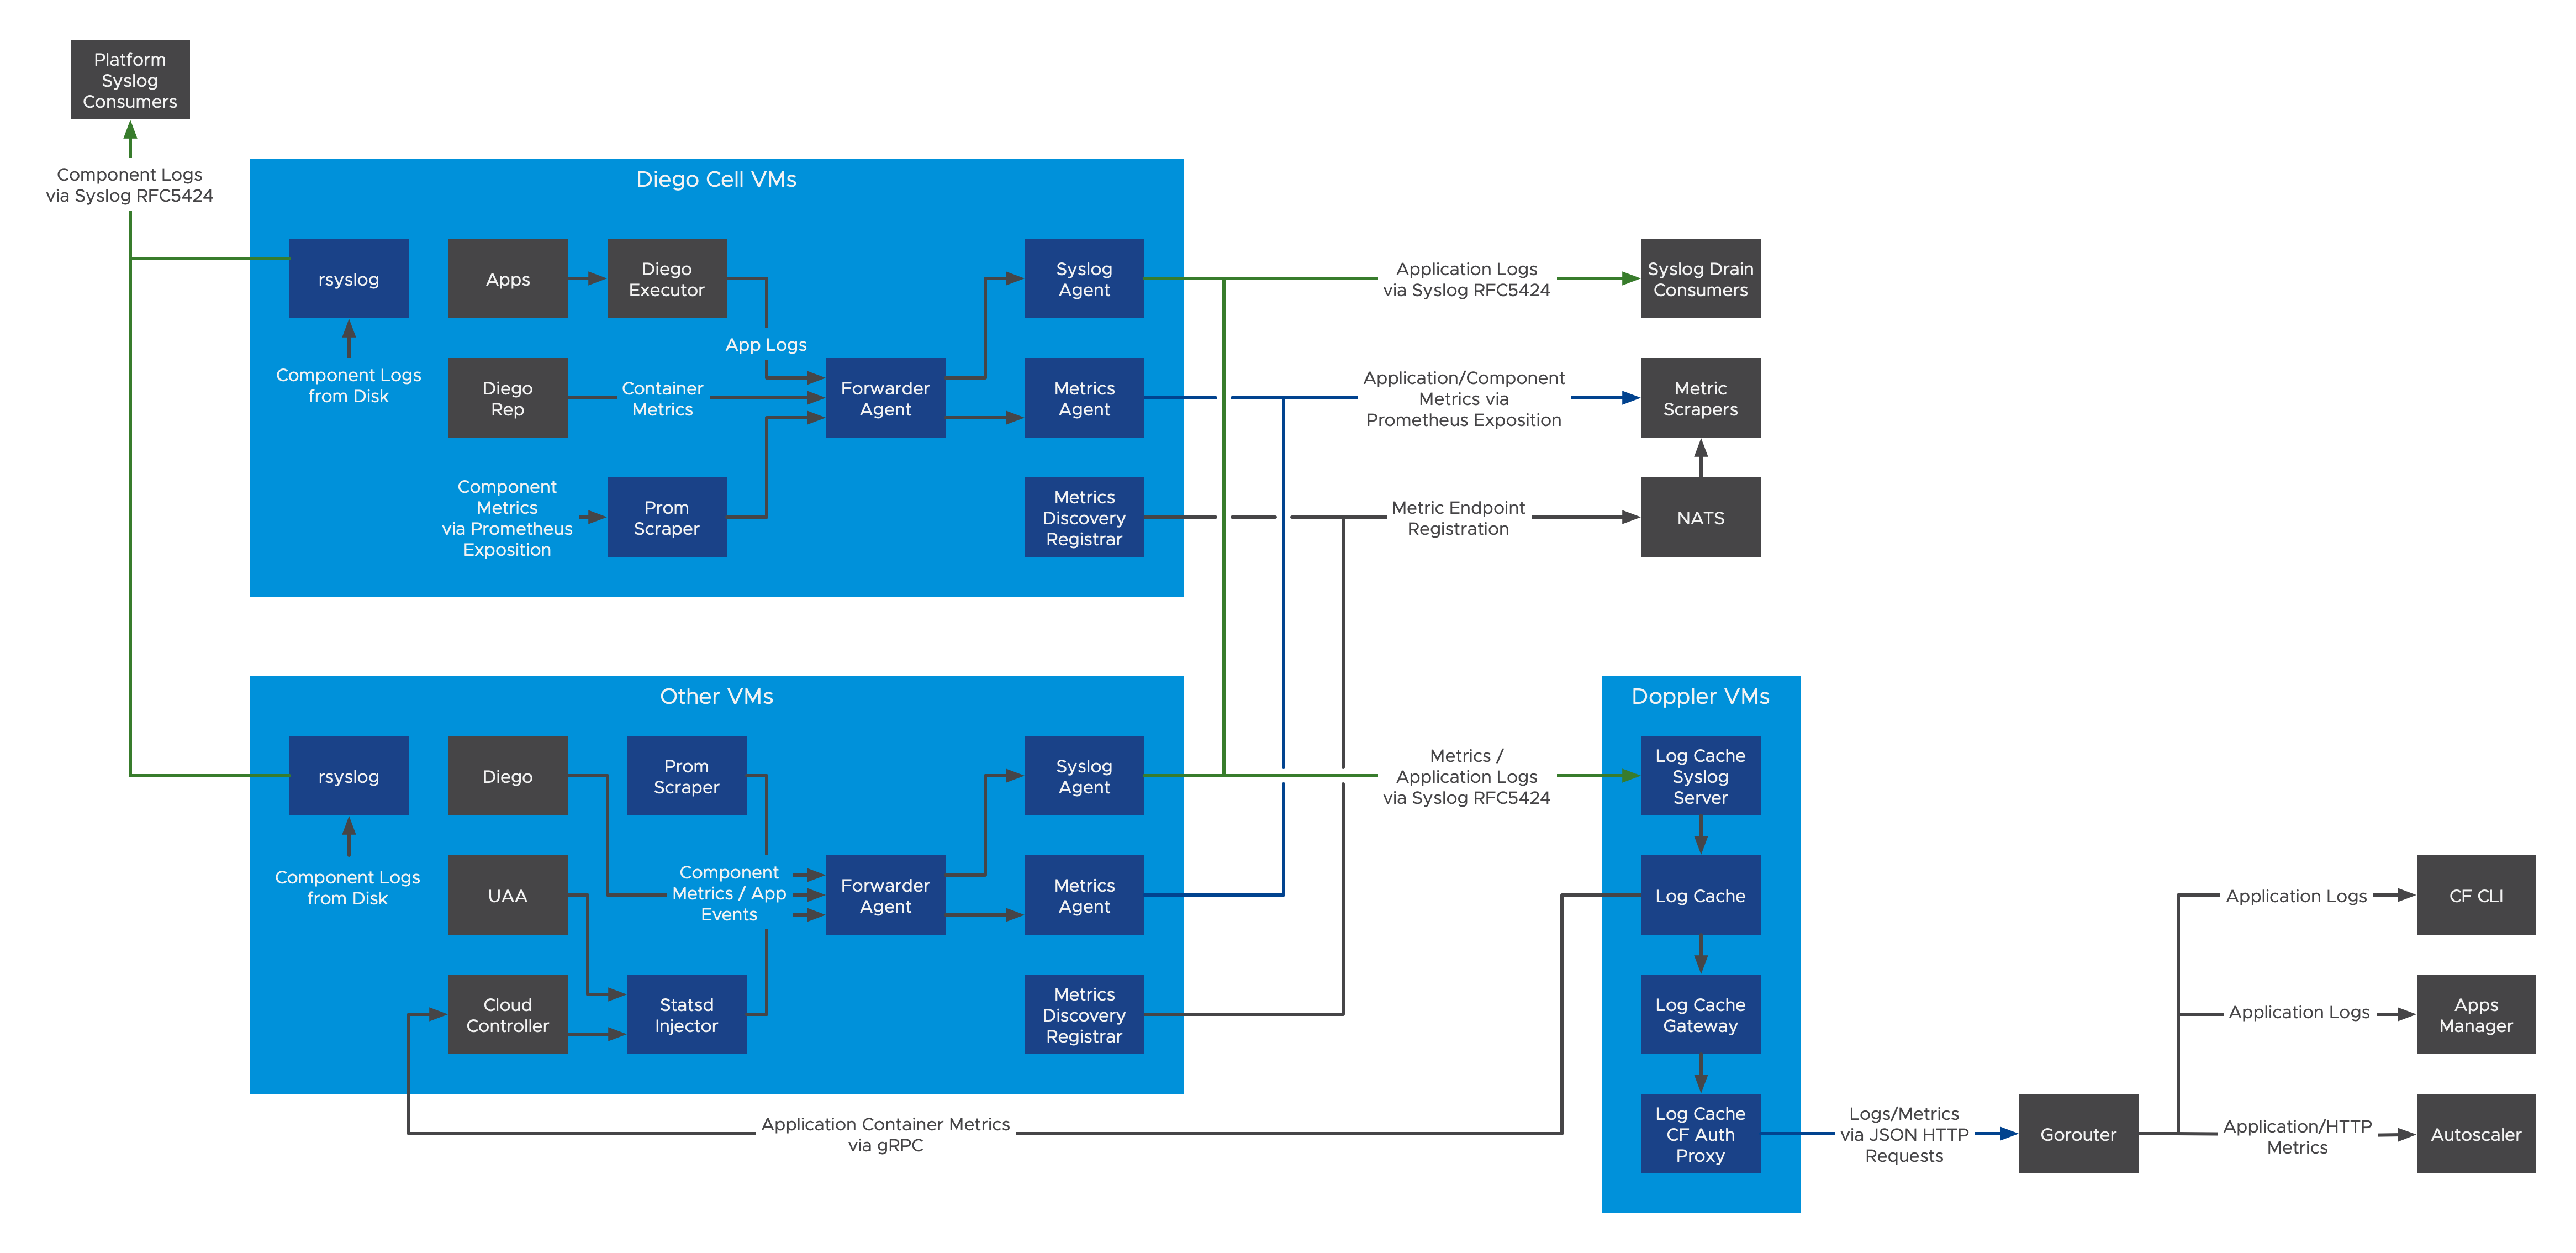
Shared Nothing architecture
In contrast to the Loggregator Firehose architecture, the shared-nothing architecture allows logs and metrics to pass through fewer components during egress. For example, the shared-nothing architecture does not require the Forwarder Agent, Syslog Agent, or Metrics Agent.
You can use this diagram to:
- Understand the components that transport logs and metrics to the Firehose.
- Diagnose performance issues related to logging and metrics.
- Make decisions about how to best scale the Loggregator components or Firehose consumers described in this architecture.
View a larger version of this image.
The following components are included in the Shared-Nothing Architecture, as shown in the diagram above:
-
Prom Scraper: Prom Scrapers run on both Ops Manager component VMs and Diego Cell VMs. They aggregate metrics from Ops Manager components located on those VMs via Prometheus exposition. Prom Scrapers then forward those metrics to Forwarder Agents.
-
Statsd Injector: Statsd Injectors run on Ops Manager component VMs. They receive metrics from Ops Manager components over the Statsd protocol. Statsd Injectors then forward those metrics to Forwarder Agents.
-
Forwarder Agent: Forwarder Agents run on both Ops Manager component VMs and Diego Cell VMs. They receive logs and metrics from the applications and Ops Manager components located on those VMs. Forwarder Agents then forward the logs and metrics to Loggregator Agents and other agents.
-
Syslog Agent: Syslog Agents run on Ops Manager component VMs and host VMs to collect and forward logs to configured syslog drains. This includes syslog drains for individual apps as well as aggregate drains for all apps in your foundation. You can specify the destination for logs as part of the individual syslog drain or in the TAS for VMs tile.
-
Syslog Binding Cache (not pictured): Syslog Agents can overwhelm CAPI when querying for existing bindings. This component acts as a caching proxy between the Syslog Agents and CAPI.
-
Metrics Agents: Metrics Agents receive metrics from Forwarder Agents, and make them available to Metric Scrapers via Prometheus Exposition.
-
Metrics Discovery Registrars: Metrics Discovery Registrars register each scrapeable endpoint with NATS, for discovery by Metrics Scrapers.
-
Log Cache: Log Cache allows you to view logs and metrics over a specified period of time. The Log Cache includes API endpoints and a CLI plug-in to query and filter logs and metrics. To download the Log Cache CLI plugin, see Cloud Foundry Plugins. The Log Cache API endpoints are available by default. For more information about using the Log Cache API, see Log Cache on GitHub.
-
Log Cache Syslog Server: The Log Cache Syslog Server takes the place of the Log Cache Nozzle (only one will be active at a time). It receives logs and metrics from Syslog Agents and sends them to Log Cache.
System Metrics Agents architecture
The following diagram shows the architecture of a Loggregator deployment that uses System Metrics Agents to collect VM and system-level metrics.

View a larger version of this image.
The following describes the components of a Loggregator deployment that uses System Metrics Agents, as shown in the diagram above:
-
System Metrics Agent: A standalone agent to provide VM system metrics using a Prometheus-scrapeable endpoint.
-
System Metrics Scraper: The System Metrics Scraper forwards metrics from System Metrics Agents to Loggregator Agents over mTLS.
How components transport logs and metrics
This section provides detailed descriptions of how the components in the Loggregator Firehose architecture and in the shared-nothing architecture transport logs and metrics on your deployment.
It describes the transport of logs and metrics during the following phases:
-
How components in the logging and metrics architectures collect and forward metrics from VMs on your deployment. For more information, see How logs and metrics egress from VMs.
-
How components in a Loggregator Firehose architecture collect and forward logs and metrics. For more information, see How Loggregator Firehose forwards logs and Mmtrics.
-
How the logging and metrics architectures expose logs and metrics to consumers. For more information, see How consumers receive logs and metrics.
How logs and metrics egress from VMs
The following describes the transport of logs and metrics from VMs through system components and to a destination:
- Apps and component VMs on your deployment emit logs and metrics.
- Logs and metrics pass through two forwarders:
- rsyslog: This sends logs from the component VMs in Syslog RFC 5424 format.
- Forwarder Agent: This sends metrics and app logs to the Syslog Agent, the Metrics Agent, and the Loggregator Agent.
-
From the Forwarder Agent, logs and metrics then pass through each of the following agents:
- Syslog Agent: This sends app logs in Syslog RFC 5424 format to aggregate and app log destinations.
- Metrics Agent: This exposes metrics for Prometheus-style scraping.
- Loggregator Agent: This sends metrics and app logs to the Loggregator Firehose.
- OTel Collector (experimental): This sends app and component metrics in a variety of formats to aggregate metric destinations.
For more information about how logs and metrics flow through the Loggregator Firehose, see How Loggregator Firehose forwards logs and metrics.
How Loggregator Firehose forwards logs and metrics
For deployments that use a Loggregator Firehose architecture, the Loggregator Agent forwards logs and metrics emitted by apps and component VMs on your deployment to the Loggregator Firehose.
The following describes how the Loggregator Firehose sends logs and metrics through the V1 and V2 Firehose APIs:
- The Loggregator Agent sends each log and metric to one Doppler. It distributes the logs and metrics among a random group of five Dopplers.
- Dopplers make a copy of each log and metric for each consumer. The Dopplers then send the logs and metrics to Traffic Controllers and Reverse Log Proxies for distribution.
- Traffic Controllers and Reverse Log Proxies distribute logs and metrics in the following ways:
- Traffic Controllers receive WebSocket connections from V1 Firehose Consumers, and send logs and metrics as V1 Envelopes.
If any of these consumers start to fall behind, Traffic Controllers log a slow consumer alert and disconnect that particular consumer. - Reverse Log Proxies receive gRPC connections from V2 Firehose Consumers and send logs and metrics as V2 Envelopes.
If a consumer falls behind, the envelopes are dropped. - Reverse Log Proxy Gateways (RLP Gateways) receive HTTP connections from V2 Firehose consumers, and send logs and metrics as JSON-encoded V2 Envelopes.
Reverse Log Proxy Gateways connect to Reverse Log Proxies, rather than directly to Dopplers.
- Traffic Controllers receive WebSocket connections from V1 Firehose Consumers, and send logs and metrics as V1 Envelopes.
How consumers receive logs and metrics
Consumers of logs and metrics include the Cloud Foundry Command Line Interface (cf CLI), Cloud Foundry web UIs such as Stratos, and any observability or monitoring product integrations.
The cf CLI and any Cloud Foundry web UIs can access logs and metrics through Log Cache. Log Cache receives logs and metrics from either the Firehose or directly from VMs through syslog. Log Cache provides short-term storage for logs and metrics where the cf CLI and web UIs can access them.
Integrations with observability or monitoring products receive logs and metrics through one of the following methods, depending on the logging and metrics architecture that your deployment uses:
- Connect to the Loggregator Firehose for access to both logs and metrics.
- Receive logs in syslog RFC 5424 format and scrape metrics from Prometheus endpoints.
The following diagram shows how consumers of logs and metrics receive logs and metrics from your deployment:
Related BOSH components
This section describes the Ops Manager components that forward BOSH-reported VM metrics to Loggregator. BOSH-reported VM metrics measure the health of BOSH-deployed VMs on which apps and Ops Manager components are deployed. Loggregator streams BOSH-reported VM metrics through the Firehose.
The following are the Ops Manager components that send BOSH-reported VM metrics to Loggregator:
-
BOSH Agent: BOSH Agents are located on component VMs and Diego Cell VMs. They collect metrics, such as Diego Cell capacity remaining, from the VM and forward them to the BOSH Health Monitor.
-
BOSH Health Monitor: The BOSH Health Monitor receives metrics from the BOSH Agents. It then forwards the metrics to a third-party service or to the BOSH System Metrics Forwarder.
-
BOSH System Metrics Plugin: This plugin reads health events, such as VM heartbeats and alerts from the BOSH Health Monitor, and streams them to the BOSH System Metrics Server.
-
BOSH System Metrics Server: The BOSH System Metrics Server streams metrics and heartbeat events to the BOSH System Metrics Forwarder over gRPC.
-
BOSH System Metrics Forwarder: The BOSH System Metrics Forwarder is located on the Loggregator Traffic Controller. It forwards heartbeat events from the BOSH System Metrics Server as envelopes to Loggregator through a Loggregator Agent.
