You can diagnose issues that you encounter when installing products such as VMware Tanzu Application Service for VMs (TAS for VMs) with VMware Tanzu Operations Manager.
An important consideration when you are diagnosing issues is communication between VMs deployed by Operations Manager. Communication takes the form of messaging, routing, or both. If either of these go wrong, an installation can fail. For example, after installing TAS for VMs, one of the VMs must deploy a test app to the cloud during post installation testing. The installation fails if the resulting traffic cannot be routed to the HA Proxy load balancer.
Viewing the debug endpoint
The debug endpoint is a web page that provides diagnostics information. If you have superuser privileges and can view the Tanzu Operations Manager Installation Dashboard, you can access the debug endpoint.
To access the debug endpoint, open the following URL in a web browser:
https://OPS-MANAGER-FQDN/debug
Where OPS-MANAGER-FQDN is the fully-qualified domain name (FQDN) of your Operations Manager installation.
The debug endpoint offers the following links:
-
Files allows you to view the YAML files that Operations Manager uses to configure products that you install. The most important YAML file,
installation.yml, provides networking settings and describesmicrobosh. In this case,microboshis the VM whose BOSH Director component is used by Operations Manager to perform installations and updates of TAS for VMs and other products. -
Components describes the components in detail.
-
Rails log shows errors thrown by the VM where the web app, such as a Rails app, is running, as recorded in the
production.logfile.
Logging tips
Identifying where to start
This section contains general tips for locating where a particular problem is called out in the log files. For guidance regarding specific logs, such as those for TAS for VMs components, see the following sections.
- Start with the largest and most recently updated files in the job log.
- Identify logs that contain
errin the name. - Scan the file contents for a “failed” or “error” string.
Viewing logs for TAS for VMs components
To troubleshoot specific TAS for VMs components by viewing their log files:
-
Go to your Operations Manager Installation Dashboard and click the TAS for VMs tile.
-
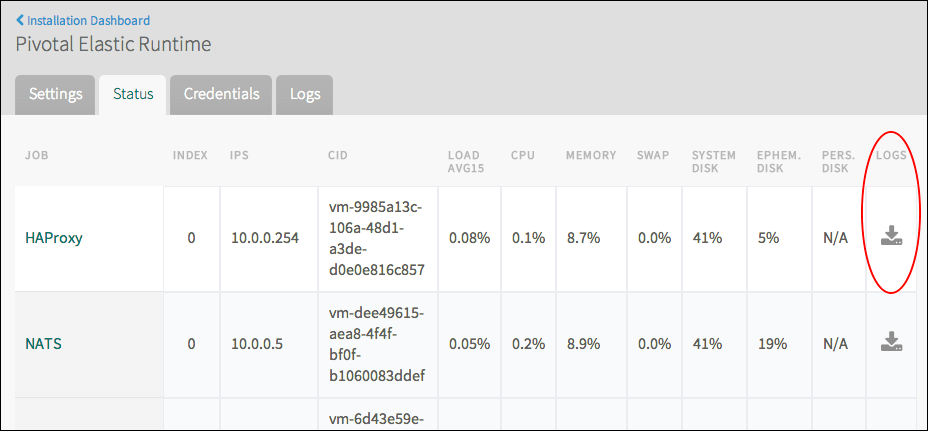
Select the Status tab.
-
In the Job column, locate the component that you want to troubleshoot.
-
In the Logs column for the component, click the download icon.

-
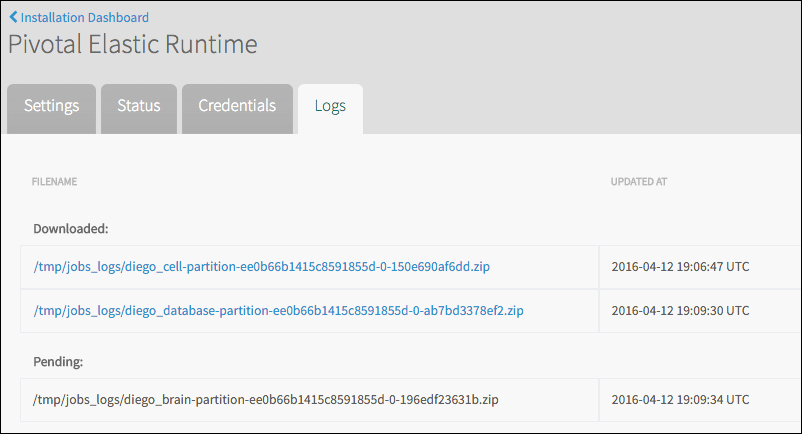
Select the Logs tab.

-
Once the ZIP file corresponding to the component moves to the Downloaded list, click the linked file path to download the ZIP file.
-
Once the download completes, unzip the file.
The contents of the log directory vary depending on which component you view. For example, the Diego Cell log directory contains subdirectories for the metron_agent rep, monit, and garden processes. To view the standard error stream for garden, download the Diego Cell logs and open diego.0.job > garden > garden.stderr.log.
Viewing web app and BOSH failure logs in a terminal window
You can obtain diagnostic information by logging in to the VM where the BOSH Director job is running. To log in to the BOSH Director VM, you need the following:
-
The IP address of the VM shown in the Settings tab of the BOSH Director tile.
-
Your import credentials. Import credentials are the username and password used to import the
.ovaor.ovffile into your virtualization system.
To log in to the VM:
-
Open a terminal window.
-
To connect to the BOSH Director VM, run:
ssh IMPORT-USERNAME@PCF-VM-IP-ADDRESSWhere:
IMPORT-USERNAMEis the username you used to import the.ovaor.ovffile into your virtualization system.VM-IP-ADDRESSis the IP address of the BOSH Director installation VM.
-
Enter your import password when prompted.
-
Go to the home directory of the web app by running:
cd /home/tempest-web/tempest/web/ -
You are now in a position to explore whether things are as they can be within the web app. You can also verify that the
microboshcomponent is successfully installed. A successful MicroBOSH installation is required to install TAS for VMs and any products like databases and messaging services. -
Go to the BOSH installation log home directory by running:
cd /var/tempest/workspaces/default/deployments/micro -
You can begin by running a tail command on the
currentlog. Run:cd /var/tempest/workspaces/default/deployments/microIf you cannot resolve an issue by viewing configurations, exploring logs, or reviewing common problems, you can troubleshoot further by running BOSH diagnostic commands with the BOSH Command Line Interface (CLI).
Important Do not manually edit the deployment manifest. Operations Manager overwrites manual changes to this manifest. In addition, manually changing the manifest might cause future deployments to fail.
Viewing the VMs in your deployment
To view the VMs in your deployment, follow the procedure specific to your IaaS.
Amazon Web Services (AWS)
To view the VMs in your AWS deployment:
-
Log in to the AWS Console.
-
Go to the EC2 Dashboard.
-
Click Running Instances.
-
Click the gear icon in the upper-right corner.
-
Select job, deployment, director, and index.
-
Click Close.
OpenStack
To view the VMs in your OpenStack deployment:
-
Install the novaclient from the python-novaclient repository on GitHub.
-
Point novaclient to your OpenStack installation and tenant by exporting the following environment variables:
export OS_AUTH_URL=YOUR_KEYSTONE_AUTH_ENDPOINT export OS_TENANT_NAME=TENANT_NAME export OS_USERNAME=USERNAME export OS_PASSWORD=PASSWORD -
List your VMs by running:
nova list --fields metadata
vSphere
To view the VMs in your vSphere deployment:
-
Log in to vCenter.
-
Select Hosts and Clusters.
-
Select the top level object that contains your deployment. For example, select Cluster, Datastore, or Resource Pool.
-
In the top tab, click Related Objects.
-
Select Virtual Machines.
-
Right-click the Table heading and select Show/Hide Columns.
-
Select the job, deployment, director, and index boxes.
Viewing Apps Manager logs in a terminal window
Apps Manager provides a graphical user interface to help manage organizations, users, apps, and spaces. For more information about Apps Manager, see Getting Started with Apps Manager
When troubleshooting Apps Manager performance, you can view the Apps Manager app logs.
To view the Apps Manager app logs:
-
From a command line, log in to Operations Manager by running:
cf login -a api.YOUR-SYSTEM-DOMAIN -u adminWhere
YOUR-SYSTEM-DOMAINis your system domain.When prompted, enter your UAA Administrator credentials. To obtain these credentials, see Credentials tab in the TAS for VMs tile.
-
Target the
systemorg and theapps-managerspace by running:cf target -o system -s apps-manager -
Tail the Apps Manager logs by running:
cf logs apps-manager
Changing logging levels for Apps Manager
Apps Manager detects the LOG_LEVEL environment variable. The LOG_LEVEL environment variable allows you to filter the messages reported in Apps Manager log files by severity level. Apps Manager defines severity levels using the Ruby standard library Logger class.
By default, the Apps Manager LOG_LEVEL environment variable is set to info. The logs show more verbose messaging when you set the LOG_LEVEL to debug.
To change the Apps Manager LOG_LEVEL environment variable, run:
cf set-env apps-manager LOG_LEVEL LEVEL
Where LEVEL is the desired severity level.
You can set LOG_LEVEL to one of the six severity levels defined by the Ruby Logger class:
- Level 5
unknown: An unknown message that should always be logged. - Level 4
fatal: An unhandleable error that results in a program failure. - Level 3
error: A handleable error condition. - Level 2
warn: A warning. - Level 1
info: General information about system operation. - Level 0
debug: Low-level information for developers.
Once set, Apps Manager log files only include messages at the set severity level and higher. For example, if you set LOG_LEVEL to fatal, the log only includes fatal and unknown level messages.
Analyzing disk usage on containers and Diego Cell VMs
To obtain disk usage statistics by Diego Cell VMs and containers, see Examining GrootFS Disk Usage.