


Here you will learn how to use the MySQL proxy to monitor the health of your MySQL instance.
If you cannot write or connect to your app, you can verify the health status of your MySQL virtual machines. You can observe the health status of MySQL VMs through a proxy using the Switchboard dashboard or API endpoint. You can also view the number of client connections routed through a proxy to each VM.
VMware Tanzu Operations Manager uses a proxy to send client connections to the healthy MySQL database cluster nodes in a highly available cluster plan. Using a proxy gracefully handles failure of nodes, enabling fast failover to other nodes within the cluster. When a node becomes unhealthy, the proxy closes all connections to the unhealthy node and re-routes all subsequent connections to a healthy node.
The proxy used in TAS for VMs is Switchboard. Switchboard was developed to replace HAProxy as the proxy tier for the HA cluster for MySQL databases in TAS for VMs.
Switchboard offers the following features:
-
MySQL Server Access
MySQL clients communicate with nodes through this network port. These connections are automatically passed through to the nodes.
-
Switchboard and API
Operators can connect to Switchboard to view the state of the nodes.
Node health
Before routing traffic, the proxy queries an HTTP health check process running on the node. This health check can return as either healthy or unhealthy, or the node can be unresponsive.
Healthy nodes
If the health check process returns HTTP status code 200, the proxy includes the node in its pool of healthy nodes.
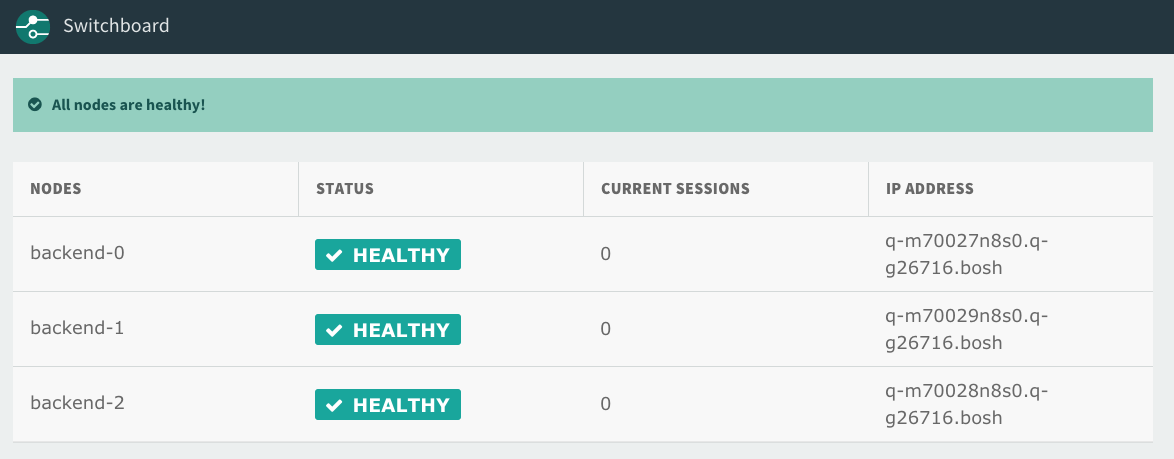
When a new or resurrected nodes rejoin the cluster, the proxy continues to route all connections to the active node. In the case of failover, the proxy considers all healthy nodes as candidates for new connections. The Switchboard shows all nodes with the Healthy status.
Unhealthy nodes
If the health check returns HTTP status code 503, the proxy considers the node unhealthy.
This happens when a node becomes non-primary. For more information, see About Multi-Site replication.
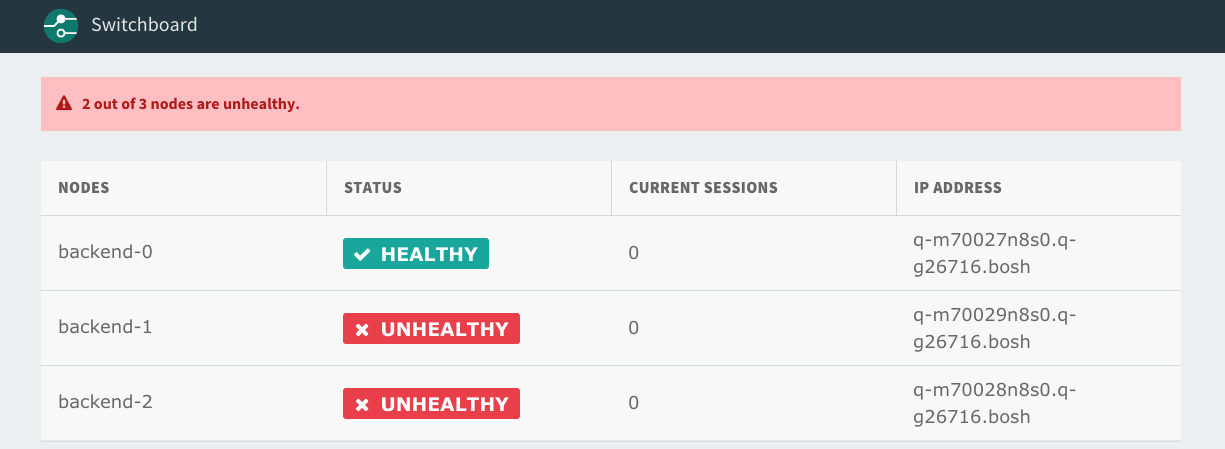
The proxy severs existing connections to newly unhealthy node. The proxy routes new connections to a healthy node, assuming such a node exists. Clients are expected to handle reconnecting on connection failure if the entire cluster become inaccessible. The Switchboard shows two nodes with the Unhealthy status.
Unresponsive nodes
If node health cannot be verified due to an unreachable or unresponsive health check endpoint, the proxy considers the node unhealthy. This might happen if there is a network partition or if the VM running the node and health check failed.
Monitor node health
You can monitor the health status of your nodes by doing one of the following:
Monitor node health using the dashboard
Construct the URL for the dashboard
Each MySQL Proxy instance has its own Switchboard dashboard. To access the dashboard, you must construct the dashboard URL.
To construct the URL for the Switchboard dashboard:
-
Find and record the system domain on the Domains pane in the TAS for VMs tile.
-
Find and record the number of MySQL Proxy VM instances in your deployment in the Resource Config pane.
-
Use the preceding information to build the Switchboard dashboard URL as follows:
https://[PROXY-VM-INDEX]-proxy-p-mysql-ert.[SYSTEM-DOMAIN]
Log in to the dashboard
To log in to the Switchboard dashboard:
-
In the TAS for VMs tile, the URL in your browser contains the Tanzu Operations Manager fully qualified domain name (FQDN) and the TAS for VMs product GUID, as in the following example:
https://OPS-MANAGER-FQDN/products/APPLICTION-SERVICE-PRODUCT-GUID/az_and_network_assignments/edit
To log in to the dashboard, you need the user name and password for the MySQL Proxy VM that are stored in the BOSH Director CredHub.
To obtain them, enterhttps://[OPS-MANAGER-FQDN]/api/v0/deployed/products/[APPLICATION-SERVICE-PRODUCT-GUID]/variables?name=mysql-proxy-dashboard-credentialsin to your browser and record the user name and password. -
Enter the dashboard URL you constructed in to your browser and log in using the credentials you obtained in Construct the URL for the Dashboard.
Use the dashboard
To monitor node health using the Switchboard dashboard:
-
To view a list of proxies in your browser, navigate to the URL that you created in Construct the URL for the Dashboard.
-
When you are prompted, enter the user name and password that you recorded in Log in to the Dashboard.
-
Click the link for the proxy that you want to use to monitor node health.
-
If you are prompted, enter the user name and password that you recorded in Log in to the Dashboard.
Monitor node health using the API
You can also use the Switchboard API to obtain the information that appears on the Switchboard dashboard. For example, you might want to use the API to write your own app to monitor the cluster.
To monitor node health using the Switchboard API:
-
To monitor node health, run:
curl https://PROXY-API-USERNAME:PROXY-API-PASSWORD@PROXY-VM-INDEX-proxy-p-mysql-ert.SYSTEM-DOMAIN/v0/backendsWhere:
PROXY-API-USERNAMEis theusernameyou recorded in Log In to the Dashboard.PROXY-API-PASSWORDis thepasswordyou recorded in Log In to the Dashboard.PROXY-VM-INDEXis either 0, 1, or 2 depending on the proxy you want to connect to.SYSTEM-DOMAINis the system domain found on the Domains pane in the TAS for VMs tile.
The preceding command outputs a JSON object similar to:
$ curl https://PROXY-API-USERNAME:[email protected]/v0/backends
[
  {
    "host": "30a13eb4-b3e0-45f8-8449-8dfada826db2.mysql.tas-subnet.cf-c09d52d0e3f74dab5f81.bosh",
    "port": 3306,
    "healthy": true,
    "name": "mysql/30a13eb4-b3e0-45f8-8449-8dfada826db2",
    "currentSessionCount": 372,
    "active": true,
    "trafficEnabled": true
  },
  {
    "host": "742cb991-b818-4b1f-b1bb-f45d834d8df6.mysql.tas-subnet.cf-c09d52d0e3f74dab5f81.bosh",
    "port": 3306,
    "healthy": true,
    "name": "mysql/742cb991-b818-4b1f-b1bb-f45d834d8df6",
    "currentSessionCount": 0,
    "active": false,
    "trafficEnabled": true
  },
  {
    "host": "fc680458-977e-4d1e-8aa5-5ee62fe3e8cc.mysql.tas-subnet.cf-c09d52d0e3f74dab5f81.bosh",
    "port": 3306,
    "healthy": true,
    "name": "mysql/fc680458-977e-4d1e-8aa5-5ee62fe3e8cc",
    "currentSessionCount": 0,
    "active": false,
    "trafficEnabled": true
  }
]
