Apps Manager for VMware Tanzu Application Service for VMs (TAS for VMs) views and manages app information from Spring Boot Actuator.
Prerequisites
The Apps Manager integration with Spring Boot Actuator requires:
-
A TAS for VMs user with the
SpaceDeveloperrole. For more information, see App Space Roles. -
Spring Boot v1.5 or later.
-
Completing the procedures in Configure Spring Boot Actuator Endpoints for Apps Manager.
After you configure your app, Apps Manager displays the Spring Boot logo next to the name of your app on the app page.

View build and Git information for your app
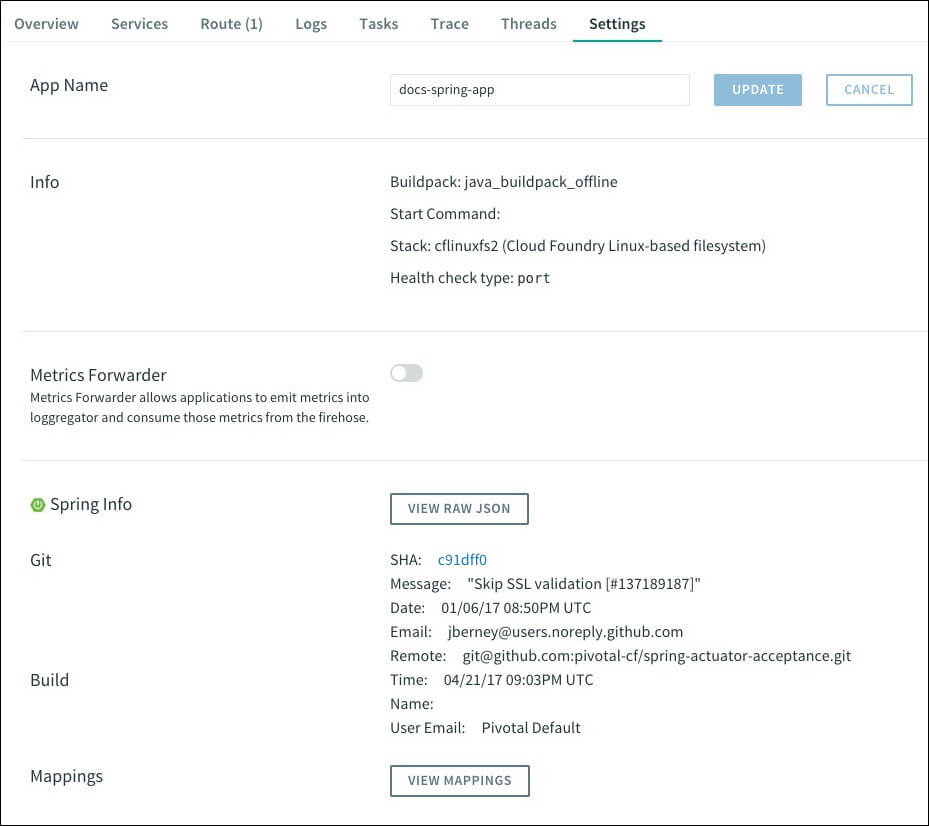
To view the data that your app sends to its /info Actuator endpoint, click the Settings tab.
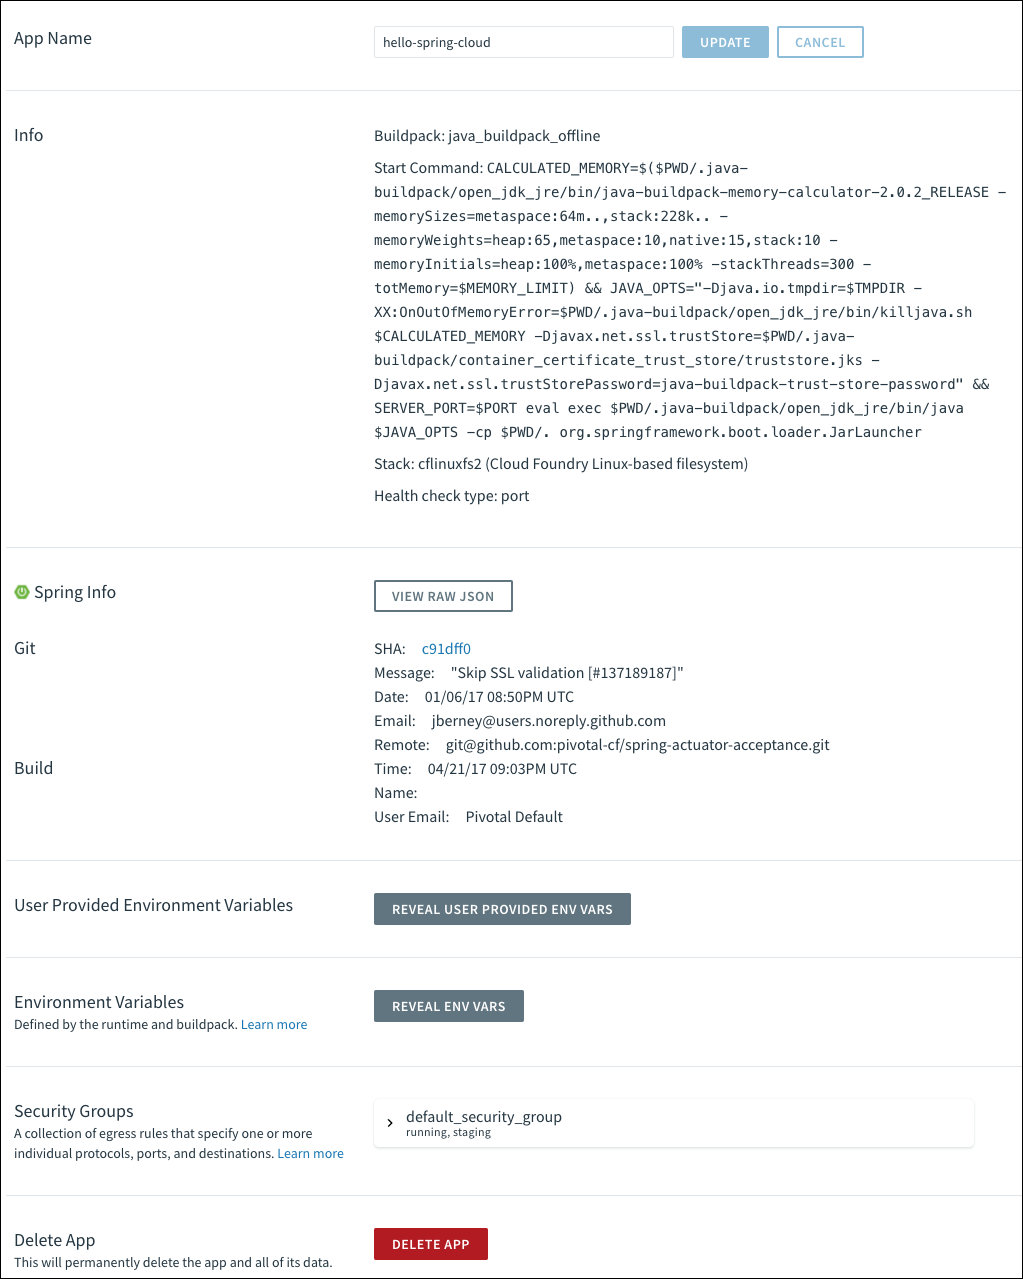
In the upper right of the app page, Apps Manager displays the SHA of your app code repository from the latest build.

View app health
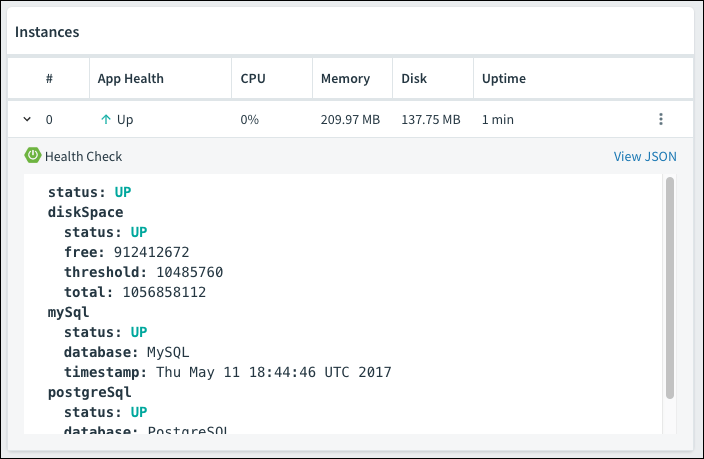
To view the health check data that your app sends to its /health Actuator endpoints:
-
Select the Overview tab.
-
Click an instance under the Instances section. The health check details are displayed.
View thread dump
To trigger and view a thread dump from your app to its /dump Actuator endpoint:
-
Select the Threads tab.
-
Click Refresh.
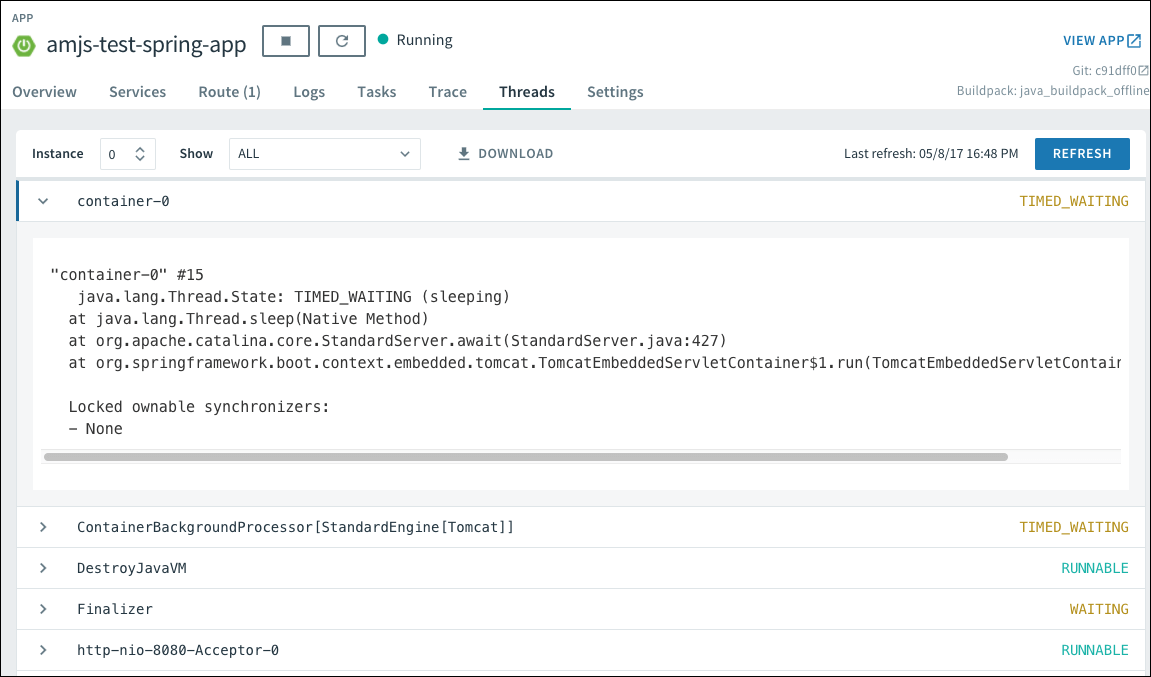
You can click each thread to expand and view its details. You can also change which threads appear on the page using the Instance and Show drop-down menus.
View request traces
To retrieve and view tracing information from the /trace Actuator endpoint of your app:
-
Select the Trace tab.
-
Click Refresh.
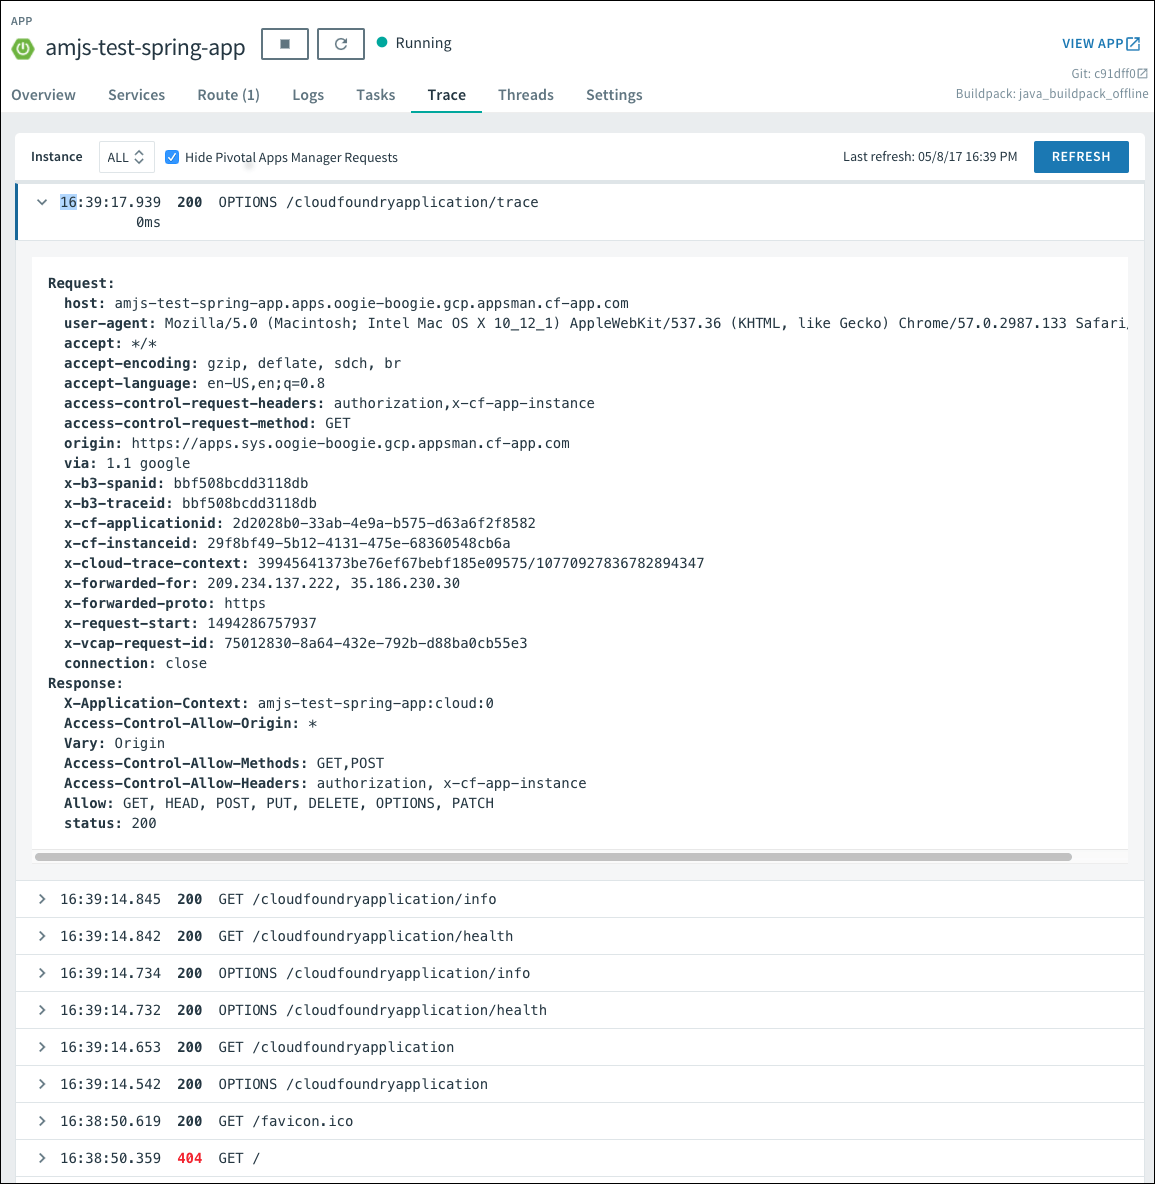
This page displays the last 100 requests from your app. You can click each individual request to expand and view its trace details. You can change which requests appear on the page using the Instance drop-down menu.
By default, the Trace tab does not show requests and responses from Apps Manager polling app instances for data. To include these requests, deselect the Hide Apps Manager Requests check box next to the Instance drop-down menu.
Download heap dump
To trigger and view a heap dump from your app to its /heapdump endpoint.
-
Select the settings drop-down menu for an instance of your app.
-
Click Heap Dump. This downloads a
.zipfile.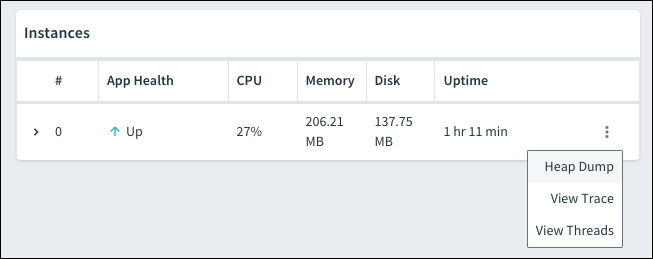
View mappings
To view a collated list of the endpoints an app serves:
-
Select the Settings tab.
-
Click View Mappings.
Manage log levels for apps mapped to external routes
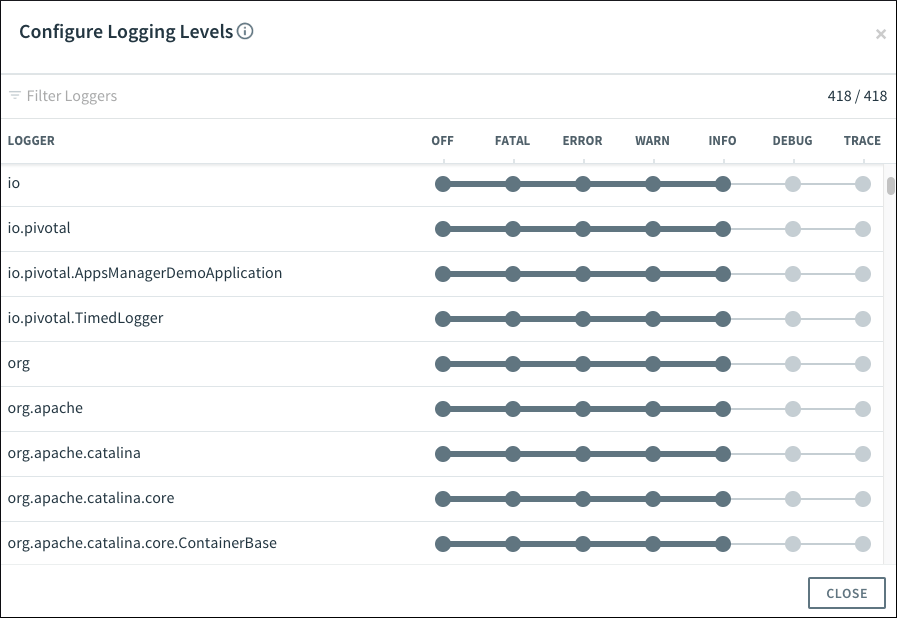
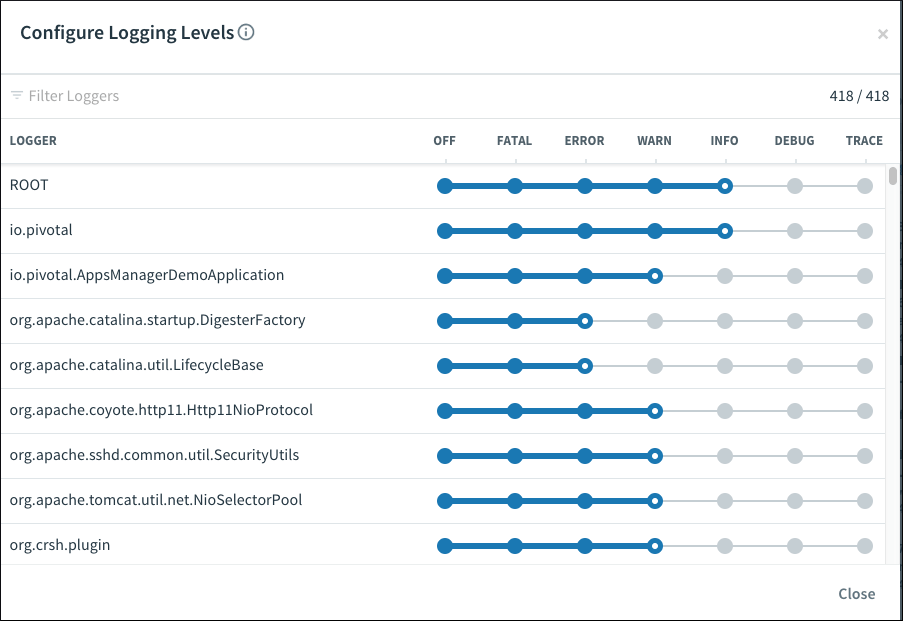
Spring Boot apps include loggers for many provided and user components of the app. You can set the log level for each logger in Apps Manager.
To view the Configure Logging Levels screen:
-
Select the Logs tab.
-
Click Configure Logging Levels.

Apps Manager displays the default log level for each logger in gray.
You can edit the log level for a logger by clicking the level you want in the logger row, as shown in the following image. Whenever you set a log level, the following happens:
- The log level displays in blue to indicate that it is user-configured.
- Each child namespace of the logger inherits the log level.
Note You can manually set any of the child loggers to override this inheritance.
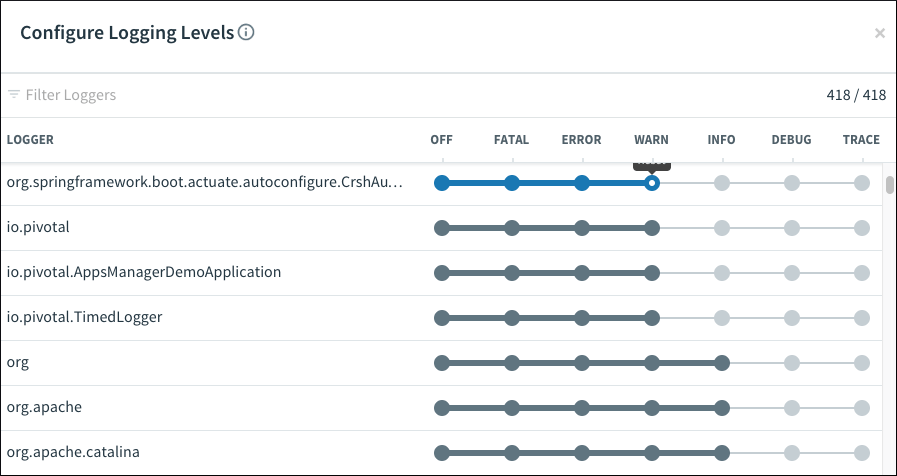
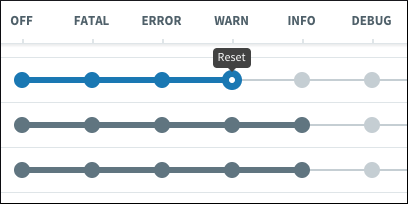
All of the loggers with user-configured logging levels float to the top of the list.
You can reset log levels by clicking the white dot displayed on the current log level.
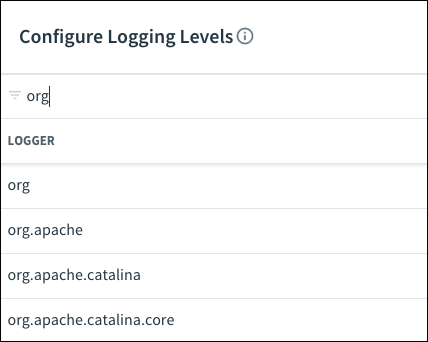
You can also filter which loggers you see using the Filter Loggers text box.
Troubleshoot Spring Boot actuator integration
This section describes how to troubleshoot common issues with the integration of Apps Manager and Spring Boot Actuator.
/cloudfoundryapplication failed request
Symptom
You see the following failed request message in your app logs:
Could not find resource for relative : /cloudfoundryapplication of full path: http://example.com/cloudfoundryapplication
Explanation
Apps Manager uses the /cloudfoundryapplication endpoint as the root for Spring Boot Actuator integrations. It calls this endpoint for an app when you view the app in the Apps Manager UI, regardless of whether you have configured Spring Boot Actuator endpoints for Apps Manager.
Solution
If you are not using the Spring Boot Actuator integrations for Apps Manager, you can ignore this failed request message.