


Getting Started with Multicloud
Multicloud Cost History
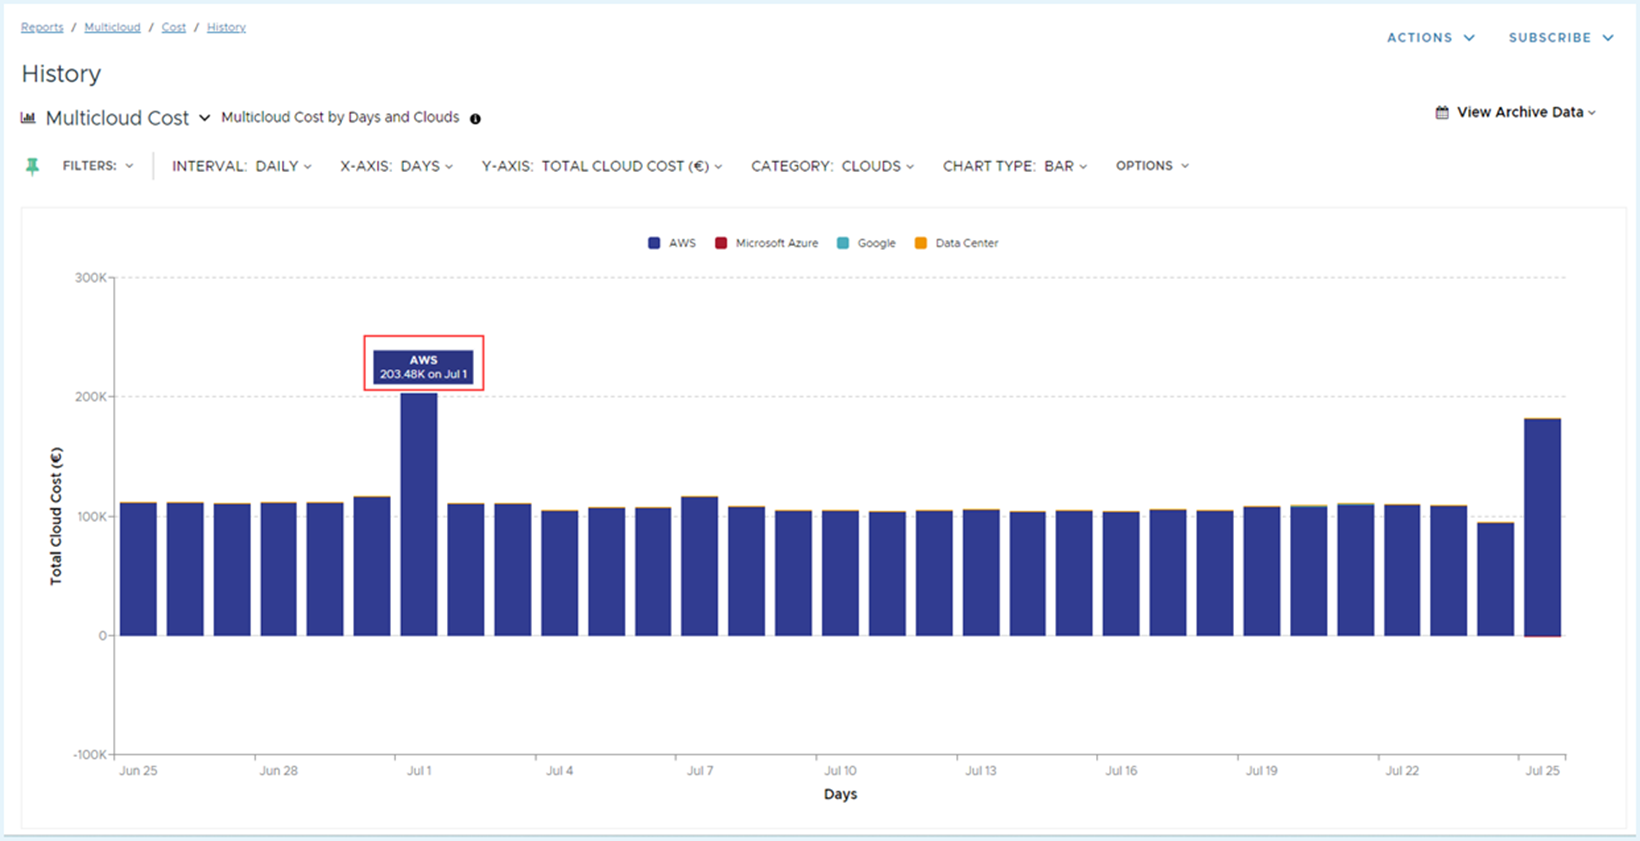
This report displays costs for all clouds in the currency of your choice and allows you to view all cloud costs in a unified currency.
NoteTanzu CloudHealth has mapped all existing GCP product labels with GCP service label names in all OLAP reports. You can see the updated categories for the past 13 months.
Insights This Report Provides
- What is historical trend of spending by cloud provider?
- How are multicloud costs distributed by various business units?
Report Default Settings
- Interval: Daily
- X-Axis: Days
- Y-Axis: Total Cloud Cost ($)
- Category: Clouds
- Chart Type: Bar
Filter Menu
You can use the following standard filter options to view the report as per your business needs.
- Days/Weeks/Months (Based on specified Interval)
- Accounts
- Clouds
- Geographies
- Services
- Organization specific Perspectives
Example - Cost History by Days and Cloud provider (Default View)
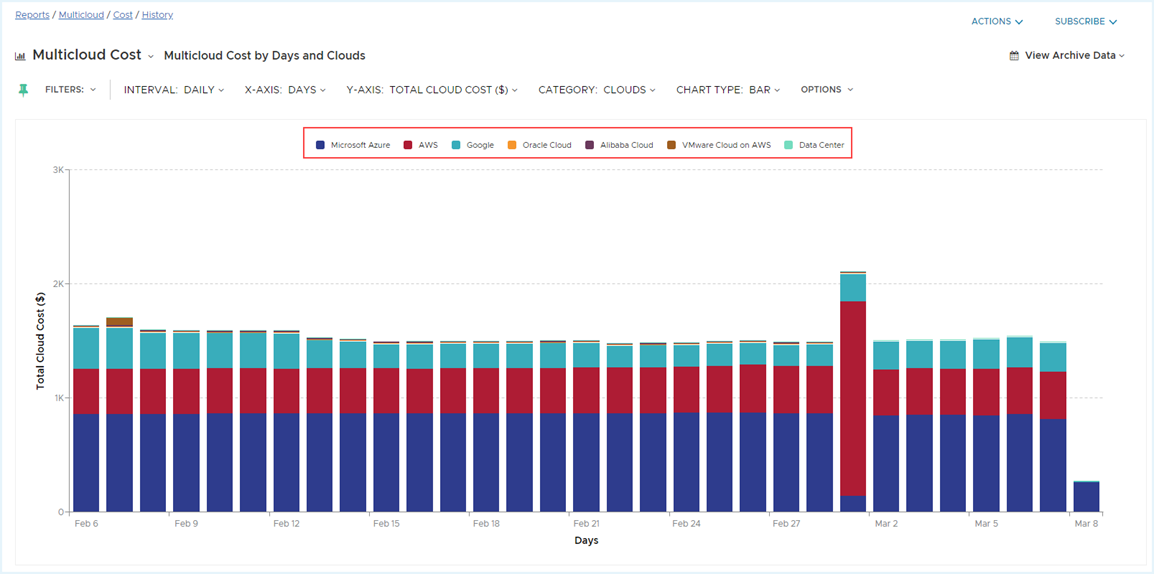
Multicloud Cost History report pulls the data from individual cloud cost history reports. Hover over the chart to view the latest data synch timestamp. The time indicated is the last time the report was refreshed with data for individual clouds.
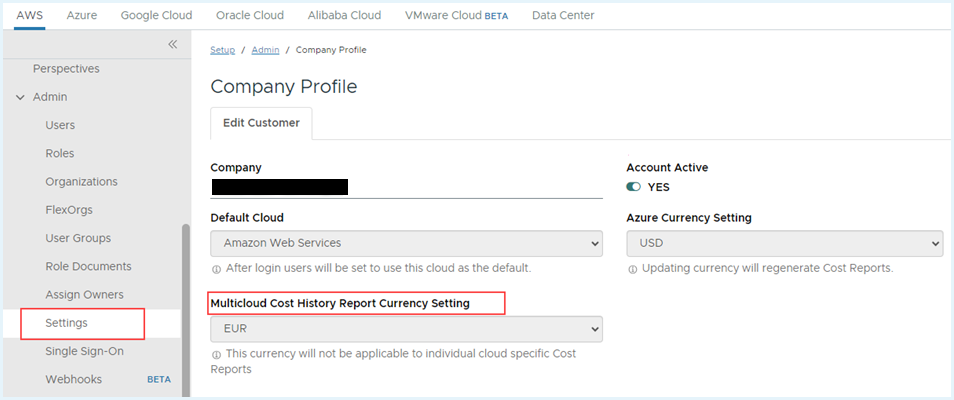
Set the Currency for Multicloud Cost History Report
Tanzu CloudHealth allows you to view Multicloud cost in your choice of currency.
To change the currency setting, go to Admin > Settings. In the Multicloud Cost History Currency Setting dropdown, select from the list of available options.
Note- Beginning of each day, the exchange rate is looked up using OANDA and applied to convert individual cloud cost currencies into the selected currency of choice.
- The currency selection is applicable only to Multicloud Cost History Report and does not convert currency in any other reports on the platform.
- Tanzu CloudHealth keeps a record of the currency conversion rates for the past 13 months.
GreenOps Dashboard
Carbon emissions are the leading source of greenhouse gasses (GHG), the primary contributor to climate change. Currently, the IT sector accounts for approximately 1 in 25 metric tons of emissions, and the public cloud is a significant component of modern IT infrastructure. With the increasing adoption of cloud technology, it has become crucial for large companies to prioritize sustainability and maintain transparency regarding their environmental, social, and governance practices.
VMWare Tanzu CloudHealth’s GreenOps dashboard provides visibility into your multicloud carbon footprint and helps you relate the CO2e metric with visual equivalencies. The carbon emission data in the dashboard is calculated using regional carbon emission data and power usage by an instance. The granular, low-latency Operational Emissions information is also provided as a FlexReports dataset, detailing the carbon footprint of your infrastructure usage.
NoteSustainability data will be available starting from the GreenOps feature onboarding date. The
Multi-Cloud Operational Emissionsdataset in FlexReport will include only forward-looking data.
How to use the GreenOps dashboard?
GreenOps dashboard provides visibility into your organization’s Operational Emissions, specifically the power usage and carbon emissions related to the consumption of virtual machine resources such as AWS EC2 and Azure Virtual machine.
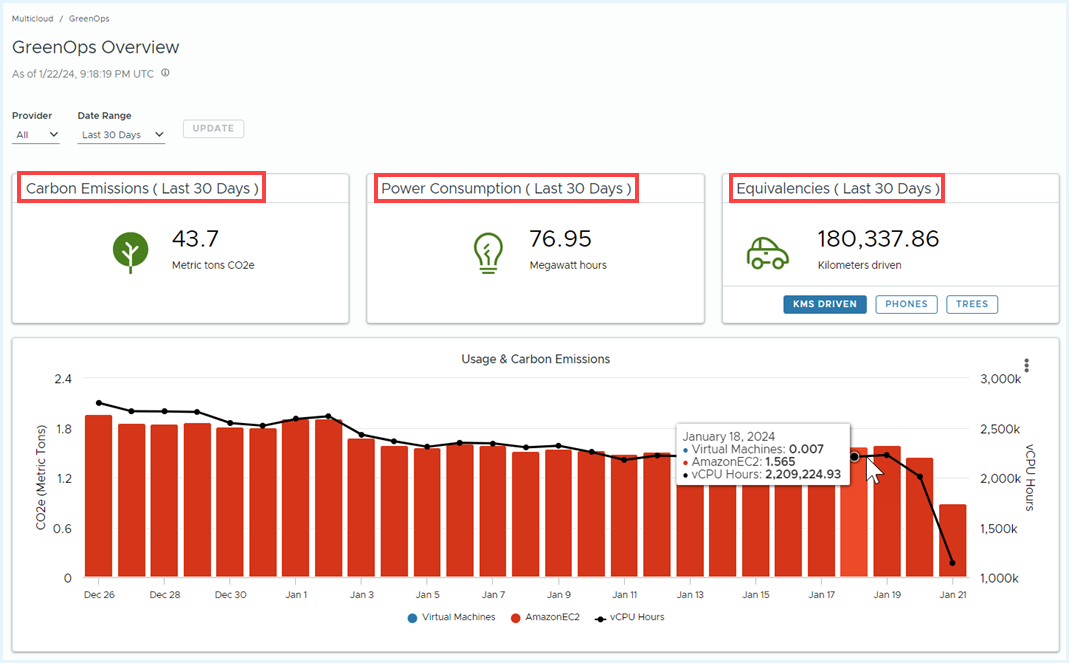
Select the cloud provider for which you want to see the carbon footprint.
- The Carbon Emissions widget provides details of CO2 emissions. The value is calculated in metric ton.
- The Power Consumption widget provides details of the power usage of your virtual machine resources. The value is calculated in Megawatt (MW).
- The Equivalencies widget provides the following emission equivalencies. (Source - Cloud Carbon Footprint)
- The number of kilometers the cars could have been driven.
- The number of phones that could have been charged.
- The number of tree seedlings could have been grown in 10 years to help sequester future CO2 emissions.
The dual Y-axis graph displays the supported assets and metrics, such as CO2e in metric tons and vCPU in hours.
Supported Asset Types
The GreenOps dashboard supports the following assets -
| Cloud | Asset Type |
|---|---|
| AWS | AWS EC2 |
| Azure | Azure Virtual Machines ( For EA and MCA Azure agreements only) |
Units of Measurement
To determine a virtual machine’s power consumption for the underlying host’s physical processor, Tanzu CloudHealth uses the manufacturer’s published TDP (Thermal Design Power) values. This is scaled to the proportion of the physical host’s resources, observed CPU utilization and daily usage minutes to calculate CO2eq. Additionally, Tanzu CloudHealth factors in the carbon intensity based on the geographic region.
- Energy Consumption (Watts per Hour)
- 1 MWh (Megawatt/Hr) = 1,000 KWh (Kilowatt/Hr)
- 1 KWh = 1,000 Watts/Hr
- Carbon (Weight)
- 1 mt (Metric ton) = 1,000 kg (Kilograms)
- 1 kg = 1,000 g (Grams)
- Carbon Intensity (Ratio)
- gCO2eq / KWh (preferred at the instance level)
- kgCO2eq / MWh (preferred at daily/monthly)
Note that the FlexReport displays carbon emission data in grams and power data in watts.
Using FlexReport Dataset
The Multi-Cloud Operational Emissions dataset in Flexreport provides per instance, daily granularity data to power your GreenOps experiences. You can check the details of the carbon footprint of your infrastructure usage and accordingly take carbon remediation actions to achieve your sustainability goal.
You can create a report using the following measures and dimensions.
Measures
| Name | Description |
|---|---|
| AverageCPU | Daily Average CPU utilization |
| Carbon | Carbon Equivalent emissions in grams (gCO2eq). Note this might need to be scaled into kilograms ( div 1000) or metric tons ( div 1,000,000) for display purposes. |
| Power | Power in Watt Hours. This may also need to be scaled to KiloWatts ( div 1000) or MegaWatts (div 1,000,000). |
| Usage Minutes | The total daily minutes the resource was active. |
| VCPUHours | Scaled Usage Hours. For example, an instance has 4 vCPUs and is active for 2.5 hours = (4 * 2.5 = 10 VCPUHours). |
Dimensions
| Name | Description |
|---|---|
| Cloud | AWS, Azure |
| Country | Country where resource resides |
| InstanceType | Cloud provider’s instance type |
| ModelVersion | Tanzu CloudHealth algorithm version number. For example -CHT001. The number might get updated in the future if there is any change in the algorithm. |
| Region | The region where the resource resides |
| ResourceId | Canonical resource id |
| ResourceName | Friendly name for Azure instance, Resource Id for AWS instance |
| Service | Amazon EC2 or Azure Virtual Machines |
| UsageAccountId | Usage account or Subscription ID. The lowest level in the organizational hierarchy is where the resource is homed. |
| AccountName | Friendly name for UsageAccount |
| SuborgId | Tanzu CloudHealth Organization Id |
| Suborgname | Tanzu CloudHealth Organization Name |
| Perspective | List of perspectives |
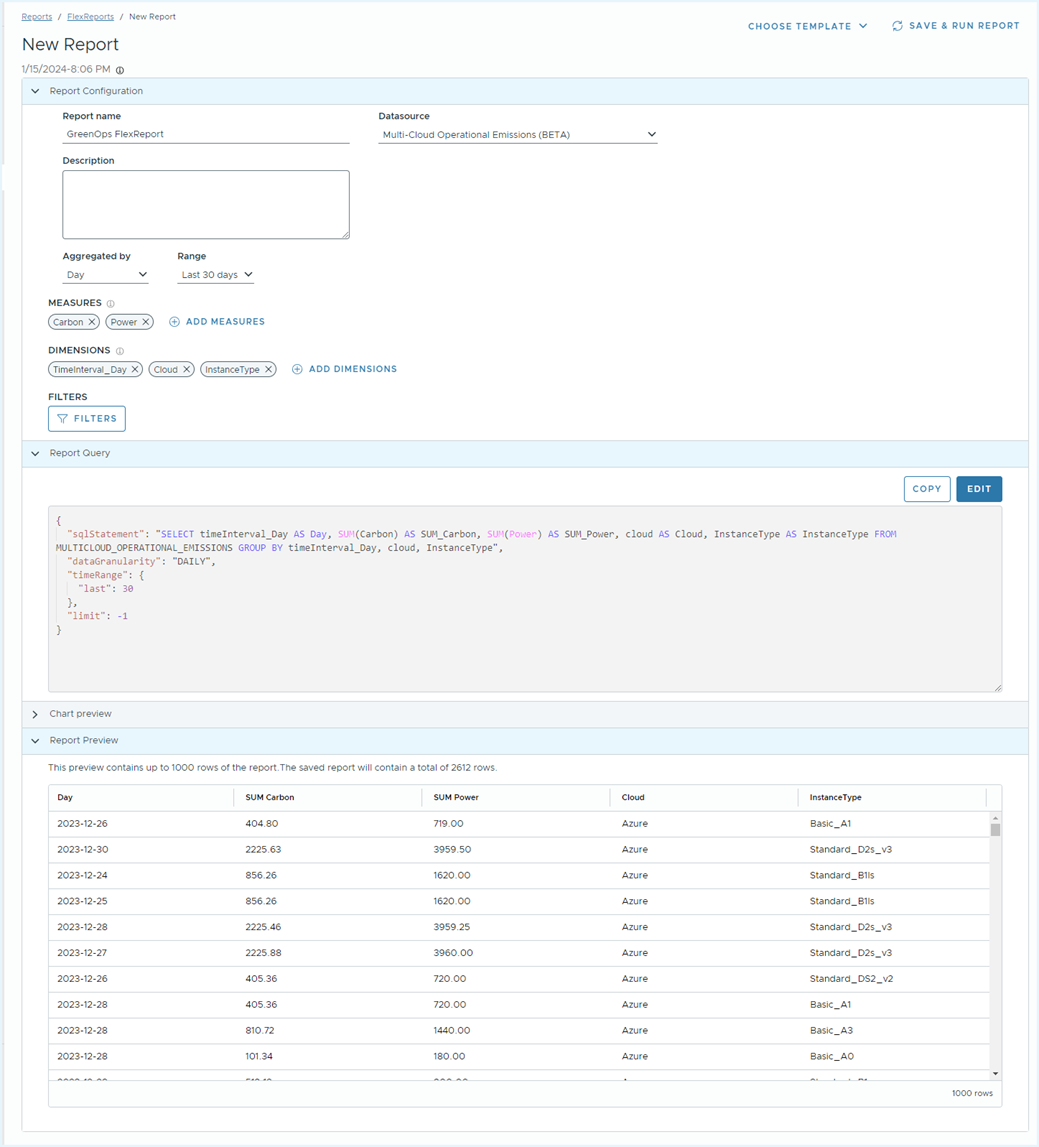
To create a FlexReport,
- Navigate to Reports > FlexReports, and click New Report.
- Provide a name and description.
- From the Datasource dropdown, select Multi-Cloud Operational Emissions datasource.
- Modify any filters, measures, or dimensions as needed.
- When finished, select Save & Run Report.
On the FlexReports page, you can check the Report Status. For more information, see FlexReport.
For your convenience, wherever possible, the naming conventions have been mapped to the FinOps Open Cost and Usage Specification (FOCUS) version 0.5.
For the Azure cloud, only Enterprise Agreement (EA) and Azure Microsoft Customer Agreement (MCA) data are available in the Multi-Cloud Operational Emissions dataset.
Terms and Definitions
- CO2e - Carbon dioxide (CO2) equivalent. It is a unit of measurement used to compare greenhouse gas emissions based on the global warming potential of the gas.
- Carbon Emission - Represents the amount of greenhouse gasses (GHGs) emitted into the atmosphere directly or indirectly due to a specific activity.
- Greenhouse gasses - Gasses that absorb radiation. The main greenhouse gasses are - Carbon Dioxide (CO2), Methane, and Nitrous Oxide.
