


Managing Data Center Accounts
FAQs about VMware Tanzu CloudHealth Aggregator
Here are answers to some frequently asked questions about the VMware Tanzu CloudHealth Aggregator.
Where does the Tanzu CloudHealth Aggregator need to be installed
The Tanzu CloudHealth Aggregator provides a connection between the Tanzu CloudHealth and vSphere. Install the aggregator in your vSphere environment and ensure it has direct network access without proxy to the vCenter server.
What are the system requirements for the Tanzu CloudHealth Aggregator
The Tanzu CloudHealth Aggregator deploys as a single VM on-premise for each vSphere environment. Ensure that you have a VM size of 2 vCPUs, 2 GB memory, and 10 GB of disk storage.
Note: The disk storage is only required for logs that are generated by the aggregator.
Which operating systems does the Tanzu CloudHealth Aggregator support
The aggregator supports all Linux flavors, including RedHat, Ubuntu, CentOS, and SUSE
What software is required to be installed on the Tanzu CloudHealth Aggregator
The aggregator requires the following software:
- OpenJDK (version 7 or 8)
- curl
- openSSL
Tanzu CloudHealth also provides an installer script that will help further in the installation process.
Does the Tanzu CloudHealth Aggregator support proxy setup
Proxy support is built into the installer script provided by Tanzu CloudHealth. During the install process, you are prompted to enter their proxy information in the following format:
hostname: IP address or hostname for proxy, e.g., proxy.ops.cloudhealthtech.com port: port number of the proxy server username: username, if proxy requires authentication password: password, if proxy requires authentication
These proxy parameters can be entered as prompted, or set in corresponding environment variables. For more information on how to do this, see Enable Virtual Appliance.
What vSphere credentials are required by Tanzu CloudHealth
Create a new user for your vSphere environment and provide this user read-only access.
Does VMware account setup in Tanzu CloudHealth support VMware Active Directory
Yes, Tanzu CloudHealth supports Active Directory. The process to setup a new read-only VMware AD users is as follows:
- Setup a VMware role for read-only access.
- Setup a simple AD group, and make the AD user a member of that group.
Assign the AD group with that VMware role at the vCenter object level in the configuration.
How many vCenters should be added per aggregator
Tanzu CloudHealth recommends adding one vCenter per aggregator to make troubleshooting the aggregator logs easier. However, you can add multiple vCenters per aggregator.
How many virtual machines can be added per aggregator
A single aggregator instance can manage a maximum of 5k VMs. To add more than 5k VMs, you need to deploy another aggregator instance.
If you plan to add VMs from multiple vCenters, then Tanzu CloudHealth recommends adding a maximum of 3.5k VMs per aggregator across all vCenters. Adding more than 3.5k VMs from multiple vCenters may lead to performance issues.
Does Tanzu CloudHealth support multiple tags in the same category
Tanzu CloudHealth does not support multiple tags in the same category. If you have multiple tags in the same category, Tanzu CloudHealth only considers the latest tag value.
Which vCenter version does the Tanzu CloudHealth Aggregator support for tag collection
The aggregator supports vSphere tags collection from vCenter 6.0 and onwards.
What statistics collection levels does Tanzu CloudHealth need to pull vSphere performance metrics
By default, vSphere is setup for Level 1 collection levels. Tanzu CloudHealth requires the collection level to be modified to Level 2. Tanzu CloudHealth uses 5 min rollup averages as provided by vSphere API in during metric collection.
How often is the data transmitted
Data from the customers vSphere environment to Tanzu CloudHealth is processed through two different calls:
- Every 15 min: vCenter connection health check.
- Every 60 min: Collection of metrics, assets, and tags on all VMs.
Note: vSphere metrics collected every 60 min are 5 min averages; therefore, there are 12 “5 min averages” on every VM.
What are the security ramifications, if any, of the Tanzu CloudHealth Aggregator and how does it transmit the data back to the application
The Tanzu CloudHealth Aggregator connects to vSphere via the URL provided during account setup. During initial setup, there is public-private key exchange between Tanzu CloudHealth and the aggregator, and each data payload sent by Tanzu CloudHealth to the aggregator is encrypted.
In addition, the vSphere password provided during account setup is not stored in Tanzu CloudHealth, but in an encrypted vault locally by the aggregator.
Note: All communication between the Tanzu CloudHealth Aggregator and Tanzu CloudHealth API is also secured using SSL/TLS.
What data is transmitted by the Tanzu CloudHealth Aggregator
A JSON file that includes configuration of each VM along with aggregated Disk I/O, Filesystem, and Memory metrics is transmitted (pushed) by the Tanzu CloudHealth Aggregator to the Tanzu CloudHealth API.
What are Maintenance Requirements, if any, of the Tanzu CloudHealth Aggregator
There are no regular maintenance requirements for the aggregator. You can modify the extent of log history and logging level in Tanzu CloudHealth, and the aggregator rotates its logs according to those settings.
Note: The Tanzu CloudHealth Aggregator upgrade is a semi-manual process that is triggered from the Tanzu CloudHealth platform and executed automatically by the aggregator. There is no regular upgrade schedule; Tanzu CloudHealth will recommend upgrades to certain versions when there are fixes or enhanced features on a case-by-case basis.
Is there a workaround if the Tanzu CloudHealth Aggregator OVA deployment fails
If the Tanzu CloudHealth Aggregator OVA deployment fails or behaves unexpectedly, use the following workaround: 1. Install a normal Linux VM. 2. In the Tanzu CloudHealth Platform, go to Setup > Data Collection > Aggregators. Select View for the desired aggregator. 3. Select New Installer at the top of the page to download the cht_installer script. 4. Run the cht_installer script manually in the Linux VM to initiate the aggregator.
Troubleshoot the Tanzu CloudHealth Aggregator
Determine the status of the Tanzu CloudHealth Aggregator and understand how to fix problems
What Is an Unhealthy Aggregator
Once you have configured and deployed the Tanzu CloudHealth Aggregator in your infrastructure, the Tanzu CloudHealth Platform communicates with the aggregator in two ways:
- Check aggregator health every 30 minutes
- Expect aggregator request every 30 seconds
An aggregator is identified as Unhealthy if the Tanzu CloudHealth API does not receive a request from the aggregator for at least 30 minutes.
If you see an Unhealthy aggregator, do no update its settings or upload logs.
How to Troubleshoot an Unhealthy Aggregator
Validate That Aggregator Process is Running
- In the VM where you have deployed the Tanzu CloudHealth Aggregator, run this command at the terminal:
ps -ef | grep cht_aggregator.jarThe output of the command should include the Heapsize value.
-
Use the Heapsize value in this command.
java -Xmx1024M -jar cht_aggregator.jarHere
-Xmx1024Mis the Heapsize obtained from the first command.The following output appears:
root 1116 1 12 Aug26 ? 17:01:49 java -Xmx1024M -jar cht_aggregator.jar start -
If the aggregator is not running, retrieve Aggregator logs and VM specifications.
- Send the logs and specifications to Tanzu CloudHealth Support.
Make Sure VM Can Ping Tanzu CloudHealth API
- In the VM where you have deployed the Tanzu CloudHealth Aggregator, run this command at the terminal:
curl https://api.cloudhealthtech.com/v1/healthThe output should have the following format.
{"status":"Happy","time":"2017-09-01 15:53:28 +0000", "running_version":"63d88ced36de8b37acee09291a34a9e959ffe097","tag":"20170823.01"} - If the expected output is not similar to the example a possible connectivity problem exists. Check for any proxy issues that might be preventing requests to the Tanzu CloudHealth API.
Validate If the Aggregator Token Has Expired and Re-Register
In the aggregator logs, if you find 401 Unauthorized or 400 Bad request error, the token probably has expired. In that case, generate a new installer token from the Tanzu CloudHealth platform and re-register with the new installer token.
- In the Tanzu CloudHealth platform where you have added aggregator instance, go to the aggregator details page, click New Installer to get a new registration token.
- Skip the downloaded installer file and refresh the page. The new Installer Token shows up on the aggregator details page.
- Copy the installer token and login to the aggregator machine.
- To go to the aggregator working directory, run this command:
cd ~/aggregator_TOKENPOSTFIX - To stop already running aggregator service, run this command:
/etc/init.d/cht_aggregator stop - To re-register Installer Token, run this command:
java -jar cht_aggregator.jar register --token="YOUR INSTALLATION TOKEN" - Now run the aggregator service using the following command:
sudo /etc/init.d/cht_aggregator start - Now go to the aggregators page in Tanzu CloudHealth and check if your instance turned
HEALTHY.
Validate If the Unhealthy Status Is Due To Recent Changes in Your Network/Proxy Configurations
Sometimes network/proxy restrict Aggregator to make either GET or POST calls to the Tanzu CloudHealth API endpoint. Verify the same using the following manual verification steps.
- To navigate to the aggregator working directory, run this command:
cd aggregator_TOKEN - To get identifier and access_token, run this command:
java -jar cht_aggregator.jar read_vault - To POST aggregator Healthy status as 1, run this command:
curl -v --request POST --url 'https://api.cloudhealthtech.com/v1/collector/status?status=1' -H 'Content-Type: application/json' -H 'Collector-Id: \<ID\>' -H 'Collector-Token: \<TOKEN\>To add a proxy, insert
-x"[protocol://][user:password@]proxyhost[:port]"after-vin the above command. - Now go to the aggregator details page in the Tanzu CloudHealth platform and check if your instance status turned
HEALTHY.
Retrieve Aggregator Logs
In the VM where you have deployed the Tanzu CloudHealth Aggregator, enter these commands at the terminal:
ubuntu@ubuntu-chtdemo-aggregator:~$ ls
aggregator_e56a3cdc  cht_installer.sh  stres.sh  temp  tmp
ubuntu@ubuntu-chtdemo-aggregator:~$ cd aggregator_e56a3cdc/
ubuntu@ubuntu-chtdemo-aggregator:~/aggregator_e56a3cdc$ ls
cacert.pem  cht_aggregator.bak	cht_aggregator.jar  cht_aggregator_upgrade.jar	lib  logs  :q  tmp  upgrade.sh
ubuntu@ubuntu-chtdemo-aggregator:~/aggregator_e56a3cdc$ tar -cvf cht_aggregator_logs.tar logs/*
logs/aggregator.20170823.log
logs/aggregator.20170824.log
logs/aggregator.20170825.log
logs/aggregator.20170826.log
logs/aggregator.20170827.log
logs/aggregator.20170828.log
logs/aggregator.20170829.log
logs/aggregator.20170830.log
logs/aggregator.20170831.log
logs/aggregator.20170901.log
logs/aggregator.log
logs/aggregator.log.age
logs/cht_aggregator_upgrade.log
ubuntu@ubuntu-chtdemo-aggregator:~/aggregator_e56a3cdc$
Retrieve VM Specifications
Get Memory Specifications
- In a terminal on the VM, run this command:
cat /proc/meminfo - Send the output to Tanzu CloudHealth Support.
Get CPU Specifications
- In a terminal on the VM, run this command:
cat /proc/cpuinfo - Send the output to Tanzu CloudHealth Support.
How to Restart the VM
- In a terminal on the VM, run this command:
sudo shutdown -r now - Validate that the aggregator is running and the VM can make requests to the API.
How to Create a vCenter Read-only User Account
Step 1: Create a User
- Log in to vCenter as an administrator using vSphere desktop or web client.
- Navigate to Menu > Administration > Single Sign on > Users and Groups.
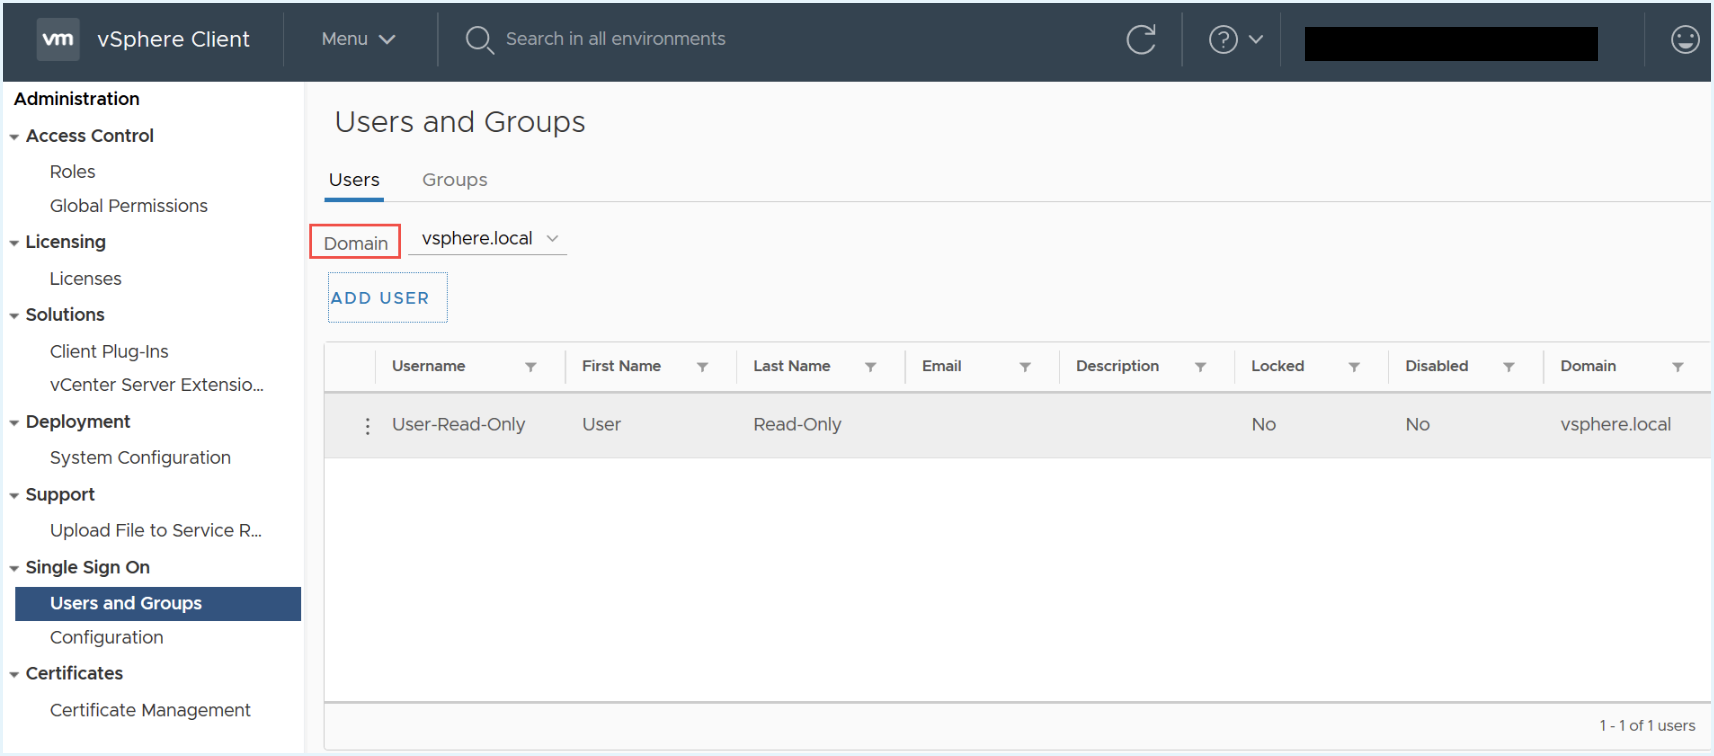
- Select the Domain name as
vsphere.localand click Add User. - In the Add User dialog box, enter the required details, and click Add.
Step 2: Add Global Root Permission
Add global root permission with a read-only role to the user created in step 1.
- From the left menu, select Global Permissions, and click the + icon to add the permission.
- In the search field, select the user name you created in step 1 and select Read-only role from the Role dropdown.
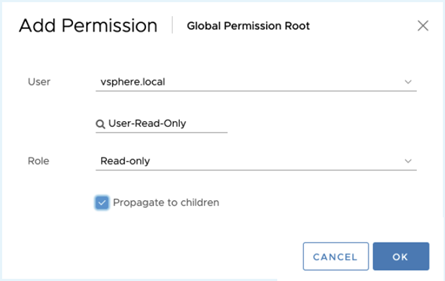
- Select Propagate to children checkbox, and click Ok.
Step 3: Add the User Permission at the vCenter Root Object Level
- Click Menu > Host and Clusters, select the top vCenter object from the left pane hierarchy and click the Permissions tab in the right pane.

- Click + icon to add permission.
- In the Add Permission dialog box, in the search field, select the user you created in step 1, select Read-only role from the Role dropdown.
- Select Propagate to children checkbox and click Ok.
- Verify whether the created user with the read-only role and global root object-level access can log in and see the vCenter and child objects hierarchy.
If the user with the read-only role can log in and access the vCenter Client, then you can create an account in the Tanzu CloudHealth platform for the same user and can view the account in the Data Center.
Note - The above vCenter screenshots are from VC 6.5. The screenshots could be different for other vCenter versions.
