


Integrating with Third Party Services
Integrate with Webhooks
Using webhooks you can now push real-time notifications to third-party applications. Webhooks are integrated to the Tanzu CloudHealth policy engine as an action. When a policy is triggered, the event data is pushed to the webhook URL and the configured action gets implemented.
View Webhooks
Navigate to Setup > Admin > Webhooks to view the list of configured Webhooks.
- Name
- Webhook URL
- HTTP Status: 200 OK, 201 Created.
- Last Triggered
- Last Updated
Create and Test a Webhook
- Navigate to Setup > Admin > Webhooks.
- Click on Add Webhook.
- Provide the following details:
- Integration Name
- URL
- Header Name and Header value. Click on +Add Header to add multiple Headers.
- Template. You can either choose the default template as shown in screenshot below or create a custom template. Note that you can create only one custom template per integration.
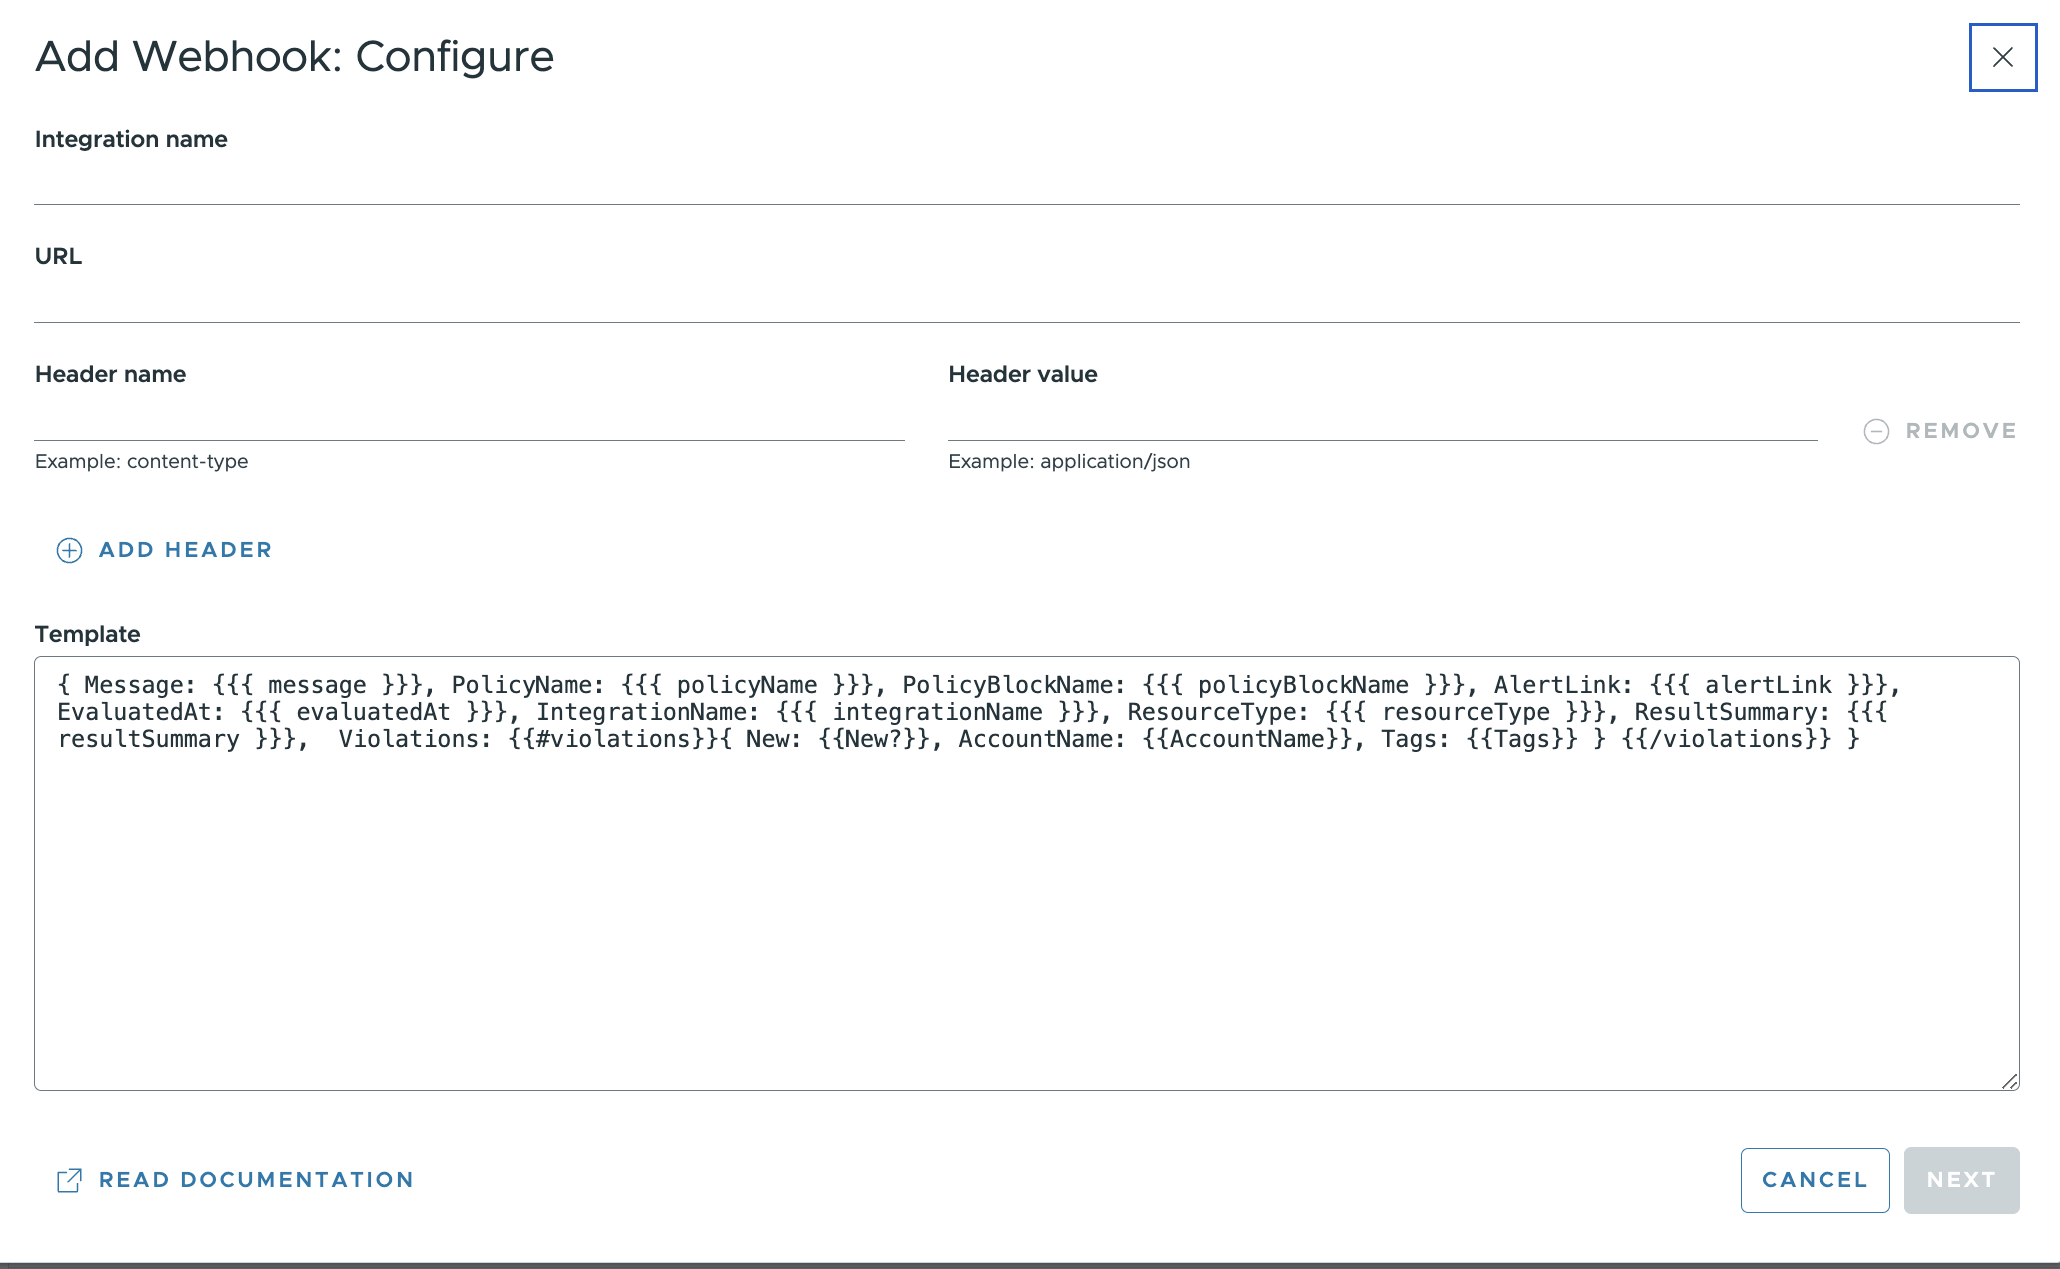
- Click on Next to review the Webhook configuration.
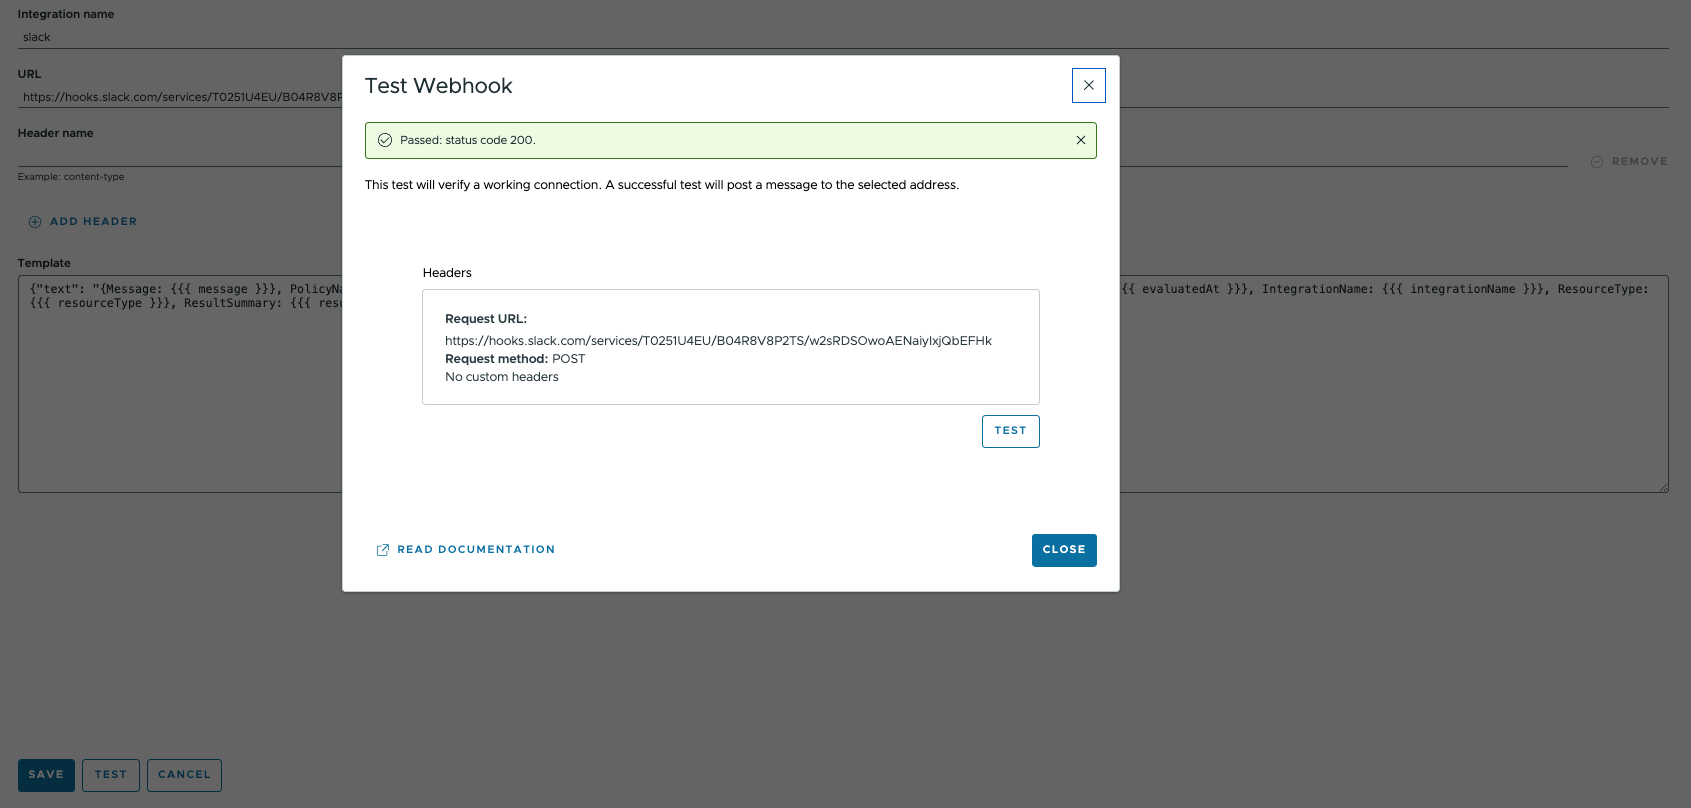
- Click on Test to send a message and verify the connection. A successful test will post a message to the selected address.
- Click Save.
Add Webhook notification to a Policy Block
- Navigate to Governance > Policies, to create a new policy or edit an existing policy.
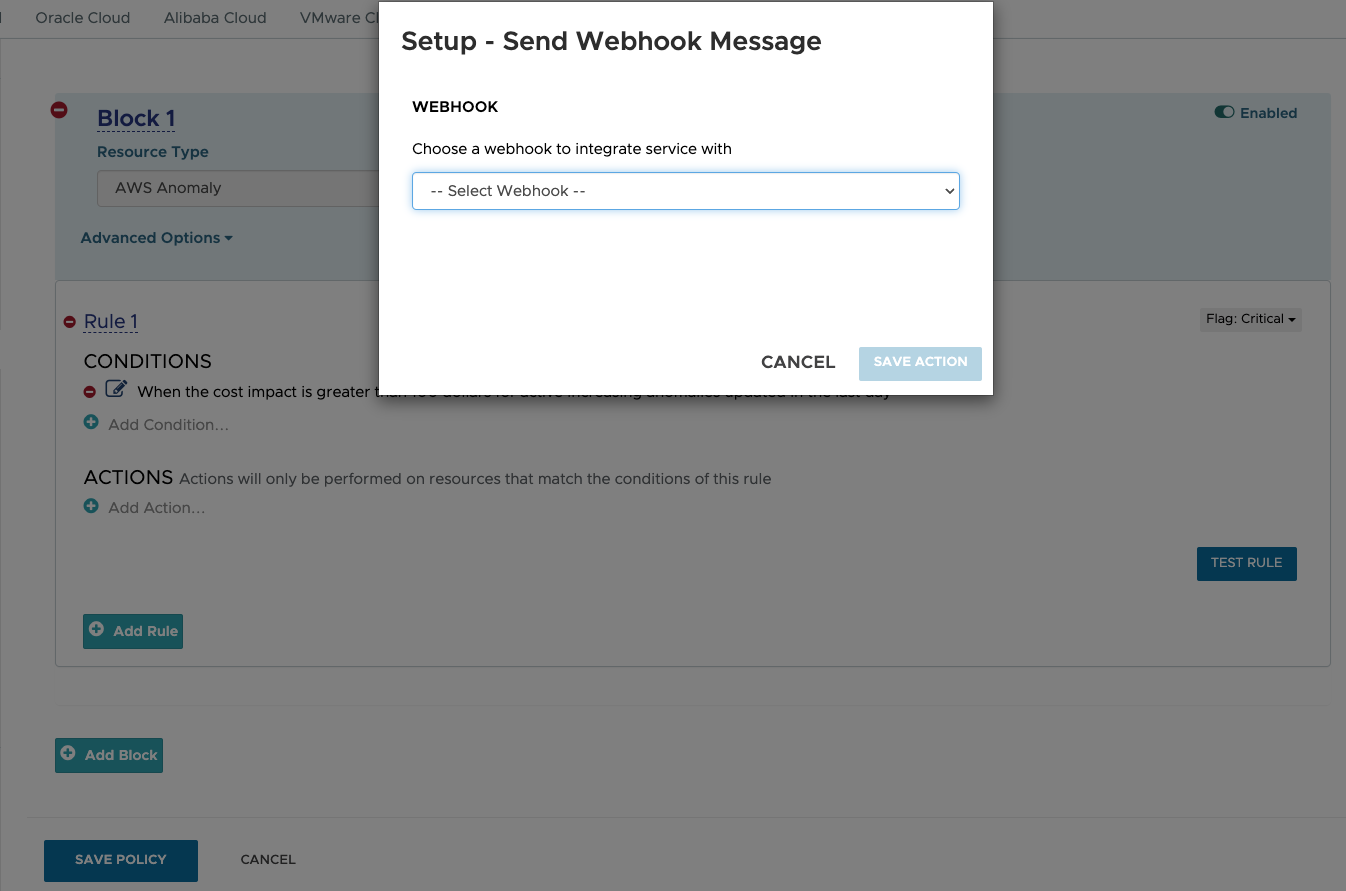
- Under the Policy Block > Actions, click on Add Action.
- From the dropdown, select Send Webhook Message.
- In the popup window, Setup – Send Webhook Message, choose the webhook for the integration and click Save Action.
- Save Policy.
Edit or Delete a Webhook
- Navigate to Setup > Admin > Webhooks.
- Select the Webhook you want to delete and click on the vertical ellipsis to select Edit or Delete.
You can also select multiple Webhooks and click on the dropdown for Bulk Actions to select Delete.
Use Case for Configuring a Slack Webhook
This section lists the detailed steps involved in configuring and deploying a webhook using API for a slack notification on configuring untagged AWS EC2 instances:
-
Create a mustache template with the following fields:
- Message
- PolicyName
- PolicyBlockName
- AlertLink
- EvaluatedAt
- IntegrationName
- ResourceType
- ResultSummary
- Warnings
- Violations
The above fields could be of any description of your choice. However, the mustache variables within the brackets are case-sensitive and should be used as shown in the image below:
 For Warnings only the first 50 violation records are shown. To view all results, go to AlertLink.
 -
Using the API key get the fresh access token and test the template. Create a Webhook by name ‘slack webhook’, using the Query variable that will include the template from step one and the slack channel URL. Use the template created in Step 1 in the
“template”:field.{ "input": { "name": "slack webhook", "eventType": "crn::webhookEventType/1", "headers": [], "template": "url": "https://hooks.slack.com/services/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" } }Note: The event type will always be
crn::webhookEventType/1when the Webhook is created for Policies. -
Create a Webhook with the template using the following mutation and the above variables for the query:
mutation CreateWebhook($input: WebhookConfigInput!) { createWebhook(input: $input) { id } } -
To add this webhook notification to a policy block, navigate to Governance > Policies and click on New Policy.
- Name: Slack webhook demo
- Policy Block > Resource Type : EC2 instance
- Policy Block > Conditions : Configuration > untagged
- Policy block > Actions: Send Webhook Message. From the drop-down, select the webhook created in the previous step –
slack webhook.
-
When the policy is triggered, a slack message will be generated referring to the number of untagged instances. You can also navigate to Dashboards > Notifications to find a notification related to this policy.
The following section provides a comprehensive list of all attributes of the violation for a specific policy resource type.
"AWS Anomoly": [
New?",
"Tags",
"StartDate",
"Duration",
"AccountName",
"AccountId",
"Service",
"Region",
"CostImpact",
"CostImpactPercentage",
"CostImpactType",
"Cost",
"Status"
],
"EC2 Instance": [
"New?",
"Tags",
"AccountName",
"AWSAccountID",
"InstanceName",
"InstanceId",
"PublicIP",
"Product",
"APIName",
"Tenancy",
"ZoneName",
"AttachedEBS",
"ProjectedCostForMonth",
"LaunchedBy",
"OwnerEmail"
],
"EC2 Image": [
"New?",
"Tags",
"AccountName",
"AWSAccountID",
"ImageId",
"ImageName",
"RootDeviceType",
"Public",
"RegionName"
],
"EC2 Reservation": [
"New?",
"Tags",
"Scope",
"AccountName",
"AWSAccountID",
"OfferingType",
"OfferingClass",
"APIName",
"ZoneName",
"RegionName",
"VPC",
"Count",
"OperatingSystem",
"ActualPrice",
"TimeToExpire"
],
"EBS Volume": [
"New?",
"Tags",
"AccountName",
"AWSAccountID",
"VolumeName",
"VolumeId",
"InstanceName",
"ZoneName",
"Size(GB)",
"InUse",
"ListPricePerMonth",
"OwnerEmail"
],
"KMS Encryption Key": [
"New?",
"Tags",
"AccountName",
"AWSAccountID",
"RegionName",
"KeyID",
"Status",
"CreationDate",
"RotationEnabled?"
],
"EC2 Snapshot": [
"New?",
"Tags",
"AccountName",
"AWSAccountID",
"SnapshotName",
"SnapshotId",
"VolumeName",
"Size(GB)",
"RegionName",
"CreateDate"
],
"S3 Bucket": [
"New?",
"Tags",
"Name",
"StorageinGB",
"AccountName",
"AWSAccountID",
"Access"
],
"SageMaker Endpoint": [
"New?",
"Tags",
"AccountName",
"AWSAccountID",
"RegionName",
"EndpointName",
"CreationTime",
"EndpointStatus",
"LastModified"
],
"SageMaker Notebook Instance": [
"New?",
"Tags",
"AccountName",
"AWSAccountID",
"RegionName",
"NotebookInstanceName",
"NotebookInstanceType",
"CreationTime",
"NotebookInstanceStatus",
"LastUpdated"
],
"RDS Instance": [
"New?",
"Tags",
"AccountName",
"AWSAccountID",
"InstanceId",
"ZoneName",
"APIName",
"Multi-AZ",
"Snapshots?",
"Encrypted?",
"ListPricePerMonth",
"ProjectedCostForCurrentMonth",
"CreatedOn"
],
"RDS Security Group": [
"New?",
"Tags",
"AccountName",
"AWSAccountID",
"RegionName",
"Name",
"Description"
],
"Lambda Function": [
"New?",
"Tags",
"AccountName",
"AWSAccountID",
"FunctionName",
"Description",
"Runtime",
"Handler",
"MemorySize",
"CodeSize",
"Timeout"
],
"RDS Subnet Group": [
"New?",
"Tags",
"AccountName",
"AWSAccountID",
"VPCId",
"Name",
"Description"
],
"RDS Snapshot": [
"New?",
"Tags",
"AccountName",
"AWSAccountID",
"SnapshotId",
"InstanceId",
"Size(GB)",
"ZoneName",
"CreateDate"
],
"Classic Load Balancer": [
"New?",
"Tags",
"AccountName",
"AWSAccountID",
"RegionName",
"Name",
"DNSName",
"CreatedAt",
"VPCId"
],
"Security Group": [
"New?",
"Tags",
"AccountName",
"AWSAccountID",
"GroupName",
"GroupId",
"RegionName"
],
"EC2 Spot Request": [
"New?",
"Tags",
"AccountName",
"AWSAccountID",
"InstanceName",
"APIName",
"ZoneName",
"SpotId",
"Maximum(bid)Price",
"RequestType",
"CreateDate"
],
"EMR Cluster": [
"New?",
"Tags",
"AccountName",
"AWSAccountID",
"ClusterId",
"Name",
"State",
"StateChangeCode",
"ZoneName"
],
"VPC": [
"New?",
"Tags",
"AccountName",
"AWSAccountID",
"VPCName",
"VPCId",
"State",
"CIDRBlock",
"DHCPOptionsId"
],
"VPC Subnet": [
"New?",
"Tags",
"AccountName",
"AWSAccountID",
"SubnetId",
"SubnetName",
"VPCId",
"State",
"CIDRBlock",
"AvailableIPs"
],
"CloudTrail Trail": [
"New?",
"Tags",
"AccountName",
"AWSAccountID",
"Name",
"TrailARN",
"S3BucketName",
"IsMulti-RegionTrail"
],
"WorkSpace": [
"New?",
"Tags",
"AccountName",
"AWSAccountID",
"DirectoryID",
"Username",
"WorkSpaceID",
"State",
"AutoStopTimeout"
],
"Auto Scaling Group": [
"New?",
"Tags",
"AccountName",
"AWSAccountID",
"AutoScalingGroupName",
"MinSize",
"MaxSize",
"DesiredCapacity",
"AvailabilityZones"
],
"Kinesis Firehose": [
"New?",
"Tags",
"AccountName",
"AWSAccountID",
"RegionName",
"FirehoseName",
"FirehoseStatus",
"Created",
"Source",
"Destinations"
],
"Kinesis Stream": [
"New?",
"Tags",
"AccountName",
"AWSAccountID",
"RegionName",
"Name",
"Status",
"NumberofShards"
],
"ElastiCache Cluster": [
"New?",
"Tags",
"AccountName",
"AWSAccountID",
"Name",
"Engine",
"ZoneName",
"RegionName",
"CreatedOn"
],
"ElastiCache Reserved Node": [
"New?",
"Tags",
"AccountName",
"AWSAccountID",
"OfferingType",
"Duration",
"NodeCount",
"StartTime",
"NodeType",
"FixedPrice",
"UsagePrice",
"RegionName"
],
"Cloud Formation Stack": [
"New?",
"Tags",
"AccountName",
"AWSAccountID",
"Name",
"StackId",
"CreatedAt"
],
"Elastic File System": [
"New?",
"Tags",
"AccountName",
"AWSAccountID",
"Name",
"Size(Bytes)",
"CreationTime",
"PerformanceMode",
"FileSystemID",
"LifeCycleState"
],
"OpenSearch Domain": [
"New?",
"Tags",
"DomainName",
"ElasticsearchVersion",
"InstanceType",
"InstanceCount",
"EBSVolumeType",
"EBSVolumeSize",
"EBSVolumeIOPS",
"AutomatedSnapshotStartHour",
"DomainStatus",
"ProjectedMonthlyCost"
],
"RDS Instance Reservation": [
"New?",
"Tags",
"AccountName",
"AWSAccountID",
"Type",
"InstanceId",
"APIName",
"RegionName",
"Count",
"DatabaseType",
"Multi-AZ",
"FixedPrice"
],
"Redshift Cluster": [
"New?",
"Tags",
"AccountName",
"AWSAccountID",
"ClusterIdentifier",
"ZoneName",
"RegionName",
"Snapshots?",
"CreatedOn"
],
"Redshift Reserved Node": [
"New?",
"Tags",
"AccountName",
"AWSAccountID",
"ReservedNodeId",
"ReservedNodeOfferingId",
"StartTime",
"Duration",
"NodeType",
"RegionName"
],
"DMS Replication Instance": [
"New?",
"Tags",
"AccountName",
"AWSAccountID",
"RegionName",
"InstanceID",
"InstanceStatus",
"InstanceClass",
"VPCId",
"ZoneName",
"Public?",
"Multi-AZ?",
"Created",
"PublicIPAddress",
"PrivateIPAddress"
],
"NAT Gateway": [
"New?",
"Tags",
"AccountName",
"AWSAccountID",
"VPCId",
"SubnetId",
"NATGatewayId",
"PublicIP",
"PrivateIPAddress",
"AllocationID",
"NetworkInterfaceID",
"State"
],
"WorkSpace Bundle": [
"New?",
"Tags",
"AccountName",
"AWSAccountID",
"RegionName",
"BundleID",
"BundleName",
"BundleComputeType",
"Description",
"Owner",
"Custom?"
],
"SageMaker Training Job": [
"New?",
"Tags",
"AccountName",
"AWSAccountID",
"RegionName",
"TrainingJobName",
"CreationTime",
"JobStatus"
],
"Savings Plan": [
"New?",
"Tags",
"Name",
"DisplayName",
"SubscriptionName",
"SKUName",
"AppliedScopeDisplayName",
"Type",
"AppliedScopeType",
"BillingPlan",
"CommitmentAmount",
"CommitmentCurrency",
"CommitmentGrain",
"Renew",
"Term",
"DisplayProvisioningState",
"EffectiveDateTime",
"ExpiryDateTime",
"PurchaseDateTime",
"UtilizationTrend",
"IsActive?",
"Derived?"
],
"OpenSearch Reserved Instance": [
"New?",
"Tags",
"AccountName",
"AWSAccountID",
"RegionName",
"ReservationName",
"ReservationID",
"OfferingID",
"ReservationType",
"StartTime",
"Duration",
"InstanceCount",
"Status",
"PaymentOption"
],
"EC2 Application Load Balancer": [
"New?",
"Tags",
"AccountName",
"AWSAccountID",
"RegionName",
"DNSName",
"Name",
"ARN",
"CreatedAt",
"Derived?",
"VPCId"
],
"EC2 Network Load Balancer": [
"New?",
"Tags",
"AccountName",
"AWSAccountID",
"RegionName",
"DNSName",
"Name",
"ARN",
"Created",
"Derived?",
"VPCId"
],
"KMS Customer Master Keys": [
"New?",
"Tags",
"AccountName",
"AWSAccountID",
"RegionName",
"KeyID",
"Status",
"CreationDate",
"RotationEnabled?"
],
"EKS Cluster": [
"New?",
"Tags",
"AccountName",
"AWSAccountID",
"RegionName",
"ARN",
"Status",
"ClusterName",
"Version"
],
"EKS Node Group": [
"New?",
"Tags",
"ARN",
"ClusterName",
"KubernetesVersion",
"KubernetesLabels"
],
"ElastiCache Replication Group": [
"New?",
"Tags",
"Name",
"ARN",
"CreateTime",
"GlobalReplicationGroupName",
"Status",
"CacheNodeType",
"ClusterEnabled",
"AuthTokenEnabled",
"IsActive"
],
"CloudWatch Log Group": [
"New?",
"Tags",
"LogGroupName"
],
"FSx File System": [
"New?",
"Tags",
"AccountName",
"AWSAccountID",
"RegionName",
"ResourceID",
"FileSystemID",
"CreationTime",
"Lifecycle",
"FileSystemType",
"StorageCapacity",
"StorageType"
],
"AppStream Application": [
"New?",
"Tags",
"Name",
"ARN",
"CreatedTime",
"DisplayName",
"IconURL",
"Metadata",
"IconS3Bucket",
"Platforms",
"LaunchPath",
"IsActive?"
],
"Chef Node": [
"New?",
"Tags",
"NodeName",
"Runlist",
"OS",
"OSVersion",
"IP",
"LastCheckin"
],
"File System": [
"New?",
"Tags",
"Mount",
"InstanceName",
"Size",
"%Used"
],
"Route 53 Hosted Zone": [
"New?",
"Tags",
"AccountName",
"AWSAccountID",
"Name",
"RecordSetCount",
"HostedZoneId",
"FirstDiscovered"
],
"DynamoDB Table": [
"New?",
"Tags",
"AccountName",
"AWSAccountID",
"RegionName",
"TableName",
"ItemCount",
"TableStatus",
"TableSizeBytes",
"ProvisionedReadCapacityUnits",
"ProvisionedWriteCapacityUnits"
],
"Amazon Elastic IP": [
"New?",
"Tags",
"AccountName",
"AWSAccountID",
"PublicIP",
"RegionName",
"InstanceName",
"Domain",
"PrivateIPAddress"
],
"Amazon Account": [
"New?",
"Tags",
"AccountName",
"OwnerId",
"AccountType",
"AuthenticationType",
"BillingAccount",
"DetailedBillingBucket",
"ConsolidatedBill?",
"Status"
],
"IAM Server Certificate": [
"New?",
"Tags",
"CertificateID",
"CertificateName"
],
"IAM Group": [
"New?",
"Tags",
"AccountName",
"AWSAccountID",
"GroupName",
"GroupId"
],
"IAM Role": [
"New?",
"Tags",
"RoleID",
"RoleName"
],
"IAM Policy": [
"New?",
"Tags",
"PolicyID",
"PolicyName"
],
"IAM User": [
"New?",
"Tags",
"AccountName",
"AWSAccountID",
"UserId",
"UserName",
"MFAStatus"
],
"Aggregator": [
"New?",
"Tags",
"AggregatorName",
"Status",
"LastUpdate",
"AutoUpdate",
"Version"
],
"CloudHealth Agent": [
"New?",
"Tags",
"InstanceName",
"InstanceState",
"InstanceStatus",
"Cloud",
"AgentInstallDate",
"LastAgentUpload",
"LastAgentCheckin",
"AgentVersion",
"AgentStatus"
],
"Virtual Machine": [
"New?",
"Tags",
"VmName",
"ComputerName",
"PowerState",
"State",
"Caching",
"SubscriptionName",
"AzureSubscriptionID",
"ResourceGroupName",
"SizeName",
"RegionName",
"Deployment",
"OSDiskType",
"HybridBenefit",
"IsActive?",
"IsDerived?"
],
"Disk": [
"New?",
"Tags",
"DiskName",
"AccountType",
"OSType",
"DiskType",
"DiskSizeGb",
"VmName",
"SubscriptionName",
"ResourceGroupName",
"Deployment",
"IsActive?",
"IsDerived?"
],
"Azure IP Address": [
"New?",
"Tags",
"IPAddressName",
"IPAddress",
"AllocationMethod",
"SubscriptionName",
"ResourceGroupName",
"Deployment",
"IsActive?",
"IsDerived?"
],
"Resource Group": [
"New?",
"Tags",
"ResourceGroupName",
"SubscriptionName",
"RegionName",
"IsActive?",
"IsDerived?"
],
"Azure SQL Server Firewall Rules": [
"New?",
"Tags",
"SQLServerFirewallRuleName",
"ServerName",
"Kind",
"StartIPAddress",
"IsActive?"
],
"Azure SQL Server": [
"New?",
"Tags",
"ServerName",
"DomainName",
"Version",
"State",
"AdministratorName",
"DatabaseCount",
"SubscriptionName",
"ResourceGroupName",
"IsDerived?",
"IsActive?"
],
"SQL Server Vulnerability Assessment": [
"New?",
"Tags",
"SQLServerVulnerabilityAssessmentName",
"ServerName",
"IsActive?"
],
"Azure Active Directory": [
"New?",
"Tags",
"ActiveDirectoryUserName",
"IsActive?",
"UserPrincipalName",
"UserType"
],
"Storage Account": [
"New?",
"Tags",
"StorageName",
"Kind",
"Performance",
"Replication",
"PrimaryStatus",
"Created",
"SubscriptionName",
"ResourceGroupName",
"Deployment",
"IsActive?",
"IsDerived?"
],
"Batch Account": [
"New?",
"Tags",
"BatchAccountName",
"AccountEndpoint",
"State",
"AutoStorage",
"CoreQuota",
"PoolQuota",
"ActiveJobAndScheduleQuota",
"SubscriptionName",
"ResourceGroupName",
"Deployment",
"IsActive?",
"IsDerived?"
],
"Snapshot": [
"New?",
"Tags",
"SnapshotName",
"AccountType",
"TimeCreated",
"OsType",
"DiskSizeGb",
"OwnerId",
"ProvisioningState",
"SubscriptionName",
"ResourceGroupName",
"Deployment",
"IsActive?",
"IsDerived?"
],
"Virtual Machine Scale Set": [
"New?",
"Tags",
"ScaleSetName",
"VMCount",
"SKUName",
"SubscriptionName",
"ResourceGroupName",
"IsActive?",
"IsDerived?"
],
"Redis Cache": [
"New?",
"Tags",
"CacheName",
"ProvisioningState",
"RedisVersion",
"SKUName",
"SKUFamily",
"SKUCapacity",
"CacheLocation",
"Accessiblevianon-ssl",
"RedisConfig",
"ShardCount",
"HostName",
"Port",
"SSLPort",
"SubscriptionName",
"ResourceGroupName",
"Deployment",
"IsActive?",
"IsDerived?"
],
"Search Service": [
"New?",
"Tags",
"SearchServiceName",
"ReplicaCount",
"PartitionCount",
"HostingMode",
"Status",
"StatusDetail",
"ProvisioningState",
"Name",
"SubscriptionName",
"ResourceGroupName",
"Deployment",
"IsActive?",
"IsDerived?"
],
"SQL Server Database": [
"New?",
"Tags",
"SQLDatabaseName",
"DatabaseID",
"ServerName",
"Status",
"ServiceTier",
"Collation",
"PerformanceLevel",
"SubscriptionName",
"ResourceGroupName",
"IsDerived?",
"IsActive?"
],
"SQL Data Warehouse": [
"New?",
"Tags",
"SQLDataWarehouseName",
"Status",
"DatabaseID",
"Collation",
"MaxSize.",
"SecondaryRegion",
"SubscriptionName",
"ResourceGroupName",
"IsActive?",
"IsDerived?"
],
"HDInsight Cluster": [
"New?",
"Tags",
"HDInsightClusterName",
"State",
"ClusterState",
"ClusterVersion",
"OperatingSystem",
"Tier",
"SubscriptionName",
"ResourceGroupName",
"Deployment",
"IsActive?",
"IsDerived?"
],
"Log Analytics Workspace": [
"New?",
"Tags",
"LogAnalyticsWorkspaceName",
"State",
"Source",
"CustomerId",
"Name",
"SubscriptionName",
"ResourceGroupName",
"Deployment",
"IsActive?",
"IsDerived?"
],
"CDN Profile": [
"New?",
"Tags",
"CDNProfileName",
"State",
"ResourceState",
"Name",
"SubscriptionName",
"ResourceGroupName",
"Deployment",
"IsActive?",
"IsDerived?"
],
"Express Route Circuit": [
"New?",
"Tags",
"ExpressRouteCircuitName",
"AllowClassicOperation",
"CircuitProvisioningState",
"ServiceProviderProvisioningState",
"ServiceKey",
"ServiceProviderNote",
"State",
"Name",
"Tier",
"Family",
"SubscriptionName",
"ResourceGroupName",
"Deployment",
"IsActive?",
"IsDerived?"
],
"Network Interface": [
"New?",
"Tags",
"NetworkInterfaceName",
"MacAddress",
"Primary",
"EnableAcceleratedNetworking",
"EnableIpForwarding",
"ResourceGuid",
"State",
"SubscriptionName",
"ResourceGroupName",
"VmName",
"SecurityGroupName",
"Deployment",
"IsActive?"
],
"Virtual Network Gateway": [
"New?",
"Tags",
"VirtualNetworkGatewaysName",
"GatewayType",
"GatewaySize",
"VirtualIPAddress",
"BGPEnabled",
"VPNClientAddressPool",
"SubscriptionName",
"ResourceGroupName",
"Deployment",
"IsActive?",
"IsDerived?"
],
"Virtual Network": [
"New?",
"Tags",
"VirtualNetworkName",
"SubscriptionName",
"ResourceGroupName",
"Deployment",
"IsActive?",
"IsDerived?"
],
"Service Bus Namespace": [
"New?",
"Tags",
"ServiceBusNamespaceName",
"ServiceBusEndpoint",
"Status",
"State",
"Enabled",
"Name",
"Tier",
"Capacity",
"CreateAcsNamespace",
"SubscriptionName",
"ResourceGroupName",
"Deployment",
"IsActive?",
"IsDerived?"
],
"Recovery Service Vault": [
"New?",
"Tags",
"RecoveryServicesVaultName",
"Name",
"State",
"SubscriptionName",
"ResourceGroupName",
"Deployment",
"IsActive?",
"IsDerived?"
],
"StorSimple Device Manager": [
"New?",
"Tags",
"StorSimpleDeviceManagerName",
"State",
"SkuName",
"SubscriptionName",
"ResourceGroupName",
"Deployment",
"IsActive?",
"IsDerived?"
],
"App Service Plan": [
"New?",
"Tags",
"AppServicePlan",
"Status",
"MaxWorkers",
"SubscriptionName",
"ResourceGroupName",
"Active?",
"Derived?"
],
"App Service": [
"New?",
"Tags",
"AppServiceName",
"Owner",
"Kind",
"DefaultHostName",
"SubscriptionName",
"ResourceGroupName",
"Deployment",
"IsActive?",
"IsDerived?"
],
"Cosmos DB": [
"New?",
"Tags",
"CosmosDBName",
"State",
"DocumentEndpoint",
"DatabaseAccountOfferType",
"IpRangeFilter",
"EnableAutomaticFailover",
"SubscriptionName",
"ResourceGroupName",
"Deployment",
"IsActive?",
"IsDerived?"
],
"Key Vault": [
"New?",
"Tags",
"KeyVaultName",
"SKUName",
"SKUFamily",
"EnabledForDeployment",
"EnabledForDiskEncryption",
"EnabledForTemplateDeployment",
"TenantId",
"VaultUri",
"SubscriptionName",
"ResourceGroupName",
"Deployment",
"IsActive?",
"IsDerived?"
],
"Key Vault Key": [
"New?",
"Tags",
"KeyVaultKeyName",
"KeyVaultName",
"Enabled?",
"RecoveryLevel",
"KeyCreated",
"KeyUpdated"
],
"Key Vault Secret": [
"New?",
"Tags",
"KeyVaultSecretName",
"KeyVaultName",
"Enabled?",
"RecoveryLevel",
"SecretCreated",
"SecretUpdated"
],
"Application Gateway": [
"New?",
"Tags",
"ApplicationGatewayName",
"ProvisioningState",
"ResourceGuid",
"SKUName",
"SKUTier",
"Capacity",
"SubscriptionName",
"ResourceGroupName",
"Deployment",
"IsActive?",
"IsDerived?"
],
"App Service Environment": [
"New?",
"Tags",
"AppServiceEnvironment",
"Status",
"IsEnvironmentHealthy",
"EnvironmentStatus",
"IsSuspended",
"SubscriptionName",
"ResourceGroupName",
"Deployment",
"IsActive?",
"IsDerived?"
],
"Reservation Order": [
"New?",
"Tags",
"ReservationOrderName",
"Name",
"RequestDate",
"CreatedDate",
"Quantity",
"IsActive?",
"Derived?"
],
"Reservation": [
"New?",
"Tags",
"ReservationName",
"Renew?",
"AppliedScopeType",
"Quantity",
"ProvisioningState",
"ExpiryDate",
"BillingPlan",
"EffectiveDate",
"ReservedResourceType",
"InstanceFlexibility",
"SKUDescription",
"SubscriptionName",
"Deployment",
"IsActive?",
"IsDerived?"
],
"Log Profile": [
"New?",
"Tags",
"LogProfileName",
"RetentionPolicyEnabled?",
"RetentionPolicyDays",
"SubscriptionName",
"Deployment",
"IsActive?"
],
"Azure Subscription": [
"New?",
"Tags",
"SubscriptionName",
"AzureSubscriptionID",
"EnrollmentName",
"AzureState",
"QuotaType",
"IsActive?",
"IsDerived?",
"Ignored?"
],
"Activity Log Alert": [
"New?",
"Tags",
"ActivityLogAlertName",
"IsEnabled?",
"Description",
"SubscriptionName",
"ResourceGroupName",
"IsActive?"
],
"Kubernetes Service": [
"New?",
"Tags",
"KubernetesServiceName",
"ResourceGroupName",
"EnableRBAC",
"ProvisioningState",
"Deployment",
"Version"
],
"SQL Managed Instance": [
"New?",
"Tags",
"SQLManagedInstanceName",
"ResourceID",
"SubscriptionName",
"SKUName",
"State",
"IsActive?"
],
"PostgreSQL Server": [
"New?",
"Tags",
"PostgreSQLServer",
"SubscriptionName",
"ResourceGroupName",
"IsActive?",
"Derived?"
],
"Billing Account": [
"New?",
"Tags",
"BillingAccountName",
"AccountId",
"AccountStatus",
"AccountType",
"AgreementType",
"AzureOrganizationId",
"IsActive?",
"IsDerived?"
],
"Billing Profile": [
"New?",
"Tags",
"BillingProfileName",
"DisplayName",
"Currency",
"InvoiceDay",
"IsActive?",
"IsDerived?"
],
"Invoice Section": [
"New?",
"Tags",
"InvoiceSectionName",
"DisplayName",
"IsActive?",
"IsDerived?"
],
"Application Insight": [
"New?",
"Tags",
"ApplicationInsightName",
"ApplicationId",
"AppId",
"ApplicationType",
"FlowType",
"RequestSource",
"InstrumentationKey",
"CreationDate",
"TenantId",
"HockeyAppId",
"HockeyAppToken",
"ProvisioningState",
"SamplingPercentage",
"SubscriptionName",
"ResourceGroupName",
"Deployment",
"IsActive?",
"IsDerived?"
],
"Azure Enrollment": [
"New?",
"Tags",
"EnrollmentName",
"EnrollmentID",
"Status",
"SubscriptionStatus",
"AccessKeyExpirationDate",
"CreatedAt",
"ServicePrincipalID"
],
"Azure Service Principal": [
"New?",
"Tags",
"ServicePrincipalName",
"Type",
"TenantID",
"ApplicationID",
"Status",
"FirstDiscovered"
],
"Storage Blob Container": [
"New?",
"Tags",
"StorageBlobContainerName",
"PublicAccess",
"LeaseStatus",
"LeaseState",
"LastModifiedTime",
"HasImmutabilityPolicy?",
"Haslegalhold?",
"IsActive?"
],
"Azure Active Directory Role": [
"New?",
"Tags",
"ActiveDirectoryRoleDefinitionName",
"IsActive?"
],
"SQL Server Auditing": [
"New?",
"Tags",
"SQLServerAuditingName",
"ServerName",
"State",
"StorageEndpoint",
"IsActive?"
],
"SQL Server Threat Detection": [
"New?",
"Tags",
"SQLServerThreatDetectionName",
"ServerName",
"State",
"IsActive?"
],
"SQL Database Threat Detection": [
"New?",
"Tags",
"SQLDatabaseThreatDetectionName",
"SQLDatabaseName",
"State",
"IsActive?"
],
"SQL Database Auditing": [
"New?",
"Tags",
"SQLDatabaseAuditingName",
"SQLDatabaseName",
"State",
"StorageEndpoint",
"IsActive?"
],
"Subscription Security Policy": [
"New?",
"Tags",
"SubscriptionSecurityPolicyName",
"SubscriptionName",
"LogCollection?",
"IsActive?"
],
"Azure Security Group": [
"New?",
"Tags",
"SecurityGroupName",
"ProvisioningState",
"SubscriptionName",
"ResourceGroupName",
"Deployment",
"IsActive?"
],
"IoT Hub": [
"New?",
"Tags",
"IoTHubsName",
"Type",
"State",
"HostName",
"SKUName",
"Tier",
"Capacity",
"Connections",
"DeviceTelemetry",
"C2DCommands",
"DeviceIdentityOperations",
"FileUploadOperations",
"Routes",
"IsActive?",
"IsDerived?"
],
"Event Hub Namespace": [
"New?",
"Tags",
"EventHubNamespaceName",
"SKUName",
"Tier",
"Capacity",
"ProvisioningState",
"IsActive?",
"IsDerived?"
],
"Event Hub": [
"New?",
"Tags",
"EventHubsName",
"MessageRetention(indays)",
"PartitionCount",
"Status",
"Interval(inseconds)",
"SizeLimit(inbytes)",
"IsActive?",
"IsDerived?"
],
"Databricks Workspace": [
"New?",
"Tags",
"DatabricksWorkspace",
"PricingTier",
"SubscriptionName",
"ResourceGroupName",
"IsActive?",
"Derived?"
],
"PostgreSQL Server Firewall Rules": [
"New?",
"Tags",
"PostgreSQLServerFirewallRule",
"ResourceID",
"SubscriptionName",
"IsActive?"
],
"Mysql Server": [
"New?",
"Tags",
"MySQLServer",
"SubscriptionName",
"ResourceGroupName",
"IsActive?",
"Derived?"
],
"Availability Set": [
"New?",
"Tags",
"SubscriptionName",
"AzureComputeAvailabilitySet.name",
"ID",
"PlatformUpdateDomainCount",
"PlatformFaultDomainCount",
"IsActive?",
"Derived?"
],
"Container Registry": [
"New?",
"Tags",
"Name",
"SubscriptionName",
"LoginServer",
"CreationDate",
"SKUName",
"SKUTier",
"ProvisioningState",
"CreatedBy",
"CreatedByType",
"CreatedAt",
"LastModifiedBy",
"LastModifiedByType",
"LastModifiedAt",
"IdentityType",
"IsActive?"
],
"Azure Anomaly": [
"New?",
"Tags",
"StartDate",
"Duration",
"SubscriptionName",
"SubscriptionId",
"Service",
"Region",
"CostImpact",
"CostImpactPercentage",
"CostImpactType",
"Cost",
"Status"
],
"Azure Partner Center": [
"New?",
"Tags",
"PartnerCenterName",
"Domain",
"Status",
"FirstDiscovered"
],
"Azure AVS Cluster": [
"New?",
"Tags",
"Name",
"SubscriptionName",
"ClusterType",
"ClusterSKUName",
"AVSClusterSize",
"AVSClusterID",
"AVSClusterProvisioningState",
"VMRestrictMovement",
"IsActive"
],
"Azure AVS Datastore": [
"New?",
"Tags",
"Name",
"SubscriptionName",
"DatastoreType",
"DiskPoolVolumeID",
"DiskPoolVolumeLunName",
"DiskPoolVolumePath",
"DiskPoolVolumeMountOption",
"NetAppVolumeID",
"AVSDBProvisioningState",
"DatastoreStatus",
"IsActive"
],
"Azure AVS Virtual Machine": [
"New?",
"Tags",
"Name",
"SubscriptionName",
"VirtualMachineType",
"VMDisplayName",
"VMMOReferenceID",
"VMFolderPath",
"VMRestrictMovement",
"IsActive"
],
"Machines": [
"New?",
"Tags",
"AccountName",
"MachineName",
"Virtual?",
"Platform",
"ProcessorCoreCount",
"Memory(GB)",
"Disk(GB)",
"DailyCost",
"CostBasis"
],
"Other Accounts": [
"New?",
"Tags",
"AccountName",
"Description",
"CreatedAt",
"vCenterStatus"
],
"VMware Account": [
"New?",
"Tags",
"AccountServer",
"Username",
"CreatedAt"
],
"Compute Instance": [
"New?",
"Tags",
"ProjectFriendlyName",
"InstanceName",
"MachineType",
"Zone",
"Status",
"CreationDate",
"Enhancements"
],
"Dataproc Cluster": [
"New?",
"Tags",
"ClusterName",
"ProjectFriendlyName",
"State",
"ClusterMode",
"Region",
"CreationDate"
],
"GKE Cluster": [
"New?",
"Tags",
"ClusterName",
"ProjectFriendlyName",
"State",
"Location",
"CreationDate",
"CurrentNodeCount",
"CurrentMasterVersion"
],
"Compute Static IP": [
"New?",
"Tags",
"StaticIPName",
"ProjectFriendlyName",
"State",
"Address",
"Region",
"CreationDate"
],
"Compute Image": [
"New?",
"Tags",
"ProjectFriendlyName",
"ImageName",
"Status",
"DiskSize(GB)",
"CreationDate"
],
"Compute Snapshot": [
"New?",
"Tags",
"ProjectFriendlyName",
"SnapshotName",
"Status",
"Size(GB)",
"CreationDate"
],
"Compute Disk": [
"New?",
"Tags",
"ProjectFriendlyName",
"Zone",
"DiskName",
"DiskType",
"Size(GB)",
"Status",
"FirstDiscovered"
],
"Google Project": [
"New?",
"Tags",
"ProjectFriendlyName",
"ProjectId",
"ProjectNumber",
"Status",
"CreatedAt"
],
"GCP Anomaly": [
"New?",
"Tags",
"StartDate",
"Duration",
"ProjectName",
"ProjectId",
"CloudProduct",
"Region",
"CostImpact",
"CostImpactPercentage",
"CostImpactType",
"Cost",
"Status"
],
"Cloud Run Service": [
"New?",
"Tags",
"ProjectFriendlyName",
"Name",
"Region",
"IngressStatus",
"ApiVersion",
"Kind",
"MetadataName",
"MetadataNamespace",
"MetadataGeneration",
"StatusURL"
],
"Committed Use Discount": [
"New?",
"Tags",
"ProjectFriendlyName",
"CommitmentName",
"Region",
"Status",
"Term",
"StartDate",
"EndDate",
"vCPUAmount",
"LocalSSDAmount",
"GPUAmount",
"MemoryAmount"
],
"DNS Managed Zone": [
"New?",
"Tags",
"ProjectFriendlyName",
"Region",
"ManagedZoneName",
"DNSName",
"NameServers",
"CreationTime",
"Visibility"
],
"App Engine Application": [
"New?",
"Tags",
"ProjectFriendlyName",
"ApplicationID",
"Name",
"DefaultHostname",
"Region",
"GCRDomain",
"DatabaseType",
"AuthDomain",
"OAuth2ClientID",
"Enabled",
"ServingStatus",
"DefaultCookieExpiration"
],
"Instance Group": [
"New?",
"Tags",
"ProjectFriendlyName",
"InstanceGroupName",
"Region",
"Zone",
"CreationTimestamp",
"Numberofinstances",
"ResourceType",
"Description",
"SelfLink",
"IsActive?"
],
"Compute VPN Gateway": [
"New?",
"Tags",
"ProjectFriendlyName",
"Region",
"VPNGatewayName",
"StackType",
"Network",
"SelfLink",
"Description"
],
"Bigtable Instance": [
"New?",
"Tags",
"ProjectFriendlyName",
"BigtableInstanceName",
"DisplayName",
"State",
"Type"
],
"Bigtable Cluster": [
"New?",
"Tags",
"ProjectFriendlyName",
"BigtableClusterName",
"ServeNode",
"State",
"DefaultStorageType"
],
"Bigtable Backup": [
"New?",
"Tags",
"ProjectFriendlyName",
"BackupName",
"BackupSourceTable",
"BackupSizeInBytes",
"BackupState",
"BackupStartTime",
"BackupEndTime",
"BackupExpireTime",
"IsActive?"
],
"Bigtable Table": [
"New?",
"Tags",
"ProjectFriendlyName",
"TableName",
"TableBackupName",
"TableBackupStartTime",
"TableBackupEndTime",
"RestoreSourceType",
"Granularity",
"IsActive?"
],
"Cloud Router": [
"New?",
"Tags",
"ProjectFriendlyName",
"Region",
"RouterName",
"EncryptedInterconnectRouter",
"AdvertiseMode",
"AdvertisedGroups",
"BGPASN",
"SelfLink",
"Description"
],
"Secret Manager Secret": [
"New?",
"Tags",
"ProjectFriendlyName",
"Region",
"SecretName",
"CreateTime",
"ExpireTime",
"TTL",
"SecretReplicas",
"ResourceID"
],
"Secret Manager Secret Version": [
"New?",
"Tags",
"ProjectFriendlyName",
"Region",
"SecretName",
"SecretVersionName",
"CreateTime",
"DestroyTime",
"State",
"SecretVersionReplicas"
],
"KeyRing": [
"New?",
"Tags",
"ProjectFriendlyName",
"KeyRingName",
"Region"
],
"CryptoKey": [
"New?",
"Tags",
"ProjectFriendlyName",
"CryptoKeyName",
"Region",
"PrimaryName",
"PrimaryState",
"CreateTime"
],
"CryptoKey Version": [
"New?",
"Tags",
"ProjectFriendlyName",
"CryptoKeyVersionName",
"State",
"CreateTime"
],
"BigQuery Table": [
"New?",
"Tags",
"TableID",
"ProjectFriendlyName",
"CreateTime",
"LastModifiedTime",
"ExpirationTime",
"Region",
"Description",
"TableType"
],
"BigQuery Dataset": [
"New?",
"Tags",
"DatasetID",
"ProjectFriendlyName",
"DefaultTableExpirationTime",
"SatisfiesPzs",
"Region",
"CreationTime",
"LastUpdateTime",
"Description"
],
"SQL Database Instance": [
"New?",
"Tags",
"Name",
"ProjectFriendlyName",
"Region",
"PublicIPAddress",
"PrivateIPAddress",
"PricingPlan",
"Tier",
"LocationPreferenceZone",
"DatabaseVersion",
"BackendType",
"State",
"MaintenanceWindowUpdateTrack",
"ActivationPolicy"
],
"App Engine Service": [
"New?",
"Tags",
"ProjectFriendlyName",
"Region",
"Name",
"ShardBy",
"IngressTrafficAllowed"
],
"App Engine Service Version": [
"New?",
"Tags",
"ProjectFriendlyName",
"Region",
"Name",
"ReadinessChkHost",
"CreatedBy",
"ServingStatus"
],
"Logging Log Bucket": [
"New?",
"Tags",
"ProjectFriendlyName",
"LogBucketName",
"Description",
"LifecycleState",
"RetentionDays",
"Region",
"CreateTime",
"UpdateTime"
],
"GCP Assets": [
"New?",
"Tags",
"Name",
"created_at",
"updated_at",
"GCPTaggableAsset"
],
"Amazon Assets": [
"New?",
"Tags",
"Name",
"name",
"AWSAccountID",
"created_at",
"updated_at",
"AWSTaggableAssetsonly"
],
"Azure Assets": [
"New?",
"Tags",
"Name",
"created_at",
"updated_at",
"AzureTaggableAsset(Doesnotgatherassociatedassets)"
]
}
Integrate with New Relic
Understand performance trends and requirements so that you can make good provisioning decisions.
The Tanzu CloudHealth platform does not integrate with the free version of New Relic, because the free version does not allow API access.
Why Integrate with New Relic
The Tanzu CloudHealth Platform integrates with the New Relic Infrastructure product with data access through the Insights API. Tanzu CloudHealth retrieves CPU, Memory, Disk usage, and Network I/O through the Insights API.
The New Relic integration gives you improved visibility across every dimension of your cloud environment. The resulting holistic view provides a better understanding of performance trends and requirements so that you can make good provisioning decisions.
Tanzu CloudHealth continues to support the legacy New Relic Servers product until its EOL.
Add New Relic Account
- From the menu, select Setup > Accounts > New Relic.
- Click New New Relic Account.
- Configure the account settings.
- Account Name: Type a name for the account.
- Account ID: Enter your 7-digit New Relic Account ID. For information on how to retrieve your Account ID, see New Relic documentation.
- API Key: Copy and paste your New Relic Insights API Query Key. For information on how to retrieve your API key, see New Relic documentation.
- Import Labels: Select whether labels should be imported.
This option is only applicable for legacy New Relic accounts.
| State | Effect |
|---|---|
On |
New Relic labels will be imported into Tanzu CloudHealth |
Off |
New Relic tags will not be imported |
4. Click Save Account.
- It can take up to one hour for host data to appear in Tanzu CloudHealth. Rightsizing and Metrics drilldowns can take up to 24 hours for collection and display in the Tanzu CloudHealth platform.
- New Relic labels that are imported into Tanzu CloudHealth can be used in perspectives and reports.
Data Collection
What data does the Tanzu CloudHealth platform collect
-
Tanzu CloudHealth collects new assets, in this case New Relic Hosts, on a 15 minute basis. These assets will have New Relic-specific information associated with them, such as:
- New Relic tags
- Whether or not the New Relic agent is installed on the instance
-
Tanzu CloudHealth collects new New Relic labels every 15 minutes and adds them to the New Relic Host.
-
Tanzu CloudHealth collects File Systems from Hosts running the New Relic agent.
A New Relic agent is required.
- Tanzu CloudHealth collects base performance metrics on an hourly basis. For each metric, Tanzu CloudHealth performs basic aggregation functions (average, minimum, maximum, sum) for the hour to ensure consistency of this data with other data sources.
Metrics Collection Table
The following metrics are collected from New Relic.
| Metric Family | Tanzu CloudHealth Metric | Tanzu CloudHealth Aggregation | New Relic Metrics |
|---|---|---|---|
| CPU | CPU % | avg, min, max | = system.cpu.system + system.cpu.user |
| File System | File System Size (GB) | avg, min, max | = system.disk.total |
| File System | File System Used (GB) | avg, min, max | = system.disk.used |
| File System | File System Used % | avg, min, max | = system.disk.used / system.disk.total * 100 |
| Memory | Memory Capacity (GB) | avg, min, max | = system.mem.used + system.mem.free |
| Memory | Memory Free (GB) | avg, min, max | = system.mem.free + system.mem.cached +system.mem.buffers |
| Memory | Memory Used % | avg, min, max | = system.mem.pct_usable |
| Network | Bytes received | avg, min, max | = system.net.bytes\rcvd |
| Network | Bytes sent | avg, min, max | = system.net.bytes\sent |
File System metrics is correlated to a File System and the New Relic Host/EC2 Instance.
New Relic Within the Tanzu CloudHealth Platform
Perspectives
New Relic tags can be used to create specific business asset grouping within Tanzu CloudHealth Perspectives. New Relic Hosts appear in the Choose An Asset Type dropdown, as well as specific New Relic fields including Console URL, Name, and tags pulled in from the New Relic Account.
Rightsizing
New Relic will pull in CPU, Memory, and Disk for instances and show them within the Rightsizing Report for each instance with a New Relic agent installed. New Relic CPU metrics will take priority over CloudWatch CPU metrics in this section as well. Also, if Tanzu CloudHealth detects New Relic agent running for a host, the platform will exclude CloudWatch CPU collection for that host.
Extra columns can be added within the Rightsizing Report as well for New Relic specific information. (See Screenshot Below)
Assets
Clicking the New Relic icon on this screen will open a browser tab to the New Relic console, displaying the performance dashboard for the host.
Once inside the Hosts menu, you can click into the Instance Name, and drill down into Performance. This will give you a detailed view of network performance in a multi-chart visualization.
You can also click on the New Relic console link and open the New Relic Dashboard for the corresponding instance.
Metrics Charts
Metrics pulled in from New Relic will be available for each instance within the Metrics report. When drilling into metrics charts for individual assets, Tanzu CloudHealth will show when the metrics source is coming from New Relic.
When drilling into metrics charts for individual assets Tanzu CloudHealth will show when the metrics source is coming from New Relic.
Integrate with Dynatrace
Why integrate with Dynatrace?
Dynatrace is a software-intelligence monitoring platform that simplifies enterprise cloud complexity and accelerates digital transformation. You can perform log monitoring and view information such as the total traffic of your network, the response time of your processes, and more. Tanzu CloudHealth retrieves Memory and Disk usage, and Network I/O through the Dynatrace REST API.
Currently the Dynatrace integration is supported only for the AWS EC2 instances and Azure VMs in the Tanzu CloudHealth platform.
Benefits of Dynatrace Integration
Tanzu CloudHealth ingests the usage and performance data that Dynatrace gathers to help you in the following ways:
- Get metrics either from managed or SaaS instances of Dynatrace.
- Get metrics from any ActiveGates connections that are used to connect into cloud providers for metrics.
- Understand how your cloud assets are being allocated and utilized through usage reports
- Make rightsizing decisions for EC2 Instances and Azure VMs.
Connect Dynatrace Account
- From the menu, select Accounts > Setup > Dynatrace, and click Add Account.
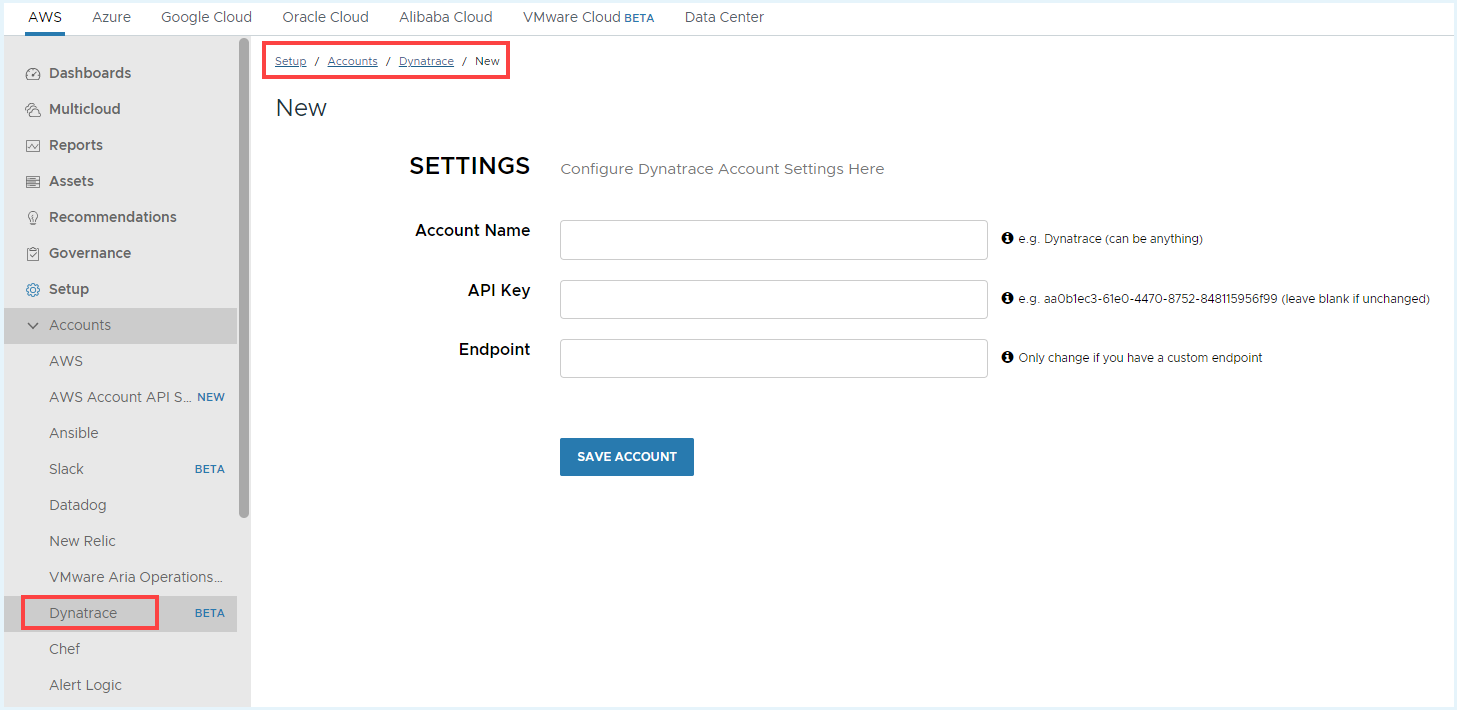
- Configure the account settings.
- Account Name
- API Key – Create Personal Access Token in Dynatrace with
oneAgents.read,metrics.readandentities.readas scope. For information on how to create personal access tokens, see Dynatrace documentation. - Endpoint – Add your Dynatrace SaaS/Managed Environment ID. For more information, see Dynatrace documentation.
- Click Save Account.
Note It can take up to one hour for host data to appear in the Tanzu CloudHealth platform. Rightsizing and Metrics drilldowns can take up to 24 hours for collection and display in the Tanzu CloudHealth platform.
The Dynatrace account will appear on the Tanzu CloudHealth platform Dynatrace page.
What data does the Tanzu CloudHealth platform collect?
Tanzu CloudHealth platform collects new assets, in this case Dynatrace Hosts, on a 15-minute basis. These assets will have Dynatrace-specific information associated with them, such as:
- Whether or not the Dynatrace agent is installed on the instance.
- Tanzu CloudHealth platform collects File Systems from Hosts running the Dynatrace agent. Note that a Dynatrace agent is required.
- Tanzu CloudHealth platform collects base performance metrics on an hourly basis. For each metric, Tanzu CloudHealth performs basic aggregation functions (average, minimum, maximum, sum) for the hour to ensure consistency of this data with other data sources.
NoteTanzu CloudHealth retrieves Memory and Disk usage for AWS EC2 Instance and Azure VM, both, and fetches Network I/O only for Azure VM through the Dynatrace REST API.
Metrics Collection Table
The following metrics are collected from Dynatrace.
| Metric Family | Tanzu CloudHealth Metric | Tanzu CloudHealth Aggregation | Dynatrace Metrics |
|---|---|---|---|
| File System | File System Size (GB) | avg, min, max | builtin:host.disk.avail + builtin:host.disk.used |
| File System | File System Used (GB) | avg, min, max | builtin:host.disk.used |
| File System | File System Used % | avg, min, max | builtin:host.disk.usedPct |
| Memory | Memory Total | avg, min, max | builtin:host.mem.total |
| Memory | Memory Free | avg, min, max | builtin:host.mem.avail.bytes |
| Memory | Memory Used % | avg, min, max | builtin:host.mem.usage |
| Network | Bytes received | avg, min, max | builtin:host.net.nic.bytesRx |
| Network | Bytes sent | avg, min, max | builtin:host.net.nic.bytesTx |
| Network | PacketsReceivedRate | avg, min, max | builtin:host.net.nic.packets.rx |
| Network | PacketsSentRate | avg, min, max | builtin:host.net.nic.packets.tx |
Dynatrace Within the Tanzu CloudHealth Platform
Rightsizing
- Dynatrace will pull in Memory and Disk for instances and show them within the Rightsizing Report for each instance with a Dynatrace agent installed.
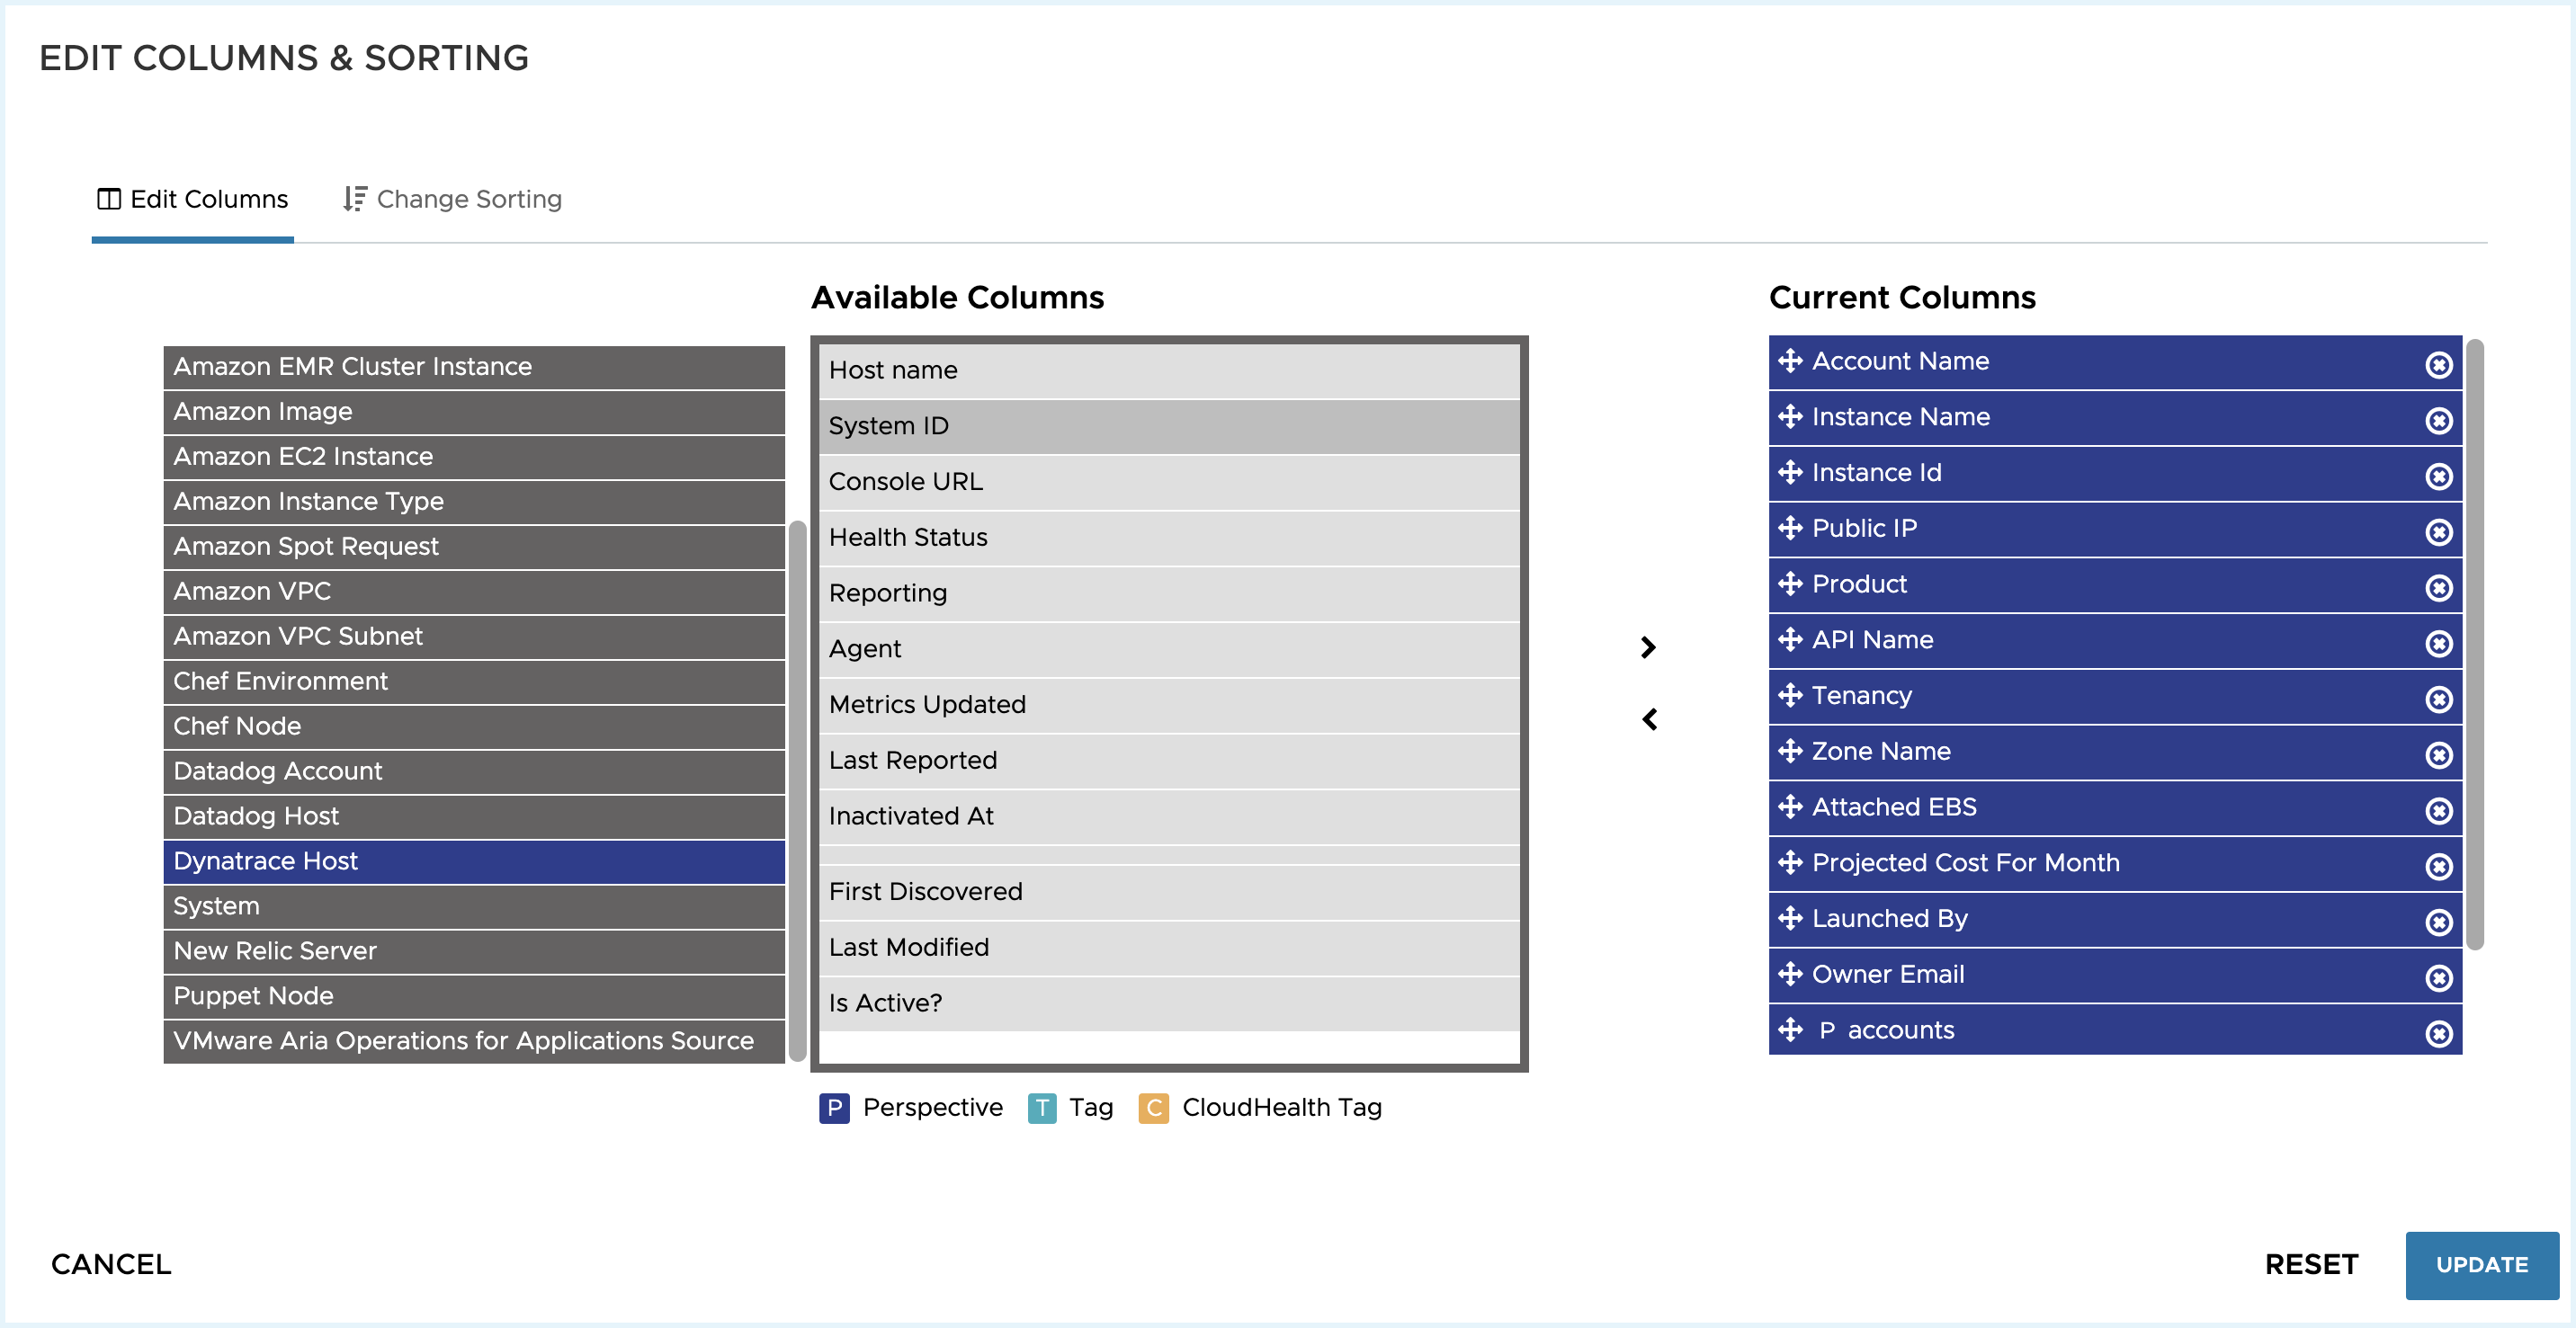
- You can add extra columns within the classic Rightsizing report to view the Dynatrace specific information.
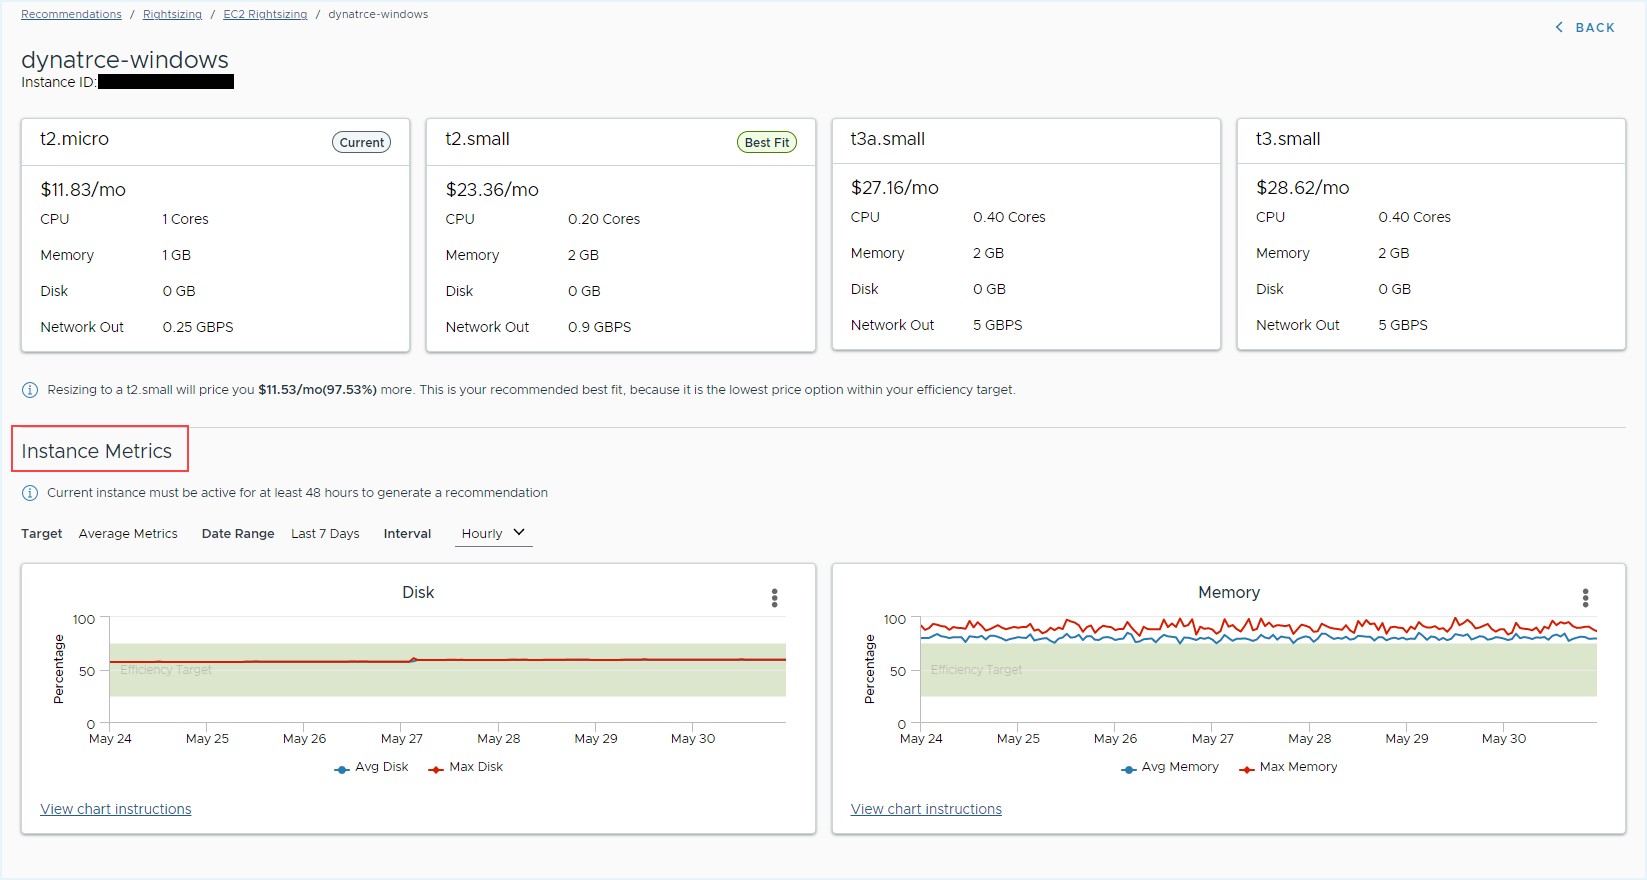
- In the Rightsizing (New), click the instance name to view the Memory and Disk recommendations for instances.
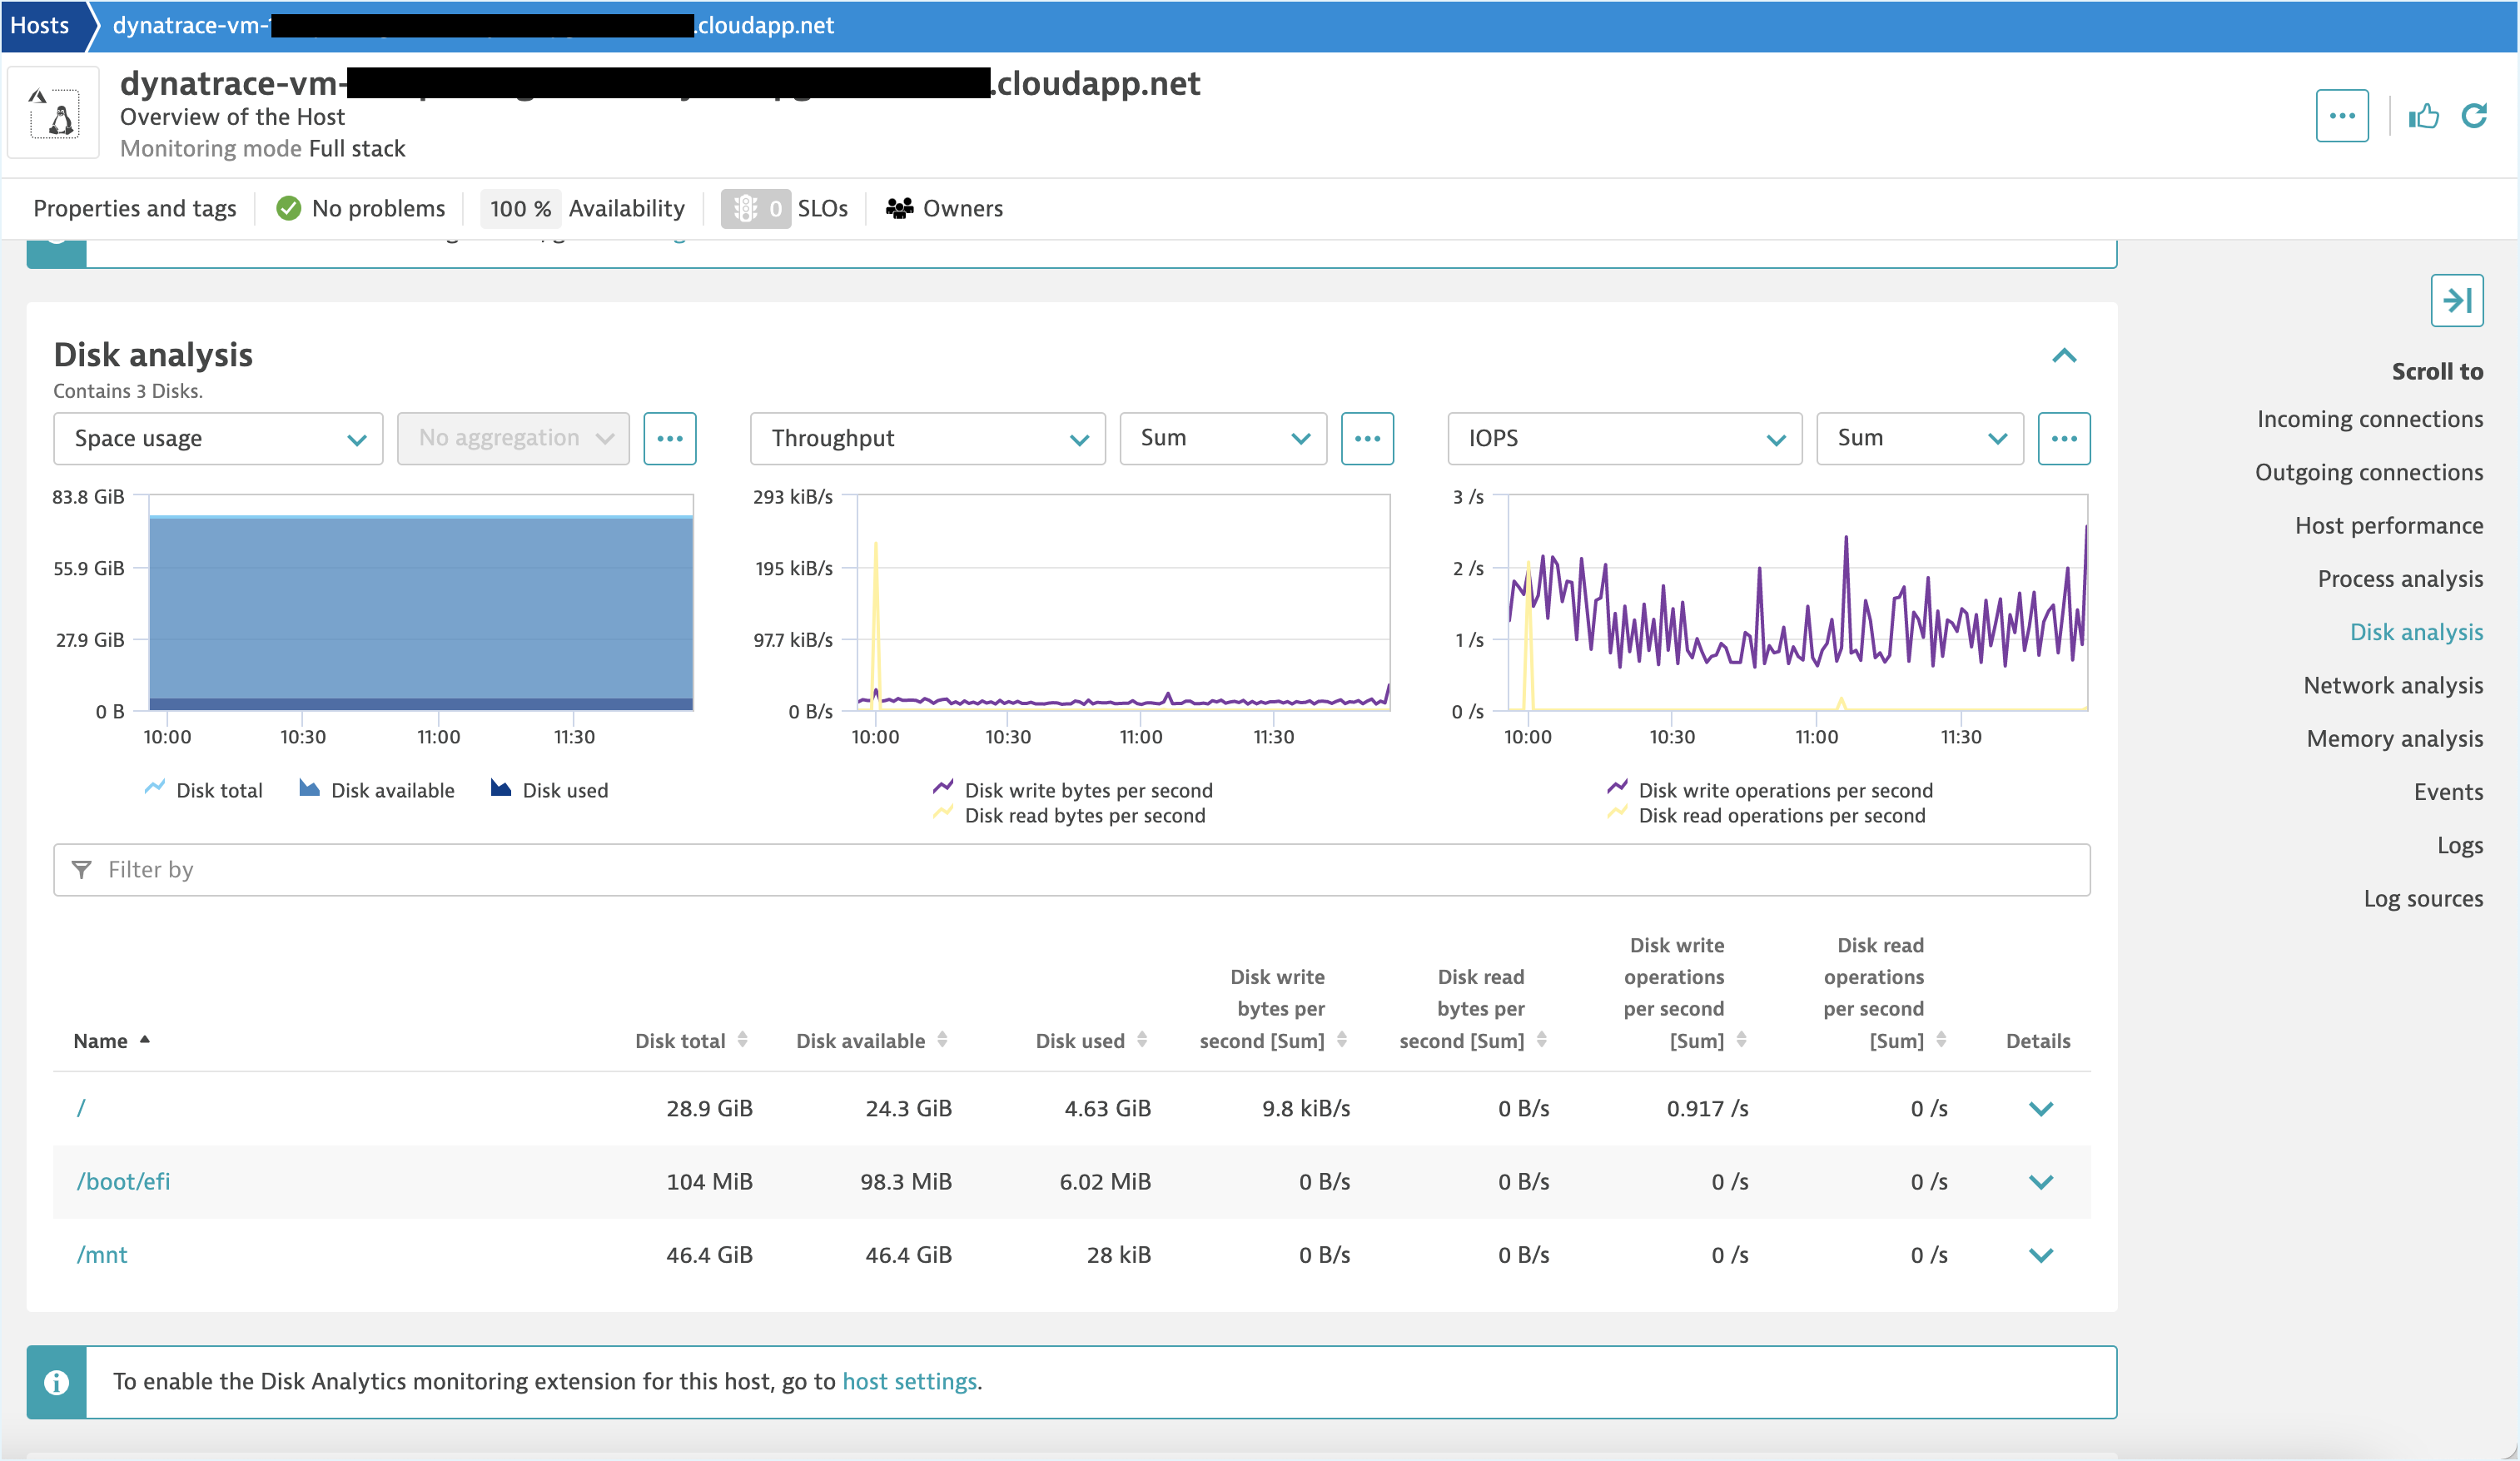
Assets
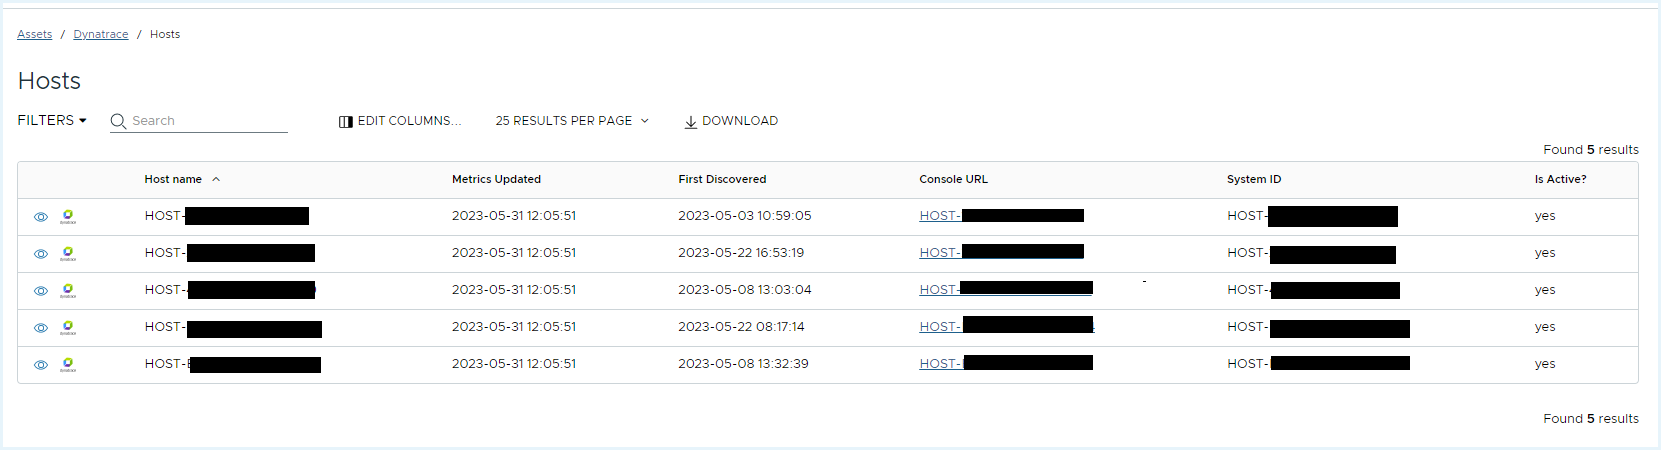
- To check the Dynatrace Host details, go to Assets > Dynatrace > Hosts.
 .
.
- Click Edit Columns to add/remove columns in the table.
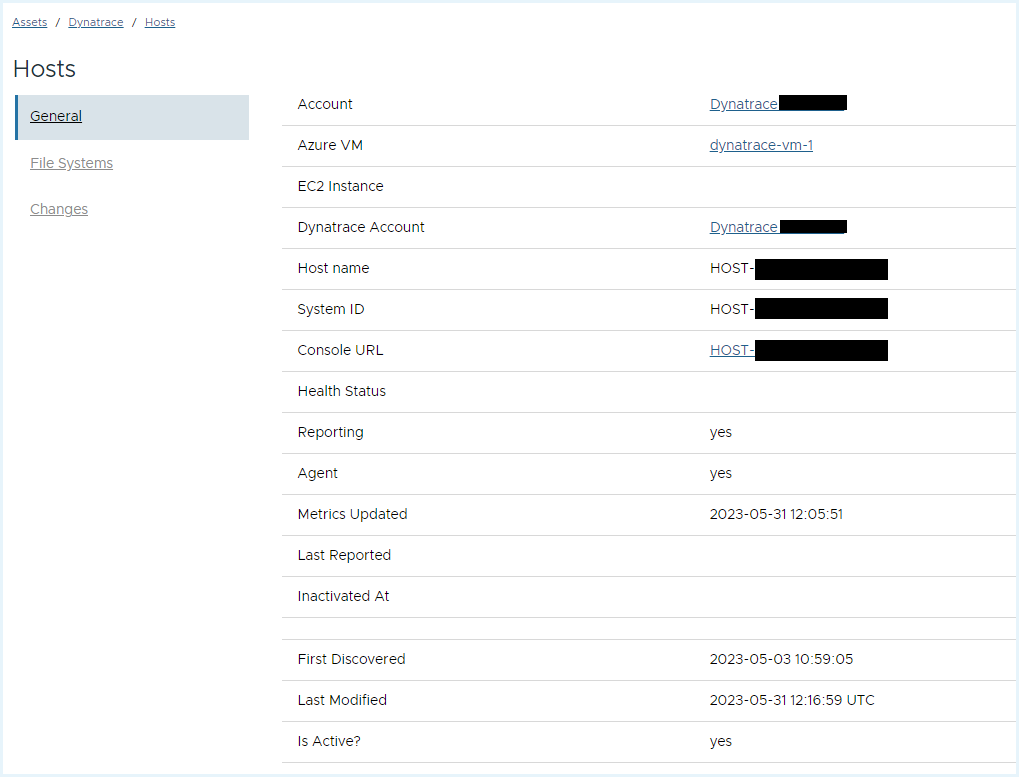
- Click the view icon to view the Dynatrace host details.
 .
.
- Clicking the Dynatrace Console URL opens the Dynatrace dashboard for the corresponding host.
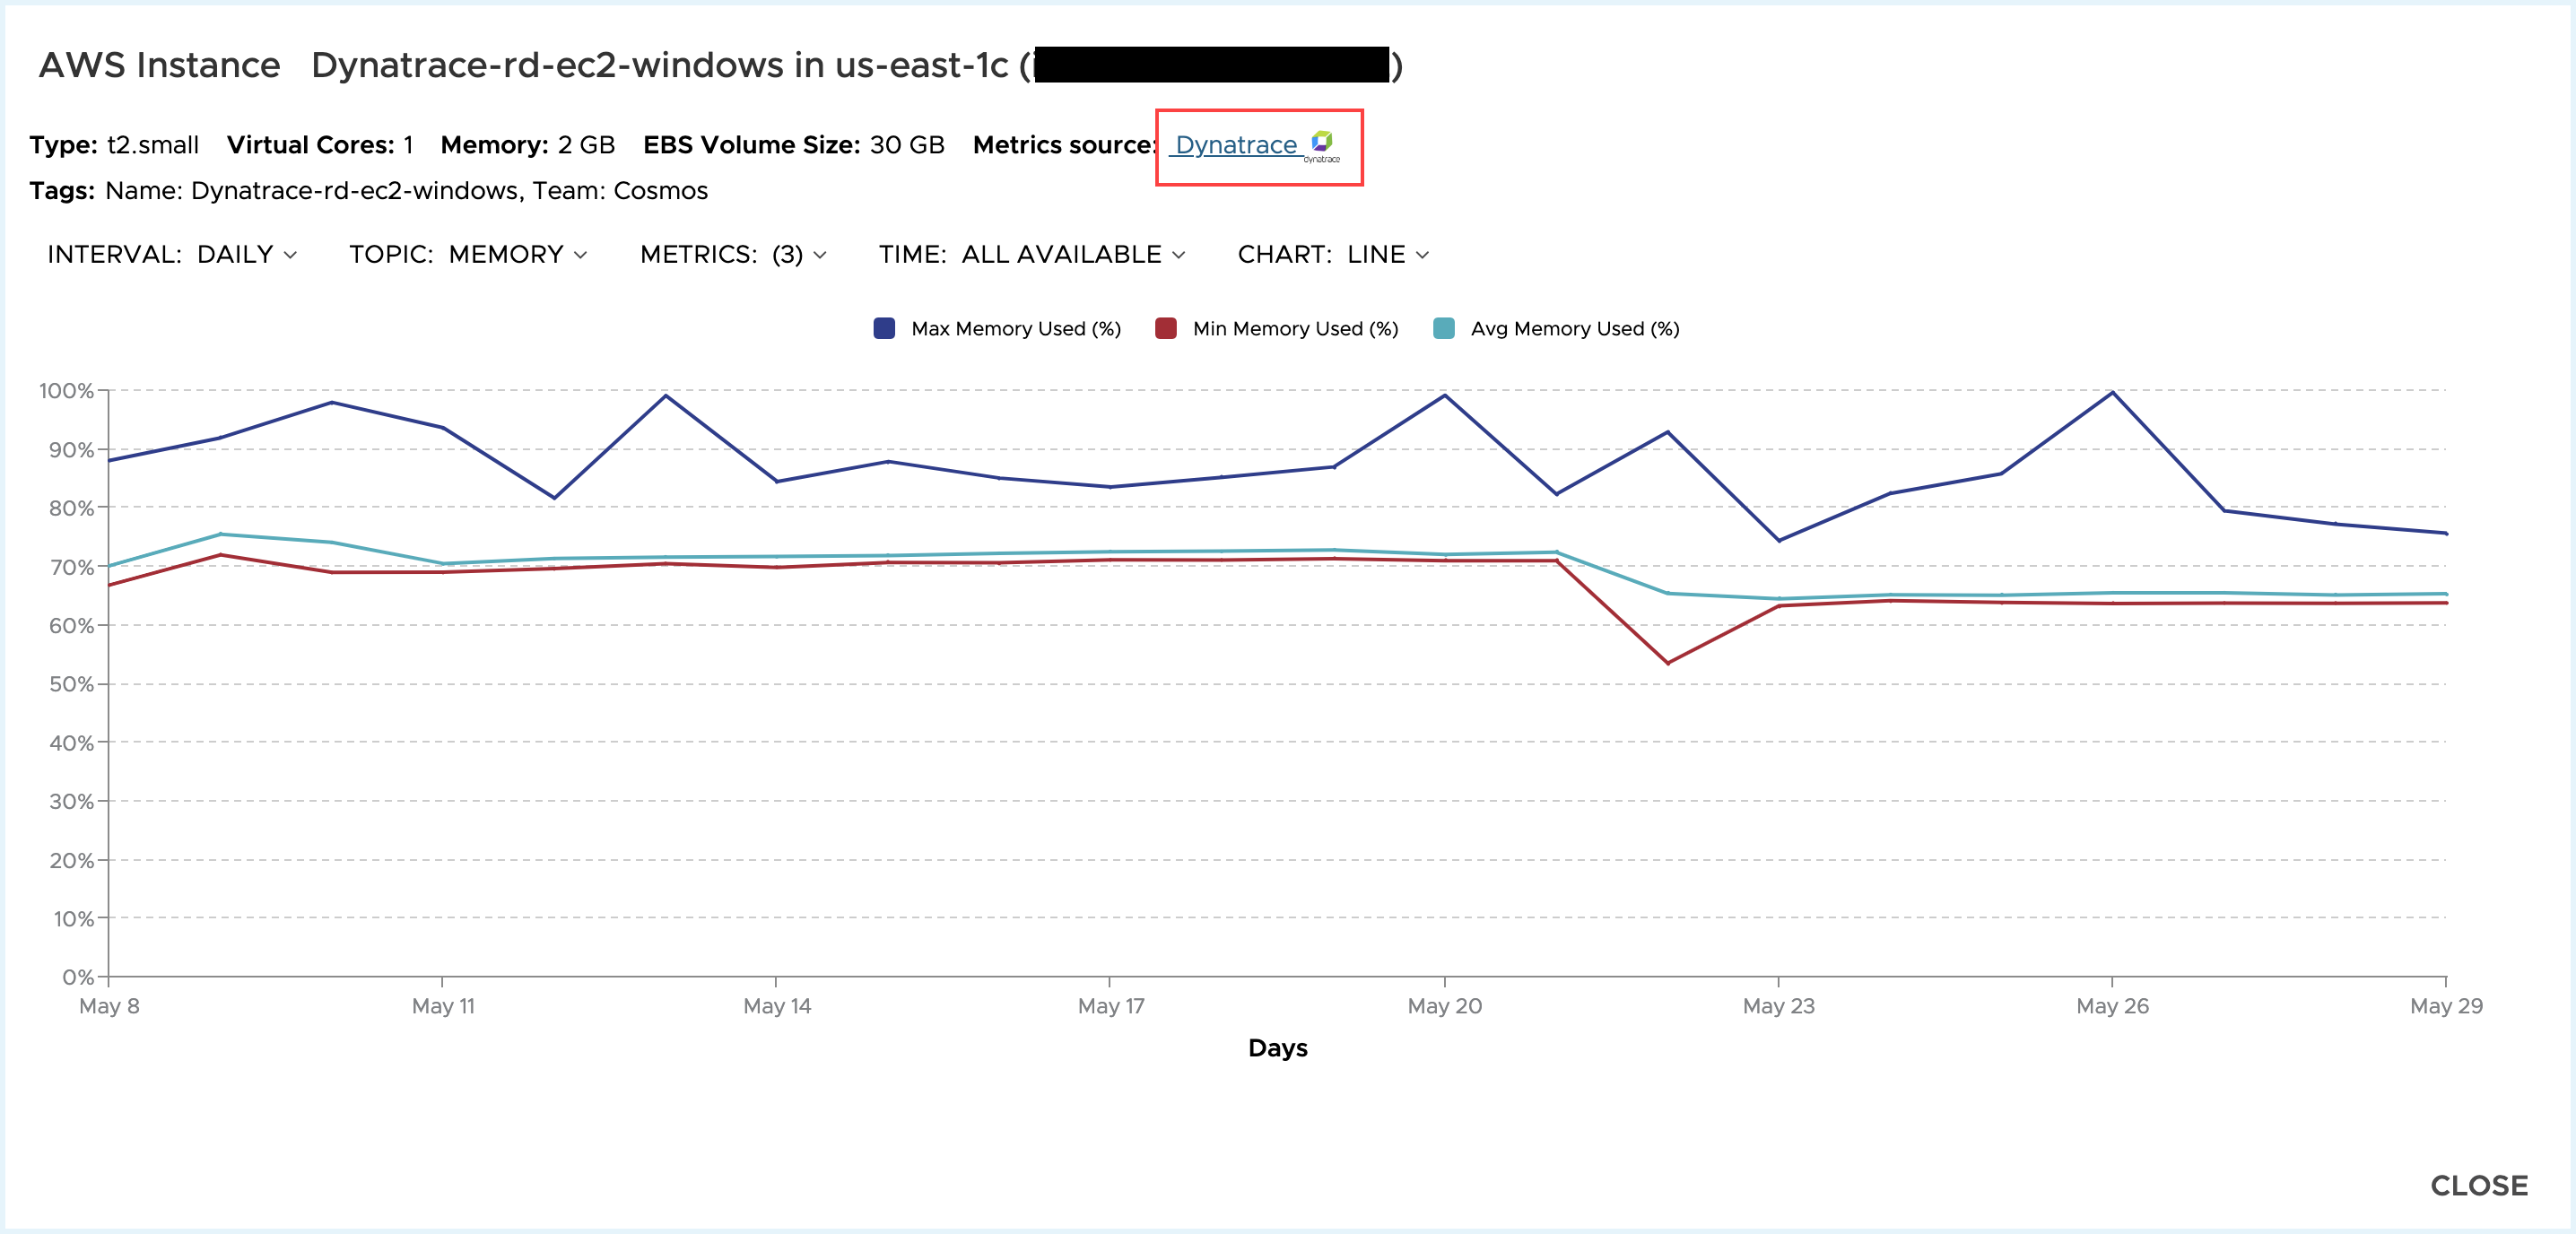
Metrics Charts
Metrics pulled in from Dynatrace will be available for each host within the Metrics report. When drilling into metrics charts for individual assets, Tanzu CloudHealth will show when the metrics source is coming from Dynatrace.
To view the metrics chart -
- In the AWS cloud, Click Assets > AWS > EC2 Instances and click the Metrics Chart icon.
- In the Azure cloud, Assets > Azure > Virtual Machines and click the Metrics Chart icon.
The following is an example of AWS Instance metric chart.
Performance Report
Metrics pulled in from Dynatrace will be available in the Tanzu CloudHealth AWS EC2 Performance report and Azure VM Performance report. The following is an example of AWS EC2 Instance performance report.
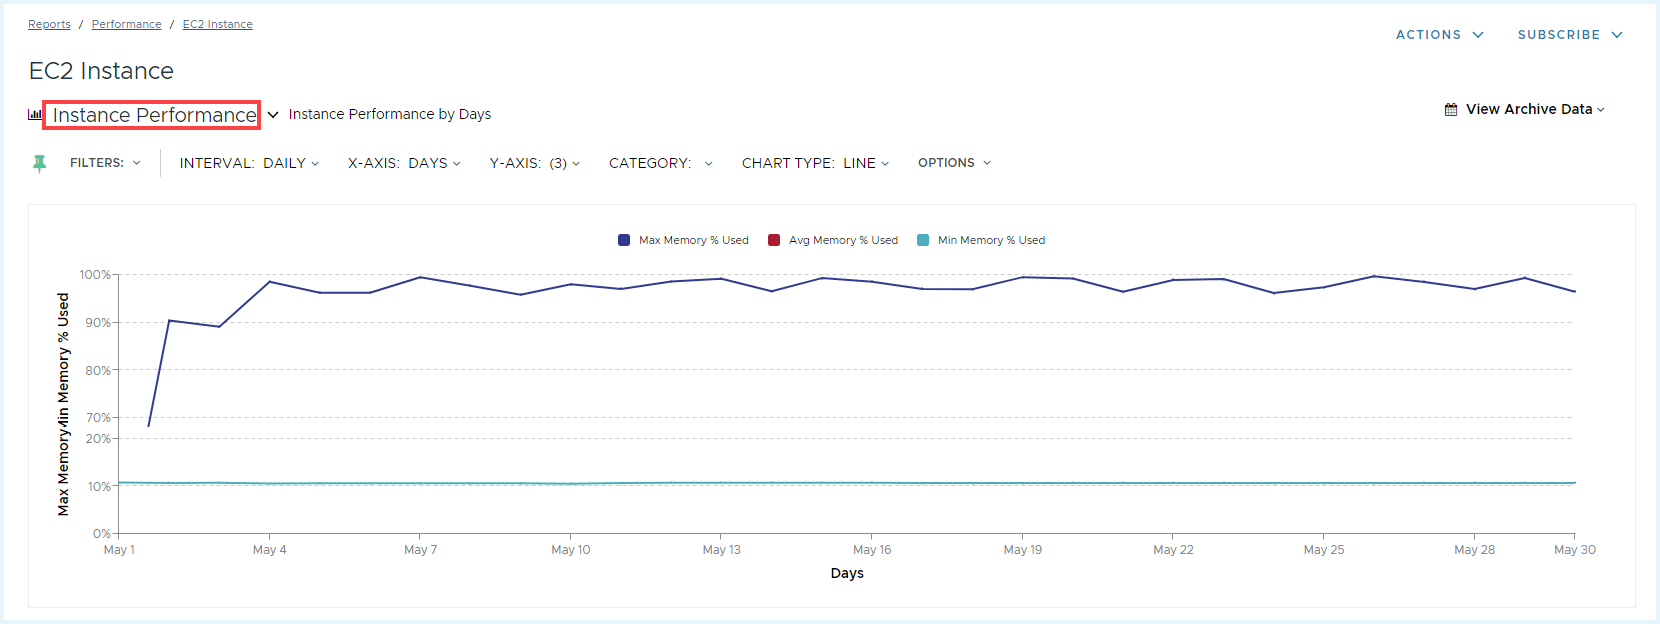
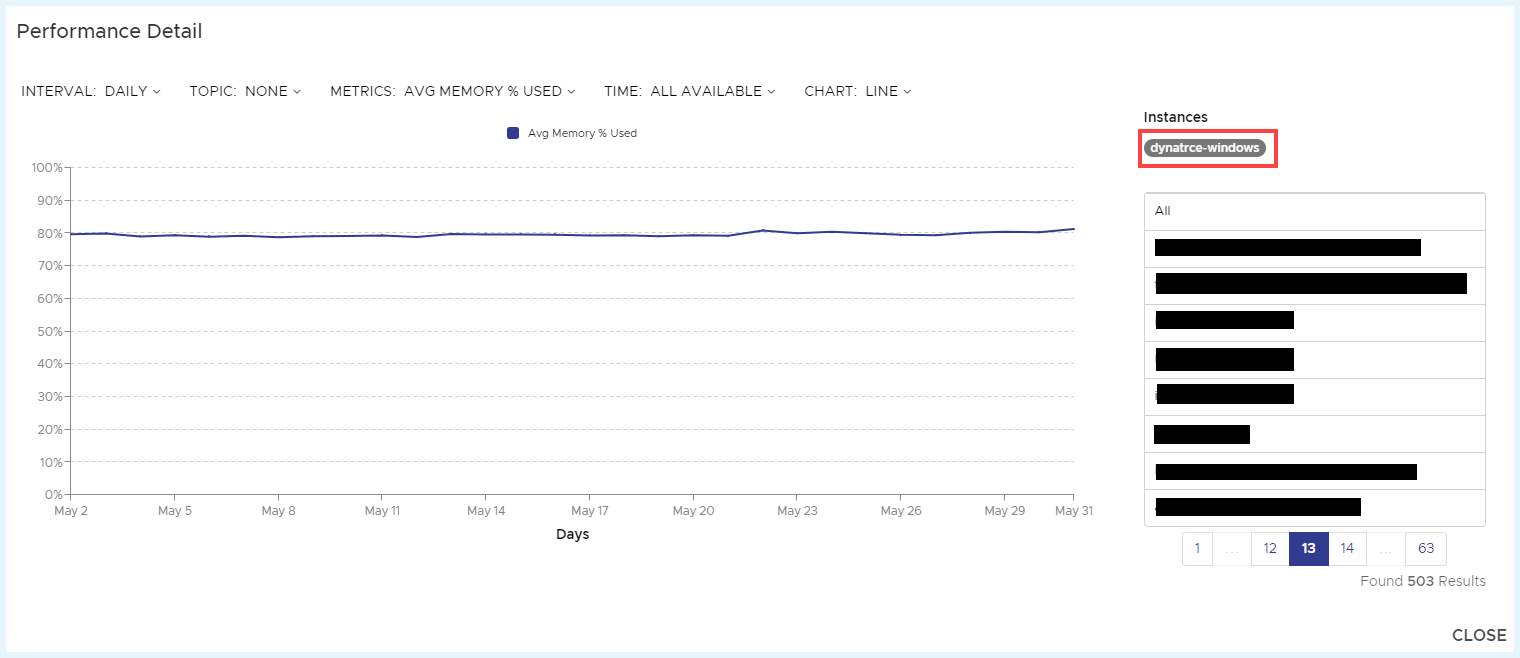
Further, you can drill into Performance Detail by clicking on the data points on the chart.
NoteWe are soon adding Dynatrace metrics support in perspectives in the Tanzu CloudHealth platform.
Integrate with Alert Logic Cloud Defender
Identify suspicious activity, get context on security incidents, and develop incident remediation measures.
Why Use Alert Logic
Alert Logic is the leader in security and compliance solutions for the cloud. It provides security-as-a-service for on-premises, cloud, and hybrid infrastructures, and delivers deep security insight and continuous protection at a lower cost than traditional security solutions.
For more information, see the Alert Logic website.
Benefits of Alert Logic Integration
Together, Alert Logic and Tanzu CloudHealth can protect your sensitive data in the following ways:
- Identifying suspicious activity
- Obtaining context around security incidents and vulnerabilities
- Providing incident validation and remediation steps
Add Alert Logic Account
- From the menu, select Accounts > Setup > Alert Logic.
- Click New Account.
- Name the account.
- Retrieve the API Key and Alert Logic Customer ID for your Alert Logic account. For more information, see Get Your Alert Logic API Key.
- Enter the Data Center Region assigned to your Alert Logic account. To locate the data center region, hover over the flag icon in the right corner of your Alert Logic account.
-
Click Save Account.
Tanzu CloudHealth begins collecting data within 15 minutes of account setup. Thereafter, data is collected every 15 minutes. Tanzu CloudHealth fetches up to a year’s worth of data from the date when you add the Alert Logic account.
View Alert Logic Reports
From the menu, select Reports > Security > Alert Logic Reports to view the Alert Logic incident report. You can filter the report by perspectives that you previously created.
The report provides a summary of incidents over time. If you added pinned filters and chart definitions in other InterActive Report views, they are persistent in this report.
View Incident Details
The integration with Alert Logic gives you details on incidents. To view incident details, from the menu, select Reports > Security > Alert Logic Incident Detail.
View details of each incident by clicking the View icon. To review the incident within your Alert Logic account, click the Alert Logic logo.
Integrate with Chef
Enable Chef with Tanzu CloudHealth to leverage Tanzu CloudHealth’s integration capability to get additional information about your infrastructure. Chef Environments can be directly leveraged to create perspectives.
Why Use Chef
Chef is a configuration management framework that simplifies the task of configuring and maintaining server infrastructure through the principal of infrastructure as code. It leverages a pure-Ruby domain-specific language (DSL) for writing “recipes” that define in code how to provision system resources. Recipes are collected into “cookbooks.”
Recipes use building blocks called resources. A resource describes some piece of infrastructure, such as a file, a template, or a package to be installed (such as Tanzu CloudHealth’s performance and monitoring agent). You can use the many resources included in Chef or create your own to manage unique configurations and legacy systems.
The Chef server stores your recipes as well as other configuration data. The Chef client is installed on each node in your network. A node can be a physical server, a virtual server, or a container instance. The Chef client periodically polls the Chef server for the latest recipes and checks to see if the node is in compliance with the policy defined by these recipes. If the node is out of date, the Chef client runs them on the node to bring it up to date.
If your company uses Chef, you can leverage Tanzu CloudHealth’s integration capability to get additional information about your infrastructure. Chef Environments can be directly leveraged to create perspectives. Ohai metrics can be directly leveraged to correlate the instance level metrics for memory and filesystem usage, which when combined with the Cloudwatch metrics can provide you a holistic view of the sizing of your instances and volumes. This allows you to ensure that you are not severely over or under provisioned.
What Data Does Chef Collect
The Chef client on each node reports back to the Chef server with metadata that includes information from the perspective of the operating system inside the virtual machine. This metadata includes information about available resources, such as memory and file systems, and their utilization.
The Tanzu CloudHealth aggregator collects this data from the Chef server every 15 minutes and reports back to the Tanzu CloudHealth RESTful API over HTTPS. The data collected from the Chef server can be broadly broken down as follows:
-
Node information
- Memory: Physical, Virtual, Swap
- Filesystem: Capacity and usage
- Uptime
- Operating system version information
-
Metadata that can be leveraged for Perspectives and filtering
- Chef Environments
- Node Run List
- Cookbooks
Option 1: Hosted Chef
Setup an account in Tanzu CloudHealth for each “organization” configured in Chef.
- Create a Chef client called
cloudhealth\_aggregatorwith administrator privileges. and use that username and certificate for the Tanzu CloudHealth console form. - In the Tanzu CloudHealth platform, select Setup > Accounts > Chef from the menu.
- Click New Account.
- Chef Server:
api.chef.io - API port: 443
- Username: Username of client
cloudhealth\_aggregator - Organization: Unique organization identifier that was created when you first registered your organization.
- Certificate: The
.pemfile that is saved when the client is created. - Aggregator:
Hosted
- Chef Server:
- Click Save Account. Tanzu CloudHealth performs an initial scan for the organization on the Chef server.
Option 2: On-Premise Chef
Use this option if you are using a private Chef server that is not accessible at a public IP address, and cannot be made accessible to the Tanzu CloudHealth platform.
In order to provide Tanzu CloudHealth visibility into your private Chef server, install the Tanzu CloudHealth aggregator. The aggregator is an agentless collector that can be deployed to your infrastructure for collection of data from both hosted and local systems. The aggregator is intended to run on a dedicated instance and requires Java to be available.
Once an aggregator is installed, the Tanzu CloudHealth platform needs to be configured with a Chef account for each Chef server configured.
Set up instance to run the Tanzu CloudHealth aggregator
- Launch an instance to run the Tanzu CloudHealth aggregator.
Ubuntu 22.04andOpenJDK 11is ideal. - Install Java by running the following command:
sudo apt-get install openjdk-11-jre-headless
If you see an output stating that alternatives have been installed, this step is complete. 3. Verify if the OpenJDK 11 is set as the default Java version using the following command -
sudo update-alternatives --config java
If the OpenJDK 11 is not set as default Java version, then run the following command -
sudo update-java-alternatives -s java-1.11.0-openjdk-amd64
Add and configure aggregator account in Tanzu CloudHealth platform
-
Add aggregator to Tanzu CloudHealth platform.
- In the Tanzu CloudHealth platform, from the menu, select Setup > Data Collection > Aggregators.
- Click New Aggregator. Name the aggregator, but retain default settings for the other parameters.
- Click Save to return to the aggregator listing page.
-
Get the install script.
- Click the View icon next to the new aggregator and click New Installer.
- Save the downloaded script.
-
Install the aggregator.
- Copy the script over to the instance.
- Change permissions on the script to allow execution:
chmod 700 cht\_installer.sh - Run the installer.
Note:
- If installing in your home folder, not as a service, do not use
sudo. - If installing outside home, such as
/opt, run using sudo.
Configure Chef accounts
Once the aggregator is installed and running, you can create or assign Chef accounts to it.
Configure the account settings.
- Chef Server: Name of Chef server. Ensure that the name is correctly spelled.
- API port:
4000for private Chef 10 or8000for private Chef 11+. - Username: Username of client
- Organization: Unique organization identifier that was created when you first registered your organization.
- Certificate: The
.pemfile that is saved when the client is created. - Aggregator: Select the installed aggregator.
When using an aggregator, all credentials entered into the Tanzu CloudHealth platform are stored in a secure local vault. If the aggregator is terminated, or needs to be reinstalled, all credentials will need to be entered again.
Note: Contact your Account Manager or Solutions Architect for help with configuring the Private Chef data collection.
Security Considerations
- Create a separate user for the Tanzu CloudHealth aggregator, so that each user gets their own
.pemfile. With this approach, you can revoke access at any time. - Integration with Private Chef requires you to have port
4000or8000open so that the Chef server can communicate with Chef nodes.
Setup Troubleshooting
- Port Number: The port number should be
443for hosted,4000for private Chef 10, or8000for private Chef 11+. - Server Name: Ensure that the server name is correctly spelled.
- Wrong
.pemfile: Ensure that the right.pemfile for the right user and organization combination is being used. A private.pemfile is required. - Time out: A time out can occur if you have too many servers, for example, 500 nodes from a Chef server.
Get Instance Rightsizing Metrics
The Instance Rightsizing Report provides a view into the utilization of EC2 instances. For each instance, it reports a score for attributes such as CPU, Memory, and Disk. The report helps with making rightsizing decisions.
While CloudWatch metrics provide detailed performance information from outside the VM, Chef can provide information from the point of view of the operating system. This information allows Tanzu CloudHealth to calculate a score that reflects how the provisioned resources are being utilized.
Instances with low scores reflect possible concern of being over-provisioned or underutilized.
Usage numbers are represented visually as battery meters with the length and color of the bar representing the resource score. Hovering over the meter brings up a detail panel that allows quick access to the detailed resource metrics.
Detailed trended utilization information is available by clicking the relevant “battery meters.”
By default, the report is sorted by Wasted Cost, highest first, which allows you to identify the underutilized resources costing you the most.
Note: You can only customize columns in the All topic view.
Get Volume Rightsizing Metrics
The Volume Rightsizing Report gives you a view into the utilization of provisioned Elastic Block Storage (EBS) capacity and IOPS.
Chef data provides visibility into file system utilization, which is used to score the usage of provisioned storage capacity. CloudWatch IOPS reporting is leveraged to score PIOPS utilization.
The score provides quick visibility as to how well the volume has been provisioned for its purpose. The Wasted Cost allows prioritizing those volumes that are the most underutilized.
Similar to the instance report, detailed trended utilization information is available by clicking the relevant “battery meters.”
Build Perspectives using Chef
You can build both standard and dynamic Perspectives for Chef Environments.
Dynamic Perspective: Environments (Chef)
You can then search using the Categorize option.
Click Add All as Dynamic Rule to build a Perspective with Chef Environments as sub groups. You can use this Perspective across all the cost, usage, and performance reports. You can also use the Perspective for Policy Notifications and Pulse reports.
You can also build Standard Perspectives using the Chef metadata for Runlist, or Recipes as illustrated below:
Note: This Perspective was built using values from Chef runlist for filtering.
We recommend creating a Role Perspective, which leverages the run list to identify the functional role of a node. This delivers fine grained information that will enable identifying nodes and related assets in cost, usage and performance reports.
The Rightsizing by Perspective report is especially powerful when combined with a Role based perspective. It provides at-a-glance capacity and utilization information across functional clusters.
Use Case for Perspectives
Once your Perspective for Chef is built, you can begin leveraging the Perspective across the platform. For example, at Tanzu CloudHealth we use a standard Perspective called Function that we built by searching and filtering on values from the Runlist. The report, shown below, gives our CTO quick visibility on which functions are driving up the infrastructure cost.
Reviewing Assets
The Tanzu CloudHealth platform provides an explorer view of all your Chef managed assets. Review all assets configured using Chef navigating to Assets > Chef. There is a high level breakdown provided by Environments, Nodes, Cookbooks, and Filesystems.
Policies based on Chef Runlist
You can also create a Policy to notify you on a Chef runlist that can be leveraged for governance within your organization. For example, we use the following policy with multiple conditions based on the Chef Runlist. We use this to manage compliance of our Chef runlist requirements.
Integrate with Ansible
Ingest AWS, server, and playbook information. Manage and automate complex multi-tier deployments.
Why Use Ansible
Ansible is an IT automation engine for activities such as cloud provisioning, configuration management, application deployment, and intra-service orchestration. Ansible models your IT infrastructure by describing how all of your systems inter-relate, rather than just managing one system at a time.
Ansible does not use agents or additional custom security infrastructure, making it easy to deploy. Most importantly, you can describe automation jobs in the Ansible Playbook using YAML syntax.
If your company uses Ansible, you can leverage Tanzu CloudHealth’s integration capability to get additional information about your infrastructure. Ansible facts can also be used to create Perspectives.
Prerequisites
- Ensure that you have not turned off fact gathering in your playbooks. The statement
gather_facts: nomust not be present in your playbooks. - Install
httplib2on the host machine. Use one of these approaches to install.- Using
apt-get:sudo apt-get install python-httplib2 - Using
pip:sudo pip install httplib2
- Using
- Use either Ansible 2+ or install
ohaiorfacteron your managed nodes. Otherwise, node uptime information does not appear on the Tanzu CloudHealth platform.
Add Ansible Account
- From the menu, select Setup > Accounts > Ansible.
- Click New Account, type in a Name, and click Save Account. The account is listed along with its API key.
Get Tanzu CloudHealth Collector Role
In your playbooks, make sure Ansible is installed and run the following command:
ansible-galaxy install git+https://github.com/CloudHealth/ansible-cloudhealth-collector.git
Define Tanzu CloudHealth API Key
Tanzu CloudHealth uses the cloudhealth_api_key variable to identify you when you make API calls. There are three ways to define this variable.
-
As plain text: Store as plain text in your playbook variables.
cloudhealth_api_key: xxxxxxxx-xxxx-xxxx-xxxx-xxxxxxxxxxxx -
As environment variable: Define playbook variable and add this line to your
~/.bashrcfile and source~/.bashrc.export CLOUDHEALTH_API_KEY=xxxxxxxx-xxxx-xxxx-xxxx-xxxxxxxxxxxx -
Secure storage: Use Ansible Vault to store the API key.
Run Playbooks
Setting up the Tanzu CloudHealth Ansible collector does not change how you run your playbooks. Run your playbooks as you normally would and the Tanzu CloudHealth Collector role will will gather facts during each run.
List Gathered Information
You can view the information gathered from Ansible in two ways.
In the Tanzu CloudHealth platform 1. From the menu, select Setup > Ansible. A list of all Ansible Accounts created that generated an API key appears. 2. Click the View button to access the General information tab. You can view which nodes are associated with that particular account by clicking on the Nodes tab. 3. Click the view button for a node to see the facts gathered.
In AWS Explorer 1. In the AWS Explorer, select Integrations > Ansible. 2. Click Nodes to view nodes across all Ansible accounts.
Use Ansible Information in Perspectives
An additional benefit to gathering information from Ansible is the ability to use that information to create Perspectives.
Integrate with Datadog
Understand performance trends and requirements so that you can make the good provisioning decisions.
The Datadog integration gives you improved visibility across every dimension of your cloud environment. The resulting holistic view provides a better understanding of performance trends and requirements so that you can make good provisioning decisions.
Setting Up Datadog Accounts Within Tanzu CloudHealth
Initial Account Setup
- From the menu, select Setup > Accounts > Datadog and click Add Account.
- Fill out the form with information from the Datadog account that you want to integrate:
- Name: Friendly name, you can update this at any time.
- API Key: API keys are unique to your organization.
- Application Key: Application keys, in conjunction with your organization’s API key, give full access to Datadog’s programmatic API. Tanzu CloudHealth only queries Datadog for host and metric information and does not write anything to Datadog. Application keys are associated with the user account that created them and can be named. The application key is used to log all requests made to the API.
- Region: Select appropriate region.
- Import tags: Determine whether to import Datadog tags into the platform.
- Allowed tags: If Import tags is enabled, tags will be actively collected, and you will see an additional field to accept the tags that you want to import into Tanzu CloudHealth. Select the tags that should be allowed to import within the Tanzu CloudHealth platform.
-
Click Save Account.
It may take up to one hour for the host data to be available in Tanzu CloudHealth. In addition, Rightsizing and Metrics drilldowns can take up to 24 hours to collect and show within the Tanzu CloudHealth platform.
After account setup, the imported Datadog tags can be used in perspectives and reports.
Data Collection
What data does the Tanzu CloudHealth platform collect
-
Tanzu CloudHealth collects new assets, in this case Datadog Hosts, on a 15 minute basis. These assets will have Datadog-specific information associated with them, such as:
- Datadog tags
- Whether or not the Datadog agent is installed on the instance
-
Datadog tags are treated as dynamic attributes on a Datadog Host, upon which users can write Perspectives. Tanzu CloudHealth will also add a single Tags attribute that aggregates all current tags (identical to what the platform does today with EC2 Instance). Datadog tags cannot be overwritten with custom tags.
-
Tanzu CloudHealth collects new Datadog tags every 15 minutes and adds them to the Datadog Host.
-
Tanzu CloudHealth collects File Systems from Hosts running the Datadog agent (note: Datadog agent required).
-
Tanzu CloudHealth collects base performance metrics on an hourly basis. For each metric, Tanzu CloudHealth performs basic aggregation functions (avg, min, max, sum) for the hour to ensure consistency of this data with other data sources.
Metrics Collection Table
The metrics collected from Datadog include:
| Metric Family | Tanzu CloudHealth Metric | Tanzu CloudHealth Aggregation | Datadog Metrics |
|---|---|---|---|
| CPU | CPU % | avg, min, max | = system.cpu.system + system.cpu.user |
| File System | File System Size (GB) | avg, min, max | = system.disk.total |
| File System | File System Used (GB) | avg, min, max | = system.disk.used |
| File System | File System Used % | avg, min, max | = system.disk.used / system.disk.total * 100 |
| Memory | Memory Capacity (GB) | avg, min, max | = system.mem.used + system.mem.free |
| Memory | Memory Free (GB) | avg, min, max | = system.mem.free + system.mem.cached +system.mem.buffers |
| Memory | Memory Used % | avg, min, max | = system.mem.pct_usable |
| Network | Bytes received | avg, min, max | = system.net.bytes\rcvd |
| Network | Bytes sent | avg, min, max | = system.net.bytes\sent |
File System metrics will be correlated to a File System and the Datadog Host/EC2 Instance.
Datadog Within the Tanzu CloudHealth Platform
Perspectives
Datadog tags can be used to create specific business asset grouping within Tanzu CloudHealth Perspectives. Datadog Hosts will show in the ‘Choose an Asset Type’ menu, as well as specific Datadog fields including Datadog Console, Datadog Hostname, and tags pulled in from the Datadog Account.
Rightsizing
Datadog will pull in CPU, Memory, and Disk for instances and show them within the Rightsizing Report for each instance that it has metrics for. Datadog CPU metrics will take priority over Cloudwatch CPU metrics in this section as well. Also, if Tanzu CloudHealth detects Datadog agent running for a host, the platform will exclude CloudWatch CPU collection for that host.
Extra columns can be added within the Rightsizing Report as well for Datadog specific information.
Assets
Clicking the Datadog icon on this screen will open a browser tab to the Datadog console, displaying the performance dashboard for the host.
Once inside the Hosts menu, you can click on the Instance Name and drill down into Performance. This will give you a detailed view of network performance in a multi-chart visualization.
You can also click on the Datadog Console link and open the Datadog Dashboard for the corresponding instance.
Metrics Charts
Metrics pulled in from Datadog will be available for each instance within the Metrics report.
When drilling into metrics charts for individual assets, Tanzu CloudHealth will show when the metrics source is coming from Datadog.
Integrate with Slack
Connect a Slack workspace to create and drive Policy Action workflows.
This feature is in private beta. If you want to enable this feature, contact the support team [email protected].
Why Use Slack
Slack is a tool that provides a digital workspace to organizations. You can use Slack to communicate across teams, collaborate on projects, and automate workflows using bots. In the context of the Tanzu CloudHealth Platform, you can use Slack to drive and create workflows via Policy Actions.
For example, consider that the Tanzu CloudHealth security recommendations feature discovers vulnerabilities in your infrastructure. You can trigger a Slack message to a specific channel in your Slack workspace. The message contains links to the notification and the specific policy that was violated in the Tanzu CloudHealth Platform.
Setup Slack Account in Tanzu CloudHealth Platform
- Log in to the Tanzu CloudHealth platform. From the left menu, select Setup > Accounts > Slack and click New Slack Account. Then click Link Account. You are redirected to Slack.
- In Slack, authorize Tanzu CloudHealth to add a bot to your workspace.
- If you want Slack messages from Tanzu CloudHealth sent to public or private channels in your workspace, add the
@CloudHealthuser to those channels. Repeat these steps for each Slack workspace that you want to link.
Configure Slack Action
- In the Tanzu CloudHealth Platform, from the left menu, select Setup > Governance > Actions. Navigate to the Slack Action section and click Set Up.
- In the Setup dialog box that appears, select a Slack account to send messages to. Then select the default recipient for Slack messages. When you create policies that send Slack messages, you can override the recipient that you specify here.
A recipient can be a public channel, a private channel, or a user. If you select a public or private channel as recipient, make sure that you have invited the
@CloudHealthuser to the channel. If this user is not invited, the Tanzu CloudHealth Platform is unable to send Slack messages to the channel. - Click Save Action.
Troubleshoot Slack Integration
If the Slack message action that you create does not send messages appropriately to your channel, follow these steps.
- From the left menu in the Tanzu CloudHealth Platform, select Dashboards > Notifications > Actions.
- Click the View icon for a FAILED action to see additional information on why the failure occurred. For example, here the Slack message delivery failed because the
@cloudhealthbot was not invited to the channel.
