Cost Reports
Cost Reallocation
Organizations tend to look at costs through different perspectives depending on the stakeholder who receives a cost report. The Finance department might want a monthly breakdown of costs by product line or shared environment. Operations might need a cost breakdown by project or team. Engineering might want a cost breakdown by application role.
In a large-scale cloud environment, these perspectives change over time, so it is important to be able to align costs and organize assets in ways that mirror the business.
It can be challenging to identify all assets and resources that make up your cloud environment and organize them from a business perspective. Furthermore, creating groups that meet business-reporting requirements can be difficult if there is a large number of costs not associated with resources at the end of each month.
AWS and Azure report two types of costs:
- Direct Cost: These costs have a resource ID or asset ID associated with them. These costs are attributed to an asset or resource and can therefore allocate them to a Perspective group.
- Indirect Cost: These costs are not associated with a resource ID or an asset ID. Support costs are an example of indirect costs. Therefore, they cannot be attributed to a group.
VMware Tanzu CloudHealth classifies an AWS or Azure Service as a Direct Cost or Indirect Cost. When AWS or Azure introduces a service, the platform initially classifies the service cost as an Indirect Cost. Then, when support for that service is built into the platform, the service cost becomes a Direct Cost that can be allocated to Perspective Groups.
The mix of direct and indirect costs leads to charges often being attributed to the wrong department, making cost allocation a time-consuming and complex process.
Both direct and indirect costs are tied to the account that generated the usage of the cloud asset. You can to reassign indirect costs from your bill by the proportion of direct costs within your Perspective Groups.
You can create cost reallocation rules to determine when indirect costs are charged to your account. These rules help you easily align charges across business groups using Perspectives, a task that would otherwise be extremely time-consuming.
How to Create Rule for Reallocating Costs
Reallocation involves selecting a cost source and redistributing it among one or more cost destinations.
After you create and save a cost reallocation rule, it takes at least 24 hours for the reallocation results to be available in the cost reports.
For detailed examples of how to reallocate costs according to different scenarios, see How to Reallocate Cost.
Step 1: Create Ruleset
A ruleset is a placeholder for one or more rules. The rules are run in the sequence in which they are ordered within a ruleset.
-
From the menu, select Setup > Cost Reallocation and click *New Ruleset.
-
Provide a Name and Description for the ruleset to help you identify it later. The ruleset is Enabled by default, and it becomes active as soon as you save it.
Step 2: Select Cost Source to Reallocate
There are two types of sources:
- An indirect cost
- Costs attributed to a specific group in a perspective.
Step 3: Select Destination that Absorbs Cost Source
The cost destination changes depending on your selection of the cost source. When there are no destination matches for cost reallocation, the cost is instead reallocated equally to each perspective group.
Step 4: Select Whether Gross Costs or Net Costs Should Be Considered
Make a selection to specify whether gross costs or net costs should be considered during reallocation. Net costs include credits, whereas gross costs do not.
The costs in the source being reallocated may include credits and are unaffected by your selection.
However, when this setting is switched on, any credits in the target are affected as follows and impact the ratios in which the reallocated costs are proportioned in the targets:
- Credits in direct costs, and not in an indirect cost being reallocated, are ignored.
- Credits are ignored in a target Perspective Group when costs in one Group are reallocated across other groups
What happens to existing reallocation rulesets that were created prior to this option being available? Rulesets that you created before this setting was enabled will not account for credits during reallocation. You can enable this setting for existing rulesets and when you do, you will see one or more of the the following effects in your Cost History reports.
- Historical cost reallocations will change once credits have been factored into the reallocation process.
- Depending on when the option is enabled, there is less likelihood of inexplicable negative costs appearing in the reports.
Step 5: Enable the Cost Reallocation Across Accounts/Subscriptions
This is an optional step. By default, the Reallocate Across Accounts/Subscriptions is disabled. Based on your business requirement, you can enable the option.
Note that, once your enable the option -
- All costs will be reallocated across accounts or subscriptions.
- The ruleset can only contain one rule.
- Although you specify one or more Perspective Groups as the target for cost reallocation, the reallocation process changes the underlying cost attributes when you view cost reports categorized by Accounts or Subscriptions. These changes are visible even if you do not filter your cost reports by perspective groups.
For more information, see the How to Reallocate Cost article in the Tanzu CloudHealth knowledge base.
Allocate and Analyze VMware Costs
Get visibility into your VMware asset costs and derive insights from cost trends using Benchmark Pricing.
One of the challenges with operating in a VMware environment is having visibility into your costs and deriving insights from cost trends. Tanzu CloudHealth helps you discover and price your VMware assets so that you can develop insights from cost trends.
Why Virtual Machine Pricing is Critical
When you properly assess the cost of the Virtual Machines (VMs) in your VMware account, you can meaningfully allocate and bill machine usage costs to departments, teams, or individuals in your organization.
However, arriving at the cost of a machine is not straightforward. It requires knowledge of computing costs, computing capacity, and projected usage, all of which are variables that evolve as your VMware accounts grow.
Components of Machine Cost
The cost of a machine, data center, cluster, and host is defined by its cost drivers. Cost drivers are the criteria that make up the total cost of the machine, from the server hardware cost to fees for storage, licensing, maintenance, and so on.
Generate Automatic Pricing Using Benchmark Pricing
To use benchmark pricing, update your VMware Aggregator to version 1.7.27.56 or later. If your Aggregator uses an earlier version, contact Tanzu CloudHealth Support.
Benchmark pricing uses the actual machine hardware costs according to industry standards to calculate asset costs. Benchmark pricing automatically assigns pricing to all your VMware accounts without requiring you to manually configure pricing for machines.
Visualize Potential Benchmark Pricing Costs
You can review what your daily benchmark pricing costs would look like before you enable benchmark pricing:
- Go to Assets and select one of the following menus:
- Data Centers
- Clusters
- Hosts
- Machines
- Select Edit Columns
- Add the Daily Cost column to the list of current columns and click Update.
The theoretical daily benchmark cost appears in the Daily Cost column in the asset report. After you enable benchmark pricing, this column reports the actual daily cost.
The asset reports take 2 hours to reflect any changes to cost drivers and Benchmark Pricing.
Step 1: Enable Benchmark Pricing
Legacy customers must manually enable Benchmark Pricing. New customers are automatically enabled with Benchmark Pricing and can skip this step.
- Navigate to the Data Center tab from the top. A banner about benchmark pricing is displayed at the bottom of the dashboard. Click Update Pricing in the banner.
- In the modal, select Apply Pricing. Benchmark pricing is applied to all your VMware accounts across the platform, including the Migration Assessment, Policies, and Reporting. Additionally, the Pricing menu in the navigation is separated into two new menus:
- Pricing: Manage pricing for Data Center servers. For more information, see Allocate and Analyze Data Center Costs.
- Benchmark Pricing: Manage pricing for VMware machines.
Step 2: Review Cost Driver Pricing
To see how benchmark pricing has priced your overall infrastructure after enabling benchmark pricing, go to Setup > Admin > Benchmark Pricing:
- Review the amounts automatically assigned through benchmark pricing to your cost drivers.
- To view cost driver costs for a specific data center, select that data center from the Showing Expenses For dropdown.
- To drill down further into costs, select a cost driver from the table.
When you update a cost driver’s pricing, the Monthly Expense column takes up to 45 minutes to update to the correct amount.
The Comparison with Industry Benchmark column updates every 12 hours.
You can review your historical cost driver costs in the Cost Driver History report by going to Reports > Cost > Cost Driver History.
The Cost Driver History report takes 24-48 hours to reflect any changes to cost drivers and Benchmark Pricing.
Step 3: Modify Cost Driver Pricing
The pricing automatically generated by benchmark pricing may not accurately reflect your cost driver costs. You can modify these costs as needed by going to Setup > Admin > Benchmark Pricing and selecting one of the following cost drivers:
- License
- Facilities
- Maintenance
- Additional Cost
- Network
- Server Hardware
- Storage
- Labor
The original benchmark pricing-generated cost is always displayed as the Reference Cost for each editable cost field.
Reference Cost updates every 12 hours.
License
To modify the benchmark pricing assigned to your VMware licenses:
- Select a license from the license table.
- Select the pricing method:
- Per Socket/Per Instance: Prices the license by cost per socket or instance.
- ELA: Prices the license by total fixed monthly license cost.
- Modify the monthly cost of the license.
- Click Save.
Facilities
To modify the benchmark pricing assigned to your VMware facilities:
- Select whether to price the facilities in detail or by total monthly cost.
- Select the pricing method:
- Detailed Cost: Prices facilities by cost per kilowatt/hours and per Rack unit.
- Total Monthly Cost: Prices all facilities by total fixed monthly facility cost.
-
Modify the monthly costs as needed.
-
Click Save.
Maintenance
To modify the benchmark pricing assigned to your VMware maintenance:
- Select the pricing method:
- Detailed Cost: Prices maintenance by Windows Licensing cost percentage and Server cost percentage.
- Total Monthly Cost: Prices all maintenance by total fixed monthly maintenance cost.
- Modify the monthly percentage costs as needed.
- Click Save.
Additional Cost
Not all costs are accounted for in benchmark pricing cost drivers. For example, benchmark pricing cost drivers don’t factor in the cost of insurance. You can add additional costs for the following asset types:
- Host
- vCenter
- Machine
To add an additional cost:
- Click ADD+ in the Additional Cost table.
- Enter the name of the Cost Type.
- Select the Asset Type from the dropdown.
- Select which vCenters, hosts, or machine tags to apply the additional cost to from the Assets Selection dropdown. You can select multiple entries.
- Enter the Monthly Cost per entity.
- Click the Checkbox icon.
- When you are finished adding additional cost drivers, click Save.
Network
To modify the benchmark pricing assigned to your VMware network:
- Select the pricing method:
- Per Network Interface Controller: Prices the network per NIC.
- Total Monthly Cost: Prices the network by total fixed monthly network cost.
- Modify the monthly gigabit costs as needed.
- Click Save.
Server Hardware
To modify the benchmark pricing assigned to your servers:
- Select a server group from the server table.
- Select + Add Cost Per Server.
- Select the servers you want to apply the customized pricing to.
- Modify the Purchase Date, Purchase Type, and Cost per Server ($) as needed.
- Repeat steps 2-4 to add a different custom cost to another server.
- Click Save.
Depreciation is the calculation of how much and how fast an asset loses value over time. By default, the Server Hardware cost driver uses the Max of Double or Straight model over 5 years. To modify the depreciation calculation for server hardware:
- Select the Wheel icon in the top right of the Server Hardware page.
- Enter the number of useful years in the Depreciation Years field.
- Select the depreciation model:
- Straight Line:
(original cost - accumulated depreciation) / number of remaining depreciation years - Max of Double or Straight: Either
(original cost - accumulated depreciation) / number of remaining depreciation yearsor(original cost - accumulated depreciation) * (2 / number of depreciation years), whichever is greater.
- Straight Line:
- Click Save.
Storage
To modify the benchmark pricing assigned to your VMware storage:
- Select a tag category from the table.
- Modify the monthly cost per GB as needed.
- Click Save.
Labor
To modify the benchmark pricing assigned to your VMware labor costs:
- Select the pricing method:
- Detailed Cost: Prices labor by cost by hours of labor and hourly rate.
- Total Monthly Cost: Prices all labor by total fixed monthly labor cost.
- For Detailed Cost, select a category from the Detailed cost of labor table. Enter the monthly hours of labor per Instance hours and the hourly rate for the selected category. If you select OperatingSystem, you must set the hours of labor and hourly rate for Windows Server, Linux, and Windows Desktop. For Total Monthly Cost, enter the total monthly cost.
- Click Save.
Step 4: Per-Data Center Pricing (Optional)
By default, cost driver pricing modification applies to all your data centers. You can choose to modify cost driver pricing on a per-data center basis. This allows you to price a cost driver differently for different data centers.
To modify costs for all data centers, make sure Organization Default is selected from the Show Expense For dropdown in a cost driver.
You can modify a cost driver on a per-data center basis only if you are modifying the cost driver’s detailed cost. For example, you can modify the Network cost driver on a per-data center basis if the selected pricing method is Per Network Interface Controller, but not if the selected pricing method is Total Monthly Cost.
- Select one of the following cost drivers in Benchmark Pricing:
- Storage
- License
- Maintenance
- Labor
- Network
- Facilities
- The Show Expense For field allows you to select which data center you are modifying costs for. By default, all data centers are grouped under Organization Default. Data centers that have been individually modified are indicated by an asterisk. To modify costs for only one data center, select that data center from the dropdown.
- Modify costs for the selected data center.
- Click Save.
The modified data center now has a different price than the other data centers and is no longer grouped under Organization Default for the current cost driver.
If you select Organization Default from the Show Expense For dropdown for the current cost driver and modify the monthly cost, the data center you individually modified previously won’t be affected by your pricing changes. Once you have modified a data center’s cost, you cannot return it to the Organization Default grouping and must individually modify that data center’s costs in the future.
During Cost Engine runs, it can take up to 2 hours for the main Cost Drivers page to update for individual data center price modifications.
Allocate and Analyze Data Center Costs
Get visibility into your costs and derive insights from cost trends
One of the challenges with operating in a data center environment is having visibility into your costs and deriving insights from cost trends. Tanzu CloudHealth provides you an easy way to discover and price your data center assets so that you can develop insights from cost trends.
Why Machine Pricing is Critical
When you properly assess the cost of the Virtual Machines (VMs), or machines, in your data center, you can meaningfully allocate and bill machine usage costs to departments, teams, or individuals in your organization.
However, arriving at the cost of a machine is not straightforward. It requires knowledge of computing costs, computing capacity, and projected usage, all of which are variables that evolve as your data center grows.
Components of Machine Cost
The cost of a machine is made up of two components: fixed cost and recurring cost.
- The fixed cost includes items such as the cost of the physical machines, cost of physical storage, and cost of software licenses.
- The recurring annual costs per machine include items such as network and storage costs and maintenance costs for software and hardware.
Tanzu CloudHealth simplifies the computing and assignment of fixed and recurring costs through the simple pricing calculator.
Discover and Price Machines Using Simple Calculator
Step 1: Select Account and Pricing Interval
- Navigate to Setup > Admin > Pricing. If you have enabled Benchmark Pricing with your VMware account, go to Setup > Admin > Benchmark Pricing instead.
- Select one or more Data Center Account whose machines you want to price.
- Select the intervals at which you want a cost applied to each machine: Day, Week, or Month.
For example, if you select the Month interval and then specify an OS maintenance cost of $8.00, each machine in the selected account is allocated $8.00/month in OS maintenance.
Step 2: Select Pricing Mechanism
You can allocate costs to machines in one of two ways.
| Approach | When to Use |
|---|---|
| By Configuration | To itemize fixed and recurring costs that make up the total cost for each unique machine configuration. |
| By Tags | To apply a flat cost for each tag key value. |
Option 1: Price by Configuration
With this option, Tanzu CloudHealth identifies unique machine configurations in your data center environment. You can then itemize the fixed and recurring costs that make up the total cost for each unique machine configuration.
- In the Price assets by field, select Configuration. Unique hardware and software configurations in your environment appear below in the form. All pricing configurations appear in the Assets menu in the platform.
- Default recurring costs include Per Core, Per GB of Memory, Per GB of Storage, Windows License, and Linux License. You can also add or remove fixed costs with custom names.
- Click Calculate Pricing.
Tanzu CloudHealth applies your pricing mechanism to all unique machine configurations. 4. By default, Tanzu CloudHealth applies the new pricing from this point on. To attach the new price from the time the asset was first discovered by the Tanzu CloudHealth Aggregator, select Price Historically. Then click Save Prices.
Option 2: Price by Tag
Use this option to associate a cost with a specific tag key value for machines in your environment.
- In the Price assets by field, select Tag.
- From the Select a tag dropdown, choose a tag key whose values you want to price. Tanzu CloudHealth searches your environment for all machines that are tagged with the selected key. Unique values of the key appear along with the option to price each value. In this example, each machine under the selected account that is tagged as
Environment:Developmentis assigned the tagcht_vm_cost:$4.00/day. Similarly, each machine under the selected account that is tagged asEnvironment:Productionis assigned the tagcht_vm_cost:$5.00/day. - By default, Tanzu CloudHealth applies the new pricing from this point on. To attach the new price from the time the asset was first discovered by the Tanzu CloudHealth Aggregator, select Price Historically. Then click Save Prices.
Step 3: Analyze Machine Costs
The machine costs you specify appear immediately in the Asset report. From the left menu, select Assets > Machines.
Tanzu CloudHealth also reflects the new pricing in the Cost History report within 24 hours from when you save the new pricing.
If you did not select the Price Historically option when specifying the machine costs, the new prices appear in the Cost History report from this point on.
From the left menu, select Reports > Cost > History.
You can dive deeper into this report for further analysis. For example, you can modify the report Category to display costs by Datacenter.
You can then analyze how instance type costs have changed historically by analyzing the table below the chart.
VMware Cloud Cost History (Beta)
Historical cost trends across VMware CSP Organizations
Insights This Report Provides
- Create historical trend analyses to evaluate data.
The Time Interval dimension that you select determines how the data is defined on the X-Axis:
- Hourly: Two hour intervals for the past 7 days
- Daily: The last two months of data
- Weekly: The last 52 weeks
- Monthly: The last 13 months
Report Default Settings
- Interval: Monthly
- X-Axis: Months
- Y-Axis: Total Cost ($)
- Category: Services
- Chart Type: Bar
Report Default View
VMware Cloud Cost by Months and Services
AWS Cost Savings
Understand cost saving opportunities by business group
Report Default View
Savings by Months and Cost Category Items
Discover unrealized opportunities and realized savings related to the use of EC2 or RDS reservations.
Possible Dimensions
Choose from unique Dimensions that are only visible in a monthly interval.
| Filters | Interval | X-Axis | Y-Axis | Category | Chart Type |
|---|---|---|---|---|---|
| +Perspectives | monthly | +Perspectives | EC2 Opportunities | +Perspective | bar |
| Accounts | Accounts | EC2 Savings | Accounts | horizontal bar | |
| Billing Accounts | Billing Accounts | RDS Opportunities | Billing Accounts | area | |
| Cost Categories | Cost Categories | RDS Savings | Cost Categories | line | |
| Months | :Cost Category Items | EC2 RI Coverage | :Cost Category Items | ||
| Months | EC2 SP Coverage | Months | |||
| EC2 Spot Coverage | |||||
| EC2 On Demand Coverage | |||||
| Effective EC2 Blended Discount Rate | |||||
| Effective EC2 RI Discount Rate | |||||
| Effective EC2 SP Discount Rate | |||||
| EC2 Savings from RIs | |||||
| EC2 Savings from SPs |
These Y-Axis dimensions are defined as follows:
- EC2 Savings from RIs: The difference between your effective cost for covered RI usage, including amortized RI upfront fees, and the cost if the covered RI usage was charged as On Demand. Includes unused RI costs.
- EC2 Savings from SPs: The difference between your effective cost for covered Savings Plan usage, including amortized SP upfront fees, and the cost if the covered Savings Plan usage was charged as On Demand. Includes unused Savings Plan costs.
- EC2 Savings: The difference between the cost of EC2 usage covered by RIs and Savings Plans, and the amount you would have paid if all EC2 usage was charged as On Demand. Does not include amortized RI and SP upfront fees.
- EC2 RI Coverage: Cost for RI covered usage if that usage was charged as On Demand, divided by the cost if all EC2 usage was charged as On Demand.
- EC2 SP Coverage: Cost for Savings Plan covered usage if that usage was charged as On Demand, divided by the cost if all EC2 usage was charged as On Demand.
- EC2 Spot Coverage: Cost for Spot covered usage if that usage was charged as On Demand, divided by the cost if all EC2 usage was charged as On Demand.
- EC2 On Demand Coverage: Percentage of EC2 usage that was not covered by RIs, Savings Plan, or Spot coverage and was therefore charged at On Demand rates.
- Effective EC2 Blended Discount Rate: The average discount rate of EC2 usage covered by On Demand usage, RIs, and Savings Plans. Includes unused RI and Savings Plan costs.
- Effective EC2 RI Discount Rate: The average discount rate of EC2 usage covered by RIs. Includes unused RI costs.
- Effective EC2 SP Discount Rate: The average discount rate of EC2 usage covered by Savings Plans. Includes unused Savings Plan costs.
Azure Current Billing Period
Daily costs trends and cost drivers for the current billing period
This report appears only for Partners and Partner Customers.
Insights This Report Provides
- What is the daily cost trend for the current billing period?
- What are main drivers of cost for the current billing period?
The billing period is determined by the invoice date your in Microsoft Azure account.
Report Default Settings
- Filters: Days
- Interval: Daily
- X-Axis: Days
- Y-Axis: Total Cost ($)
- Category: Service Category
- Chart Type: Bar
Azure Previous Billing Period
Daily cost trend and cost drivers for the previous billing period
This report appears only for Partners and Partner Customers.
Insights This Report Provides
- What is the daily cost trend for the previous billing period?
- What are main drivers of cost for the current billing period?
The billing period is determined by the invoice date in your Microsoft Azure account.
Report Default Settings
- Filters: Days
- Interval: Daily
- X-Axis: Days
- Y-Axis: Total Cost ($)
- Category: Service Category
- Chart Type: Bar
AWS Cost History
Analyze cost history by months and service items
Report Default View
Cost History by Months and Service Items
Create historical trend analyses to evaluate data.
The Time Interval dimension that you select determines how the data is defined on the X-Axis:
- Hourly: Two hour intervals for the past 7 days
- Daily: The last two months of data
- Weekly: The last 52 weeks
- Monthly: The last 12 months
Negative values in this report correspond to credits that you receive from your cloud provider.
GCP History Invoice
Note Effective December 15, 2023, Google Cloud product names and SKU descriptions changed from
egressoringresstodata transfer. The new names will include modifying terms such asoutboundoroutandinboundorin. The Tanzu CloudHealth platform report labels have been updated historically to reflect the latest product names of Google Cloud. For more details, see the Renaming Egress to Data Transfer FAQ section.
Costs by product for each invoice month according to the Google invoice
- This report uses BigQuery as its data source. If you have not enabled BigQuery with the Platform, this report won’t display accurate data.
- Tanzu CloudHealth has mapped all existing GCP product labels with GCP service label names in all OLAP reports. You can see the updated categories from June 2022 onwards.
Insights This Report Provides
- What are the costs by product for each invoice month according to the Google invoice?
Report Default Settings
- Interval: Monthly
- X-Axis: Months
- Y-Axis: Total Cost ($)
- Category: Product Categories
- Chart Type: Bar
What is the Difference Between the GCP Cost History and History Invoice Reports?
The GCP Cost History report and the History Invoice report are similar in content and use the same data source, the BigQuery export. On GCP console, these reports are accessed by selecting either Usage date or Invoice month for the Time range.
However, there are several key differences between the two reports. As a result, monthly cost totals are not expected to match between the two reports.
| Cost History | Invoice History | |
|---|---|---|
| Data Source | Usage Start Time column in the BigQuery Export | Invoice Month column in the BigQuery export |
| Granularity | Monthly, weekly, and daily | Monthly |
| Included Costs | Does not include taxes and invoice adjustments | Includes taxes and invoice adjustments |
| Expected Use Case | View daily cost trends | View monthly chargebacks |
Example
Cost History - Invoice by Months and Product Categories (Default View)
Compute Engine Cost
Analyze compute engine cost by machine type
Insights This Report Provides
- What is the compute engine cost?
- Which machine family has the highest usage cost?
Report Default Settings
- Interval: Daily
- X-Axis: Days
- Y-Axis: Total Cost ($)
- Category: Machine Profiles
- Chart Type: Bar
Examples
Compute Engine Cost by Days and Machine Profiles (Default View)
Compute Engine Cost by Days and Product Categories
Report Settings - Category: Product Categories
Locate which product categories have the highest compute costs.
Compute Engine Cost by Days and Product Categories for Other Compute Engine Costs
Report Settings
- Category: Product Categories
- Filters: Machine Profiles > Other Compute Engine Costs
Gain visibility into costs that are categorized without a machine type.
ECS Fargate Instance Cost
Report data for ECS Fargate tasks
Insight this Report Provides
- What are the costs specific to Fargate spend
You can create Perspectives for Elastic Container Service (ECS) Fargate tasks. Using the AWS tags attached to these assets, the Fargate and associated costs are distributed to the Perspective groups. These Perspectives can be used for the report query.
Access Fargate Cost Reports
Navigate to Reports > Cost > History. Under Filters, click on AWS Services to select the following options under Amazon Elastic Container Service - Direct and click Update.
- EC2 Container Service - Fargate Compute
- EC2 Container Service - Fargate Data Transfer
- EC2 Container Service - Fargate Memory
In the resulting report, you can view the spend related to Fargate tasks effective from current month onwards. Historical data will not be available.
You can drill down each report by clicking on the cost value to view the resource details. The entry under SyntheticId indicates the aggregation of Fargate resources and tasks based on tags and other relevant columns.
EC2 Instance Cost
Analyze trends in EC2 Instances by type
Report Default View
Instance Cost by Days and Reservation Type
View your EC2 instance costs by days and reservation type. This report allows you to see the costs of your reservation types of On Demand, Partial Upfront, No Upfront, Spot, and All Upfront.
You can also see legacy reservation types like heavy, medium, or light, if they are still part of your infrastructure. You can also view instance usage by the instance type such as t1.micro or r3.large. Because you can select or deselect each type, you can focus on exactly the data that is most important to you.
Data Transfer Cost
Understand data transfer costs and discover opportunities for reducing them
Insight This Report Provides
- What is the AWS cost for data transfer?
- What is the AWS cost by data transfer type (Regional, Internet In, Internet Out, etc.)?
- Which cost reduction opportunities are available based on inter-region traffic and its sources?
This report provides data for per byte charges. Use the Cost History report for reporting on processing (per connection) and provisioning (per hour) charges.
AWS documentation refers to per byte charges in NAT Gateway as processing. These NAT Gateway processing (i.e. per byte) charges can be viewed in this report.
Report Default Settings
- Interval: Daily
- X-Axis: Days
- Y-Axis: Transfer ($)
- Category: AWS Services
- Chart Type: Bar
Examples
- X-Axis: Days
- Y-Axis: Transfer ($)
- Chart Type: Bar
Transfer Cost by AWS Services (Default View)
Click on the dropdown for Category and select AWS Services to display a report on transfer costs incurred by all AWS services.
Transfer Cost by Destination Locations
Click on the dropdown for Category and select Destination Locations to display a report based on the destination location of the file transfer.
Transfer Cost by Origin Locations
Click on the dropdown for Category and select Origin Locations to display a report based on the source location of the file transfer.
Transfer Cost by Transfer Type
Click on the dropdown for Category and select Transfer Type to display a report on regional file transfers and file transfers over the internet.
DynamoDB Cost
Understand DynamoDB costs by cost type
Report Default View
DynamoDB Cost by Months and Accounts
DynamoDB cost reporting allows you to look at a number of factors for costs: data transfer costs, provisioned costs, reserved costs, and unused reserved costs categorized by Accounts, Regions, or Weeks.
AWS Current Cost
Current cost by Accounts and Services Items for current month
Report Default View
Current Cost by Accounts and Services Items for current month
Study a single time period and analyze data by X-Axis and Categories.
Cost Driver History
Historical trend of spending by cost driver type in your data center.
This report is only available if you have enabled Benchmark Pricing for your VMware accounts.
Insights This Report Provides
- What is the historical trend of spending by cost driver type?
Report Default Settings
- Interval: Daily
- X-Axis: Days
- Y-Axis: Cost Driver Cost ($)
- Category: Cost Driver Type
- Chart Type: Bar
Example
Cost Driver History by Days and Cost Driver Type (Default View)
AWS Budget vs. Actual
Analyze trends in your actual spend and track it against your budget
Insights This Report Provides
- What is the budgeted spend compared to the actual spend?
- What is the trend of budget vs. actual spend?
- What is the variance (
Actual - Budget) and rollover trend? - For the most recently updated categorized budget, what is the budget vs. actual trend?
Report Default Settings
- Display Graph: By Amount ($) Computed
- Data Interval: Month to Month
- Budget: Annual
- Show Variance: Enabled
- Show Rollover: Enabled
Examples
Budget vs. Actual (Default View)
Actual Spend as Percentage of Budget
Report Settings
- Display Graph: By % of budget
Visualize your spend trend as a percentage of budget.
Budget vs. Actual for Specific Time Period
Report Settings
- Data Interval: Month range selection in Specific time period section
Budget vs. Actual for Specific Perspective
If you have in place a budget categorized by Perspective in the Platform, you can visualize the budget vs. actual trend for that Perspective.
If you have budgets categorized by multiple Perspectives, this report allows you to select only the Perspective for which the categorized budget was updated most recently.
Azure Storage
Historical trends for Azure storage costs
Insights This Report Provides
- What is the historical trend for Azure storage costs?
Report Default Settings
- Interval: Daily
- X-Axis: Days
- Y-Axis: Total Cost ($)
- Category: Storage Types
- Chart Type: Bar
Example
Storage Cost by Days and Storage Types (Default View)
Azure Cost History
Analyze historical cost trends by type
Insights This Report Provides
- What is the historical trend of spending by type?
Report Default Settings
- Interval: Monthly
- X-Axis: Months
- Y-Axis: Total Cost ($)
- Category: Service Category
- Chart Type: Bar
Example
Cost History by Months and Service Category (Default View)
Variations: Specify a different Time Interval dimension to determine how the data is defined on the X-Axis:
- Hourly: Two hour intervals for the past 7 days
- Daily: The last two months of data
- Weekly: The last 52 weeks
- Monthly: The last 12 months
Negative values in this report correspond to credits that you receive from your cloud provider.
Azure Current Cost
Analyze costs by type for the current month
Insights This Report Provides
- What are the costs by type for the current month?
Report Default Settings
- Filters: Months
- Interval: Monthly
- X-Axis: Accounts
- Y-Axis: Total Cost ($)
- Category: Service Category
- Chart Type: Bar
Example
Cost Current by Accounts and Service Category for current month (Default View)
Azure Budget vs. Actual
Compare budgeted spend with actual spend, analyze trends and variance
Insights This Report Provides
- What is the budgeted spend compared to the actual spend?
- What is the trend of budget vs. actual spend?
- What is the variance (
Actual - Budget) and rollover trend? - For the most recently updated categorized budget, what is the budget vs. actual trend?
Report Default Settings
- Display Graph: By Amount ($) Computed
- Data Interval: Month to Month
- Budget: Annual
- Show Variance: Enabled
- Show Rollover: Enabled
Examples
Budget vs. Actual (Default View)
Actual Spend as Percentage of Budget
Report Settings
- Display Graph: By % of budget
Visualize your spend trend as a percentage of budget.
Budget vs. Actual for Specific Time Period
Report Settings
- Data Interval: Month range selection in Specific time period section
Budget vs. Actual for Specific Perspective
If you have in place a budget categorized by Perspective in the Platform, you can visualize the budget vs. actual trend for that Perspective.
If you have budgets categorized by multiple Perspectives, this report allows you to select only the Perspective for which the categorized budget was updated most recently.
GCP Budget vs. Actual
Compare budgeted spend with actual spend, analyze trends and variance for GCP
Insights This Report Provides
- What is the budgeted spend compared to the actual spend?
- What is the trend of budget vs. actual spend?
- What is the variance
Actual - Budget? - For the most recently updated categorized budget, what is the budget vs. actual trend?
Report Default Settings
- Display Graph: By Amount ($) Computed
- Cost Report: Cost History Invoice
- Data Interval: Month to Month
- Budget: The latest Google-Overall Budget created
- Show Variance: Enabled
Examples
Budget vs. Actual (Default View)
You can also visualize your spend trend as a percentage of budget, by choosing By % of Budget under Display Graph.
Budget vs. Actual for Specific Time Period
Report Settings
Data Interval: Month range selection in Specific time period section
Budget vs. Actual for Specific Perspective
If you have in place a budget categorized by Perspective in the Platform, you can visualize the budget vs. actual trend for that Perspective.
If you have budgets categorized by multiple Perspectives, this report allows you to select only the Perspective for which the categorized budget was updated most recently.
GCP Big Query
Access Big Query cost reports generated by FlexReports.
Insights This Report Provides
- What is the spend across services, accounts, locations, coverage ?
- What is the Perspective-wise spend ?
Report Default Settings
- Chart Type: Bar
- Interval : Month
- X-axis: Month
- Y-axis: All
- Category: Sku Description
By choosing Perspective for Category, you can access dedicated pre-build report to understand the spend better.
Azure Amortized
Introspect trend of amortized costs, including costs for reserved VMs
Insights This Report Provides
- What is the amortized cost, including reserved VMs?
- What is the trend of VM amortization by month?
Report Default Settings
- Filters: Services
- Interval: Monthly
- X-Axis: Months
- Y-Axis: Amortized Cost and Total Cost ($)
- Category: Service Category
- Chart Type: Bar
Example
Cost Amortized by Months and Service Category filtered by: Services (Default View)
Variations: In the Category dropdown, specify a category such as Regions. The report shows you amortization by those categories so that you can analyze trends.
Example
Cost Amortized by Months and Function
Report Settings
- Filters: None
- Category: Function
Determine which functions (or similar Perspective) are incurring the highest and lowest amortized cost each month.
Variations: In the Category dropdown, specify a Perspective Group such as Environment or Team. The report shows you amortization by those Perspectives so that you can analyze trends.
Azure Amortized Cost
Azure Amortized Cost report provides better accuracy and scalability.
Insights This Report Provides
- Amortized cost for Azure service
- Amortized cost for reserved VMs
- Trend of VM amortization by month
Key Differences Between Amortized Report and Amortized Cost Report
| Amortized Report | Amortized Cost Report | |
|---|---|---|
| How is the Amortized cost calculated | Tanzu CloudHealth back calculates amortization costs based on reservation cost and usage data. | Tanzu CloudHealth utilizes the Cost Management APIs to access amortized costs from Microsoft, providing better accuracy and scalability. |
| Amortization Data | Only includes Virtual Machines amortization data. | Includes amortization data for additional reservable resources too. |
| Upfront Charges | Amortizing the upfront chargesunder Virtual Machines. | Amortizing the upfront charges under VM Reservation Orders - Upfront category. |
| Feature Support | Supported in the Custom Line Item and Cost Reallocation rules. | Not supported in the Custom Line Item and Cost Reallocation rules. |
| Service Principal | enrollmentreader role is not required. |
Must have enrollmentreader role. |
To view this report, you must update the Service Principal to contain the ‘enrollmentreader’ role. For more information on how to assign an ‘enrollmentreader’ role to the Service Principal, see Configuring an Enterprise Agreement Azure Account.
Report Default Settings
Filters: Services Interval: Monthly X-Axis: Months Y-Axis: Amortized Cost by Usage ($) Category: Service Category Chart Type: Bar
Example
Amortized Cost by Usage: View Amortized cost distributed across subscriptions, VM series, enrollments, regions etc.
For all reservations, the report displays the amortized cost of reservation mapped to the respective Subscription and Region. For unused RIs, the amortized cost will be shown under the Other category in the report.
AWS Statements
View your monthly statements from AWS for every item billed
This report lists your monthly statements from AWS for every item billed. Click the View icon next to a statement to see a general overview of that statement.
You can also download the following reports as CSV files.
- Invoice
- Detailed Billing Report
- Summarized Billing Report
AWS Amortization
Review the “fully loaded” expense for a period, including the amortization of all reservable AWS services supported.
The Amortization Report provides the following insights:
- Amortized costs for EC2, RDS, RedShift, DDB, ElastiCache, and Elasticsearch in a single view
- Recurring costs from the Cost History Report
- Support for cost reallocation
-
Support for billing rules
Reservation prepay charges and Savings Plan upfront fees are filtered out of the Amortization report.
Data Source
Amazon Cost and Usage Report (CUR)
Insights This Report Provides
- What is the amortized cost of all reservable AWS services supported (EC2, RDS, RedShift, DDB, ElastiCache, and Elasticsearch)?
- What is the full amortization schedule of reserved instance purchases?
- What does trend of recurring cost and amortized cost look like for reservable services?
- What is the trend of discounted amortized cost for each reservable service?
Report Default Settings
- Filters: All reservable AWS Services are selected
- Interval: Monthly
- X-Axis: Months
- Y-Axis: Cost ($), Amortized Cost ($)
- Category: AWS Services
- Chart Type: Bar - Stacked
Examples
Amortization by Months and AWS Services filtered by: AWS Services (Default View)
Amortization by Months and AWS Services excluding Cost
Report Settings
- Y-Axis: Amortized Cost ($)
Virtual Machine Cost
Analyze trends in Virtual Machine costs
Insights This Report Provides
- What is the monthly cost of my virtual machines?
- What is the trend of VM cost over time?
Report Default Settings
- Interval: Monthly
- X-Axis: Months
- Y-Axis: Total Cost ($)
- Category: Machine Series
- Chart Type: Bar
Example
VM cost by Months and Machine Series (Default View)
SQL Database Cost
Analyze trends in SQL Database costs
Insights This Report Provides
- What is the monthly cost of my SQL Databases?
- How do the SQL database usage costs compare to other network and storage costs?
Report Default Settings
- Interval: Daily
- X-Axis: Days
- Y-Axis: Total Cost ($)
- Category: Service Tier
- Chart Type: Bar
Example
SQL Database Cost by Days and Service Tier (Default View)
S3 Cost
Analyze trends for S3 costs
Report Default View
S3 Costs by Days and Accounts
Reporting on S3 provides cost information regarding your S3 storage. S3 is billed by the amount of storage used, as well as the amount of data transferred out.
The totals within this report reflect the cost of data transfer as well as storage. You can select other options as well, such as API costs, costs by bucket, and/or Glacier storage costs.
RDS Cost
Analyze cost trends for RDS instances and costs covered by reservations
Insights This Report Provides
- How are costs for the AWS RDS service trending across accounts?
- Which teams or infrastructure owners are spending most on the AWS RDS service?
- Which types of RDS instances are predominantly being used across teams, projects, and accounts?
- How much of the RDS instance spend is on-demand versus reservation-based?
Report Default Settings
- Interval: Monthly
- X-Axis: Months
- Y-Axis: Total Cost ($)
- Category: Accounts
- Chart Type: Bar
Examples
RDS cost trends across accounts (Default View)
Variations: Swap out Accounts in the Category dropdown with Owner, Environment, or other Perspectives. The report shows you cost trends by those Perspectives so you can analyze spend by team, project, or infrastructure owner.
RDS cost trends by Instance Type
Report Settings
- Category: RDS Instance Types
Determine which types of RDS instances are being used across teams, projects, and accounts.
On-demand versus reservation-based RDS cost trend
Report Settings
- Category: Reservation Type
Analyze on-demand versus reservation-based cost trend for the AWS RDS service. Get a quick understanding of the potential for making additional reservation purchases to reduce costs.
GCP Current Cost
Analyze costs by project for the current month
Insights This Report Provides
- What are the costs by project for the current month?
Report Default Settings
- Filters: Months
- Interval: Monthly
- X-Axis: Projects
- Y-Axis: Total Cost ($)
- Category: Product Categories
- Chart Type: Bar
Example
Cost Current by Projects and Product Categories filtered by: Months (Default View)
EBS Volume Cost
Analyze trends in the cost of EBS volumes
Report Default View
Volume Cost by Days and EBS Volume Status
EC2 Volume reporting gives you insight into your volume costs. This report allows you to see the costs of your volumes based on your defined perspectives, EBS Volume Status, volume type, or even availability zone.
For example, this report is configured to display the volume cost by financial group. It shows the cost of volumes across Production, Development, and Test. There is also a catchall for assets not allocated.
Virtual Machine RI Amortized
Analyze trends in amortized cost of Virtual Machine RIs
Insights This Report Provides
- What is the amortized cost of reserved VMs?
- What is the trend of VM RI amortization by month?
- What is the amortized cost of unused reserved VM (appears as Other or Assets Not Allocated in the graph)?
Report Default Settings
- Interval: Monthly
- X-Axis: Months
- Y-Axis: Amortized Cost by Usage ($)
- Category: Subscription
- Chart Type: Bar
Example
VM RI Amortization by Months and Subscription (Default View)
Variations: In the Category dropdown, specify a category such as Enrollment or Subscriptions. The report shows you amortization by those categories for the reserved VM’s enrollments, subscriptions, etc. so that you can analyze trends.
Example
Reservation cost amortization for current month by Machine Series
Report Settings
- Filters: Months
- X-Axis: Machine Series
- Y-Axis: Amortized Cost by Purchase
Determines the amortized cost of purchased reservations.
Variations:
In the Category dropdown, specify a category such as Enrollment or Accounts. The report shows you amortization by those categories for the reservation’s enrollments, accounts, etc. so that you can analyze trends. Note that if a reservation is purchased through a Shared subscription, the enrollment for that reservation appears as Other in the graph.
Example
VM RI cost amortization by Months and Owner
Report Settings
- Category: Owner
Determine which owners are incurring the highest and lowest amortized cost each month.
Variations In the Category dropdown, specify a Perspective Group such as Environment or Function. The report shows you amortization by those Perspectives so that you can analyze trends.
How Recurring RIs are Apportioned
Explanation on how recurring RIs in AWS are apportioned
Tanzu CloudHealth apportions all recurring Reserved Instances (RIs) to provide you the total cost of ownership for a service or a business grouping. With apportioning enabled, the recurring cost (different from the upfront cost) of all your RIs is included in the hourly fee calculation for each usage line item in the AWS bill. This is particularly useful for chargebacks and showbacks.
For example, you bought an EC2 reservation a year ago at the rate of $2/hr for a period of three years, and another EC2 reservation six months ago, at the rate of $1/hr for a period of one year. Both these reservations are currently active. If you use an applicable instance today, you will receive a line in the bill acknowledging the use and displaying $0 for the cost. While this method accurately reflects the cost for Full Upfront RIs, it is not accurate for No Upfront and Partial Upfront RIs. Apportioning associates the recurring RI cost to your usage allowing fully loaded cost to be allocated to your perspective groups.
Updated Reports
The enhanced reports can be accessed at the following UI tabs:
- Reports > Cost > EC2
- Reports > Cost > RDS
- Reports > Cost > Redshift
- Reports > Cost > ElastiCache
- Reports > Cost > DynamoDB
- Reports > Cost > History (All Reservable Services)
Example of an ElastiCache Report
Consider the following example of an ElastiCache report filtered by Reservation Type, where apportioning was enabled starting May 2022.
Before May 2022, the usage of any No Upfront RI is acknowledged but is not billed under the correct category. The cost related to this usage is displayed under the Unknown section of the report.
Starting May 2022, with apportioning enabled, the cost of all No Upfront RIs used is correctly allocated to the usage. The accurate cost of the RIs used is displayed in the No Upfront row of the report table.
Example of an Elasticsearch Report
Consider the following example of an Elasticsearch report, where apportioning was enabled in May 2022.
Before May 2020, the charges related to the use of compute resources is considered while calculating other Indirect Charges and is displayed under Indirect Charges > Elasticsearch-Other.
With apportioning enabled starting May 2022, the correct cost of all compute resources used is calculated and displayed under the Elasticsearch-Compute section of the report.
Azure Burndown
Analyze trends in the balance remaining from the original enrollment commitments
Insights This Report Provides
- What is the balance remaining from the original enrollment commitments?
- What is the trend of spend for enrollment commitments over time?
Report Default Settings
- Filters: Months
- Interval: Monthly
- X-Axis: Monthly
- Y-Axis: Balance ($)
- Chart Type: Bar
Example
Cost Burndown by Months and Enrollment (Default View)
Standard Y-Axis Measures
Description of common Y-axis measures in Reports
Amortized Cost ($)
This measure shows the Amortized Cost of all reservation purchases and Savings Plan costs. The data source for this measure is the AWS Cost and Usage report (CUR). Tanzu CloudHealth does not calculates this value, instead only aggregating it over the time period that you select in your report. This measure can be used in addition to other cost metrics such as Cost or Recurring costs to provide a “fully loaded” operating cost.
Also see Reports > Cost > Amortization. This preset report includes all AWS Services, except reservation prepay charges and Savings Plan upfront fees, plus Amortization. Amortized Cost supports Billing Rules.
Monthly Projected Cost ($)
Tanzu CloudHealth calculates the Projected Cost as the sum of the following individual costs:
- Already incurred costs: Current month’s month-to-date (MTD) costs, excluding support & unused RI costs
- Projected unused RI costs: Previous month’s unused RI costs. The assumption here is that the same amount of unused RI costs will be incurred in the current month.
- Projected recurring costs:
(Number of days remaining in the current month) x (Weighted average of previous and current month's recurring costs). The assumption here is that for every day in the remainder of the month, the daily average recurring costs will be similar to those incurred in the previous month / MTD costs. - Projected support costs
- For direct customers who do not receive bills from a Partner, this cost is derived from the sum of the projected non-support costs as follows: (a) AWS Support cost is increased as a proprotion of the total cost, (b) the “projected non-support costs” are used to project “support costs.”
- For customers who receive bills from a Partner, this cost is derived from previous month’s support costs. The costs are adjusted to reflect custom support costs in Partner-generated bills. It is also assumed that the support costs are similar to those incurred in the previous month.
Compute Cost Before RIs ($)
This measure shows EC2 compute service only and recalculates the hourly usage to show the cost as if all non-spot EC2 instance usage had been charged at On Demand pricing, without the benefit of applicable RIs. This is a great way of seeing the savings impact of making RI purchases for EC usage.
Recurring Cost ($)
This measure takes Total Costs and removes Prepaid RIs, Support Costs, and other one-time program or other one time fees to provide a view of your ongoing operational costs.
Cost ($)
This measure includes all AWS Service Items as they appear on your AWS invoice. This includes ongoing services like EC2 Compute, EBS, RDS and S3 storage (and all other services) as well as specific charges such as Prepaid RI payments, AWS program and Support Fees. This provides you with a “cash” view of what you are being charged for by AWS in a given period. Please note that some manual billing adjustments may not be included in your detailed billing report by AWS and thus not reflected. Also, some charges are billed as of the 1st day of a given month (i.e. Support).
Cost before Reallocation (Original) ($)
Cost without support for Cost Reallocation.
GCP Cost History
Note Effective December 15, 2023, Google Cloud product names and SKU descriptions changed from
egressoringresstodata transfer. The new names will include modifying terms such asoutboundoroutandinboundorin. The Tanzu CloudHealth platform report labels have been updated historically to reflect the latest product names of Google Cloud. For more details, see the Renaming Egress to Data Transfer FAQ section.
Analyze historical cost trends by type
- This report uses BigQuery as its data source. If you have not enabled BigQuery, this report won’t display accurate data.
- Tanzu CloudHealth has mapped all existing GCP product labels with GCP service label names in all OLAP reports. You can see the updated categories for the past 13 months.
Insights This Report Provides
- What is the historical trend of spending by type?
Report Default Settings
- Interval: Monthly
- X-Axis: Months
- Y-Axis: Total Cost ($)
- Category: Product Categories
- Chart Type: Bar
What is the Difference Between the GCP Cost History and History Invoice Reports?
The new GCP Cost History report and the History Invoice report are similar in content and use the same data source, the BigQuery export. However, there are several key differences between the two reports. As a result, monthly cost totals are not expected to match between the two reports.
| Cost History | Invoice History | |
|---|---|---|
| Data Source | Usage Start Time column in the BigQuery Export | Invoice Month column in the BigQuery export |
| Granularity | Monthly, weekly, and daily | Monthly |
| Included Costs | Does not include taxes and invoice adjustments | Includes taxes and invoice adjustments |
| Expected Use Case | View daily cost trends | View monthly chargebacks |
Example
Cost History by Months and Product Categories (Default View)
VMware Cloud Current Billing Period (Beta)
Daily costs trends and cost drivers for the current billing period
Insights This Report Provides
- What is the daily cost trend for the current billing period?
- What are main drivers of cost for the current billing period?
The billing period is determined by the invoice date in your VMware Cloud Services’ account.
Report Default Settings
- Filters: Days
- Interval: Daily
- X-Axis: Days
- Y-Axis: Total Cost ($)
- Category: Services
- Chart Type: Bar
Example
Current Billing Period Cost by Days and Service Category filtered by: Days (Default View)
Navigate to Reports > Cost > Current Billing Period.
VMware Cloud Previous Billing Period (Beta)
Daily cost trend and cost drivers for the previous billing period
Insights This Report Provides
- What is the daily cost trend for the previous billing period?
-
What are main drivers of cost for the current billing period?
The billing period is determined by the invoice date in your VMware Cloud services’ account.
Report Default Settings
- Filters: Days
- Interval: Daily
- X-Axis: Days
- Y-Axis: Total Cost ($)
- Category: Services
- Chart Type: Bar
Example
Previous Billing Period Cost by Days and Service Category filtered by: Days (Default View)
Navigate to Reports > Cost > Previous Billing Period.
Oracle Cloud Cost History
Analyze historical cost trends by type
Insights This Report Provides
- Historical trend of Cost by months and Service category.
- The Cost associated with each service category over the given time period.
Even though Oracle Bills are uploaded daily, it is observed that the billing data can be T-2 days old. Therefore, you might see a delay of up to 2 days in the Oracle daily cost reports data. For example, a bill generated on July 8th will have data only up to July 5th. This is expected behavior.
Report View
Switch the Cost report view between Daily, Monthly, and Weekly. Your Interval selection determines how the data is defined on the X-Axis:
- Daily: The last two months of data
- Weekly: The last 52 weeks
- Monthly: The last 13 months
Filter Menu
You can use the following standard filter options to view the report as per your business needs.
- Days/Weeks/Months (Based on specified Interval)
- Services
- Regions
- Tenancies
- Compartments
- Organization specific Perspectives
Report Default Settings
Cost History by Months and Services
- Interval: Monthly
- X-Axis: Months
- Y-Axis: Total Cost ($)
- Category: Services
- Chart Type: Bar
Cost History by Months and Reservation Type
You can segregate the spend on Monthly Flex and Pay As You Go (PAYG) using ‘Reservation Type’ in the category.
- You can select multiple filter options as per your analysis needs.
- The perspectives are labeled with the letter P.
- TTanzu CloudHealth provides 13 months of historical data, starting from May 1st, 2020, or from the time the tenant was created in the Oracle Cloud, whichever occurs later.
Oracle Cloud Budget vs. Actual
Compare budget vs. actual spend and analyze trends in actual spend
Insights This Report Provides
- What is the budgeted spend compared to the actual spend?
- What is the trend of budget vs. actual spend?
- What is the variance (Actual - Budget) and rollover trend?
- For the most recently updated categorized budget, what is the budget vs. actual trend?
Report Default Settings
- Display Graph: By Amount ($) Computed
- Data Interval: Month to Month
- Budget: Annual
- Show Variance: Enabled
Examples
Budget Vs. Actual (Default View)
Actual Spend as Percentage of Budget
Report Settings
- Display Graph: By % of budget
Select By % of Budget in Display Graph and click Update to visualize your spend trend as a percentage of the budget.
Budget Vs. Actual for Specific Time Period
Report Settings
- Data Interval: Select a month range in Specific time periods option.
Select Data Interval and click Update to see data for a specified time period.
Budget Vs. Actual for Specific Perspective
If you have configured a budget categorized by perspective in the Platform, you can visualize the budget vs. actual trend for that perspective.
Select a perspective from the Budget dropdown, select the perspective groups from the Group dropdown , and click Update.
If you have budgets categorized by multiple perspectives, this report allows you to select only the perspective for which the categorized budget was updated most recently.
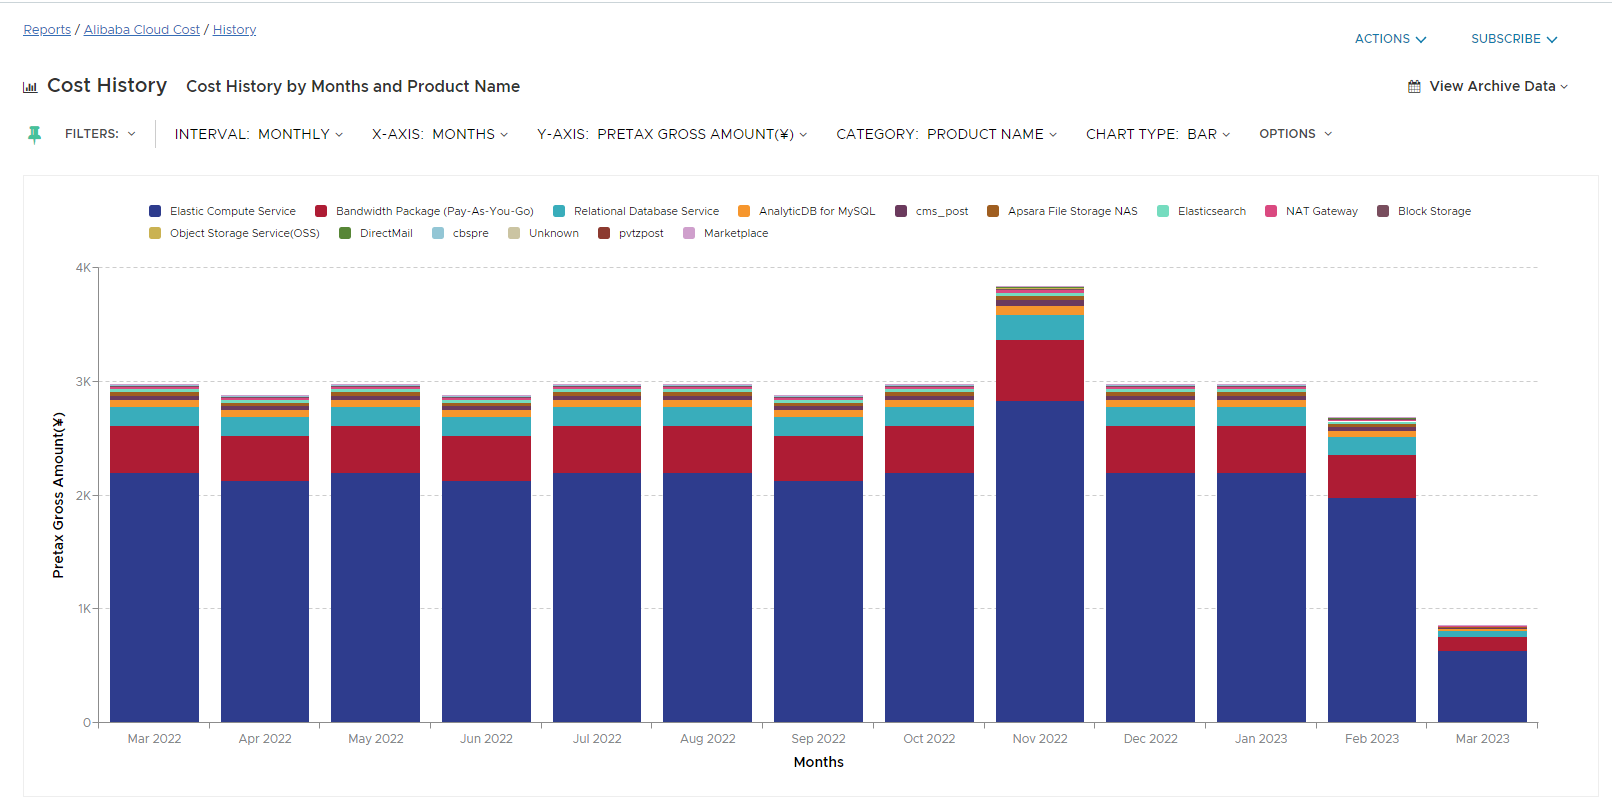
Alibaba Cloud Cost History
Insights This Report Provides
- Historical trend of Cost by months and Service category.
- The Cost associated with each service category over the given time period.
Report View
Switch the Cost report view between Daily, Monthly, and Weekly. Your Interval selection determines how the data is defined on the X-Axis:
- Daily: The last two months of data
- Weekly: The last 52 weeks
- Monthly: The last 13 months
Filter Menu
You can use the following standard filter options to view the report as per your business needs.
- Days/Weeks/Months (Based on specified Interval)
- Product Name
- Accounts
- Regions
- CostCenter
- OwnerAccounts
- Subscription
Report Default Settings
Cost History by Months and Services
- Interval: Monthly
- X-Axis: Months
- Y-Axis: Pretax Gross Amount (¥)
- Category: Product Name
-
Chart Type: Bar