New Kubernetes Reports
Kubernetes Overview Report
Have you configured your reports? Report configuration helps you derive better insights quickly in the VMware Tanzu CloudHealth platform. See Configure Container Infrastructure for Cost Analysis.
It can take up to 24 hours after Collector deployment to start seeing meaningful reporting in the platform.
Kubernetes costs and usage visibility is critical for organizations while planning for chargeback/showback workflows or identifying cost or usage spikes in the environment. Tanzu CloudHealth brings together key reports in the platform to a central location with Kubernetes Overview. These usage reports are applicable for any Kubernetes environment, including GCP and Data Center. Kubernetes cost reporting that associates the Kubernetes usage data to the cloud bill is supported only for AWS, Azure and GCP.
To access Kubernetes Overview report on the platform, navigate to Reports > Kubernetes > Overview.

What Is the Kubernetes Overview Report
The Kubernetes Overview Report brings several key reports into a centralized dashboard enabling you to understand the cost and usage trends in aggregate, per cluster and namespace.
How to Use the Kubernetes Overview Report
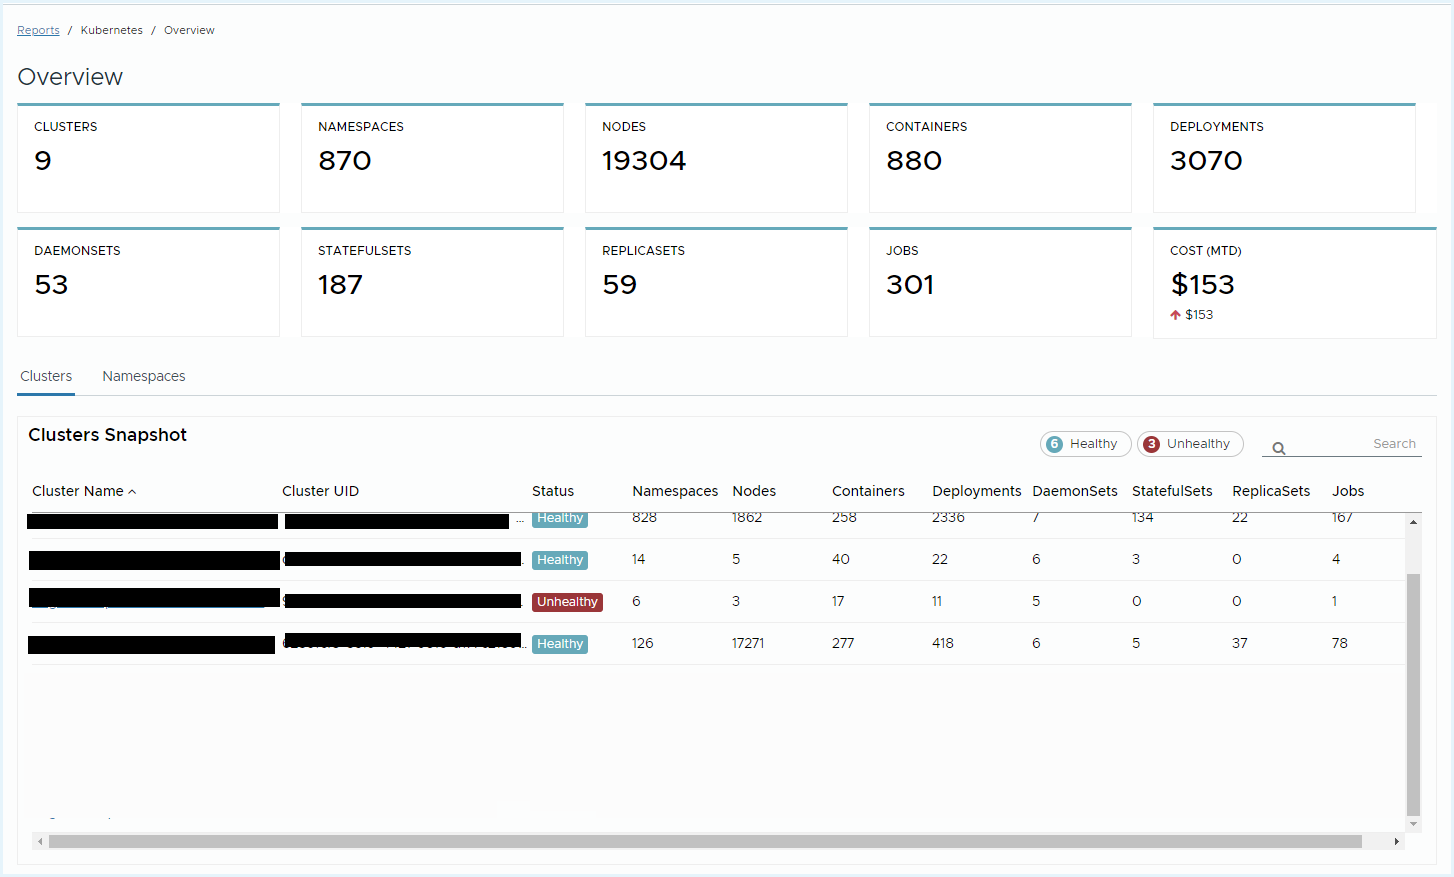
At the top of the report, you can view the data segmented by cluster or by namespace.
Based on your selection, you will see an executive summary, cluster/namespace snapshot, containers cost history and container usage charts on the primary page.
From there, you can drill down into any cluster or namespace by selecting a cluster or namespace from the Snapshot table.

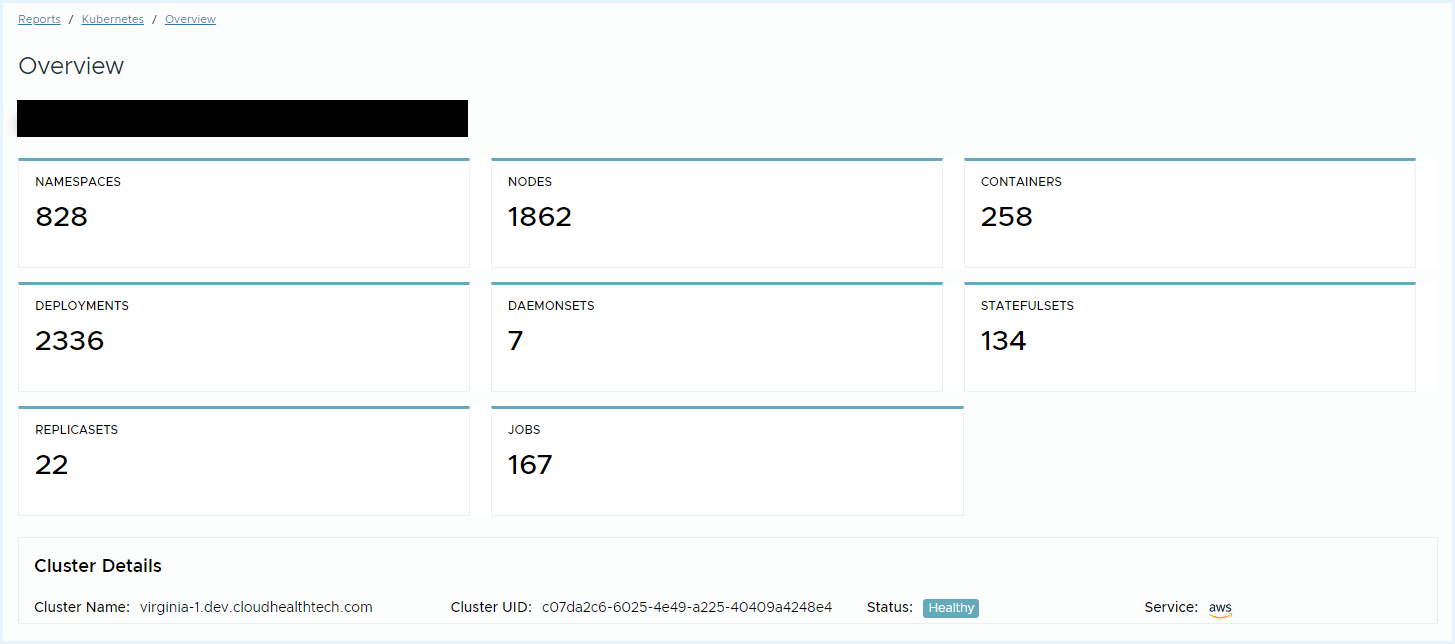
In this scenario, us1-prod cluster was selected, where we see a filtered executive summary, cluster details, and usage reports. In this view, you can better understand the usage trends over time for this cluster.
Upon clicking the View icon, the system will link out to the underlying OLAP chart, where you can leverage many more filters, categorizations, and continue to explore.
Glossary
Executive Summary Tiles
- Clusters: The number of clusters Tanzu CloudHealth is collecting data from via the Tanzu CloudHealth collector for the day.
- Namespaces: The day’s count of namespaces Tanzu CloudHealth is collecting via the Tanzu CloudHealth collector.
- Nodes: The day’s count of nodes Tanzu CloudHealth is collecting via the Tanzu CloudHealth collector for the day.
- Pods: The day’s count of pods Tanzu CloudHealth is collecting via the Tanzu CloudHealth collector.
- Cost (MTD): The aggregate total cost of your Kubernetes clusters as per the configured Clusters Perspective in your Settings.
The count for Clusters, Namespaces, Nodes, and Pods are reset at the end of the day.
Cluster/Namespace Snapshot
- Cluster Name: The user defined name for the cluster.
- Cluster ID: The cluster ID for the cluster.
- Clusters: The most recent count of clusters the namespace spans (collected via the Tanzu CloudHealth collector).
- Namespaces: The most recent count of namespaces in the cluster (collected via the Tanzu CloudHealth collector).
- Nodes: The most recent count of nodes in the cluster/namespace (collected via the Tanzu CloudHealth collector).
- Pods: The most recent count of pods in the cluster/namespace (collected via the Tanzu CloudHealth collector).
- Status: The health of the Tanzu CloudHealth collector running on the cluster. It is important that all clusters are configured and are in a healthy state to gain proper visibility of your Kubernetes footprint.
- Kubernetes Version: The version of Kubernetes running on the cluster.
Containers Reports
- Containers Cost History: A daily cost report categorized by the cluster/namespace perspective selected in the Kubernetes Configuration page.
- Kubernetes Resources - CPU: A daily CPU usage report categorized by cluster/namespace.
- Kubernetes Resources - Memory: A daily memory usage report categorized by cluster/namespace.
Kubernetes Cost History Report
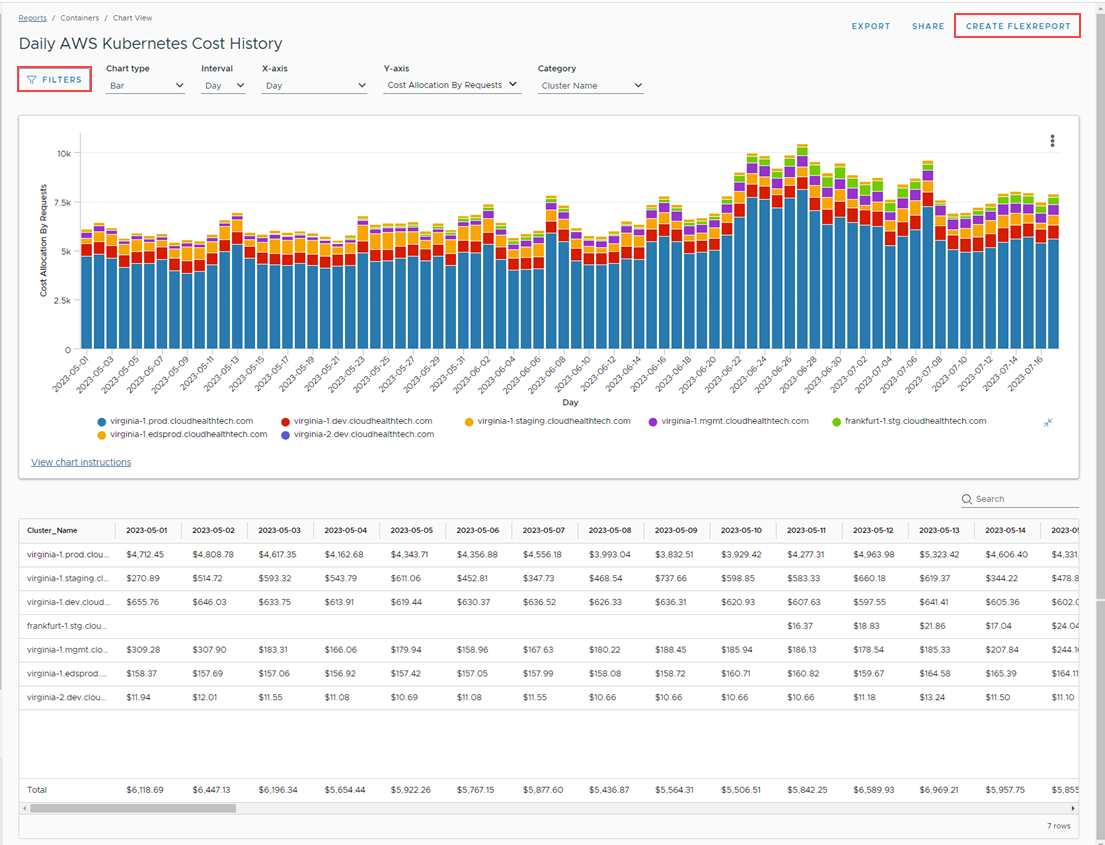
The Kubernetes Cost History is the FlexOrg enabled report that provides a simpler method of automatic cost reallocation. This report is accessible to all FlexOrg users including the Sub- OU users, and is available for AWS and Azure clouds.
You can choose to allocate container cost costs by request or actual usage (CPU/Memory).
To access the report, navigate to Reports > Kubernetes > Cost History.
Report Default Settings
- Interval: Daily
- X-Axis: Days
- Y-Axis: Cost Allocation by request
- Category: Cluster Name
- Chart Type: Bar
The time interval dimension that you select determines how the data is defined on the X-Axis:
- Daily: Displays the past 90 days of data
- Monthly: Displays the last 13 months of data
- Hourly: Displays the past 7 days of data

The table below the chart displays the cluster cost for the selected Category.
You can Export the report in a CSV file format and can also Share it via a link.
Use Filters to allocate the cost to the specified Kubernetes categories.
Cost Allocation in the Kubernetes Cost History Report
Tanzu CloudHealth allows you to allocate the container cost by request, by actual usage (CPU/Memory), or both.
- If you select allocation by request, 100% of the costs are allocated to the clusters. Cost Allocation by Requests is calculated as
Requests/ Total Requested. - If you select allocated by actual usage, unused capacity costs will not be allocated. Cost Allocation by Usage is calculated as
Average Usage/Total Allocated.
Category Options
The following predefined category options are available for you to automatically reallocate the cluster cost to different Kubernetes groupings.
- Month
- Cluster Name
- Container Name
- Container Image
- Namespace Name
- Cloud Account ID
- Cloud Account Name
- Workload Name
- Workload Type
- Deployment
- StatefulSets
- DaemonSet
- Job
- ReplicaSet
Create FlexReport
You can create a FlexReport using the same measures and dimensions selected in the Kubernetes Cost History report. Clicking Create FlexReport located at the top-right corner of the report redirects you to the FlexReports page. For more information, see FlexReport documentation.
You can also access the Kubernetes Cost History Report via the FlexReport APIs. For more information, see the FlexReport API documentation.
Note FlexOrgs Sub-OU users will only be able to view data they have permission to access.