


This topic describes how VMware Tanzu Kubernetes Grid Integrated Edition (TKGI) implements sinks for collecting logs and metrics from Kubernetes worker nodes and workloads.
For step-by-step instructions on creating sinks in TKGI, see Creating and Managing Sink Resources.
Overview
A sink collects logs or metrics about Kubernetes worker nodes in a TKGI deployment and workloads that are running on them.
For more information, see:
- Sink Types below
- Sink Architecture below
Sink Types
You can create two types of sinks:
- Log sinks
- Metric sinks
See the table below for information about these sink types.
| Sink Type | Sink Resource | Description |
|---|---|---|
| Log sink | ClusterLogSink |
Forwards logs from a cluster to a log destination. Logs are transported using one of the following:
|
| Log sink | LogSink |
Forwards logs from a namespaced subset within a
|
| Metric sink | ClusterMetricSink |
Collects and writes metrics from a cluster to specified outputs using input and output plugins. |
| Metric sink | MetricSink |
Collects and writes metrics from a namespace within a cluster to specified outputs using input and output plugins. |
Sink Architecture
TKGI-provisioned Kubernetes clusters include an observability manager that manages log sink and metric sink configurations within a cluster.
The following diagram details TKGI cluster observability architecture:

View a larger version of this image.
In the Tanzu Kubernetes Grid Integrated Edition tile > In-Cluster Monitoring:
- Enable Metric Sink Resources enables metric sinks.
- Enable Log Sink Resources enables log sinks.
- Enable node exporter on workers forwards additional infrastructure metrics.
Setting these check boxes in Ops Manager directs how BOSH configures the observability manager.
For more information about enabling log sinks and metrics sinks, see (Optional) In-Cluster Monitoring in the Installing topic for your IaaS.
Log Sink Architecture
The TKGI log sink aggregates workload logs and forwards them to a common log destination.
The following diagram details TKGI log sink architecture:
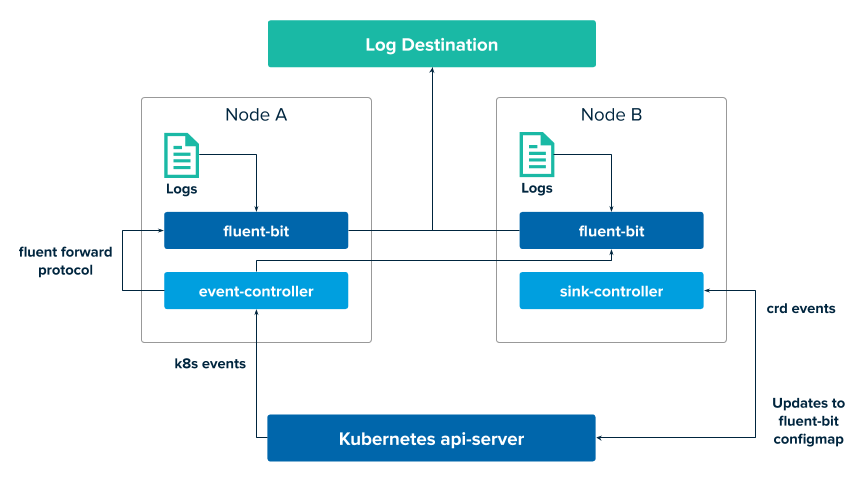
View a larger version of this image.
Logs are monitored and aggregated by a Fluent Bit DaemonSet running as a pod on each worker node.
An event-controller collects Kubernetes API events and sends them to a second Fluent Bit daemon pod for aggregation.
All aggregated log entries are marshaled to a common log destination.
Note: When sinks are added or removed, all of the Fluent Bit pods are refreshed with new sink information.
Metric Sink Architecture
The TKGI metric sink aggregates workload metrics and forwards them to a common metrics destination.
The following diagram details TKGI metric sink architecture:

View a larger version of this image.
A metric sink collects and writes metrics from a cluster to specified outputs using input and output plugins.
Workload metrics are monitored by a set of third-party plugins. The plugins forward the metrics to a Telegraf service pod.
A pair of kubelets monitors Kubernetes and forwards Kubernetes metrics to a pair of Telegraf service pods.
If Node Exporter is enabled on the worker nodes in the Tanzu Kubernetes Grid Integrated Edition tile, a Node Exporter DaemonSet is included in all clusters. For more information about Node Exporter metrics, see the Node Exporter repository in GitHub.
To define the collected unstructured metrics, a metric-controller monitors Kubernetes for custom resource definitions and forwards those definitions to the Telegraf services.
The Telegraf services collect, process, and aggregate gathered metrics. All aggregated metrics are marshaled to an additional plugin for forwarding to a third-party application.
Note: When sinks are added or removed, all of the Telegraf pods are refreshed with new sink information.
