


This topic describes the VMware Customer Experience Improvement Program (CEIP) and the Telemetry Program used in the Tanzu Kubernetes Grid Integrated Edition (TKGI) tile.
Overview
The CEIP and Telemetry program allows VMware to collect data from customer installations to improve the Tanzu Kubernetes Grid Integrated Edition experience. Collecting data at scale allows VMware to identify patterns and warning signals in Tanzu Kubernetes Grid Integrated Edition installations.
Participation Levels
You can configure Tanzu Kubernetes Grid Integrated Edition to use one of the following CEIP and Telemetry participation levels:
- None: This level deactivates collection of Kubernetes cluster usage data.
- Standard: (Default) This level forwards usage data to VMware anonymously. Your data is used to inform the ongoing development of Tanzu Kubernetes Grid Integrated Edition.
- Enhanced: This level forwards usage data to VMware and allows VMware to associate potential Tanzu Kubernetes Grid Integrated Edition configuration issues with individual customers.
Note: Tanzu Kubernetes Grid Integrated Edition does not collect any personally identifiable information (PII) at either participation level. For a list of the data Tanzu Kubernetes Grid Integrated Edition collects, see Data Dictionary.
Configure CEIP and Telemetry
To configure CEIP and Telemetry, see the CEIP and Telemetry section of the installation topic for your IaaS:
- Installing Tanzu Kubernetes Grid Integrated Edition on vSphere
- Installing Tanzu Kubernetes Grid Integrated Edition on vSphere with NSX-T
- Installing Tanzu Kubernetes Grid Integrated Edition on AWS
- Installing Tanzu Kubernetes Grid Integrated Edition on Azure
- Installing Tanzu Kubernetes Grid Integrated Edition on GCP
Proxy Communication
If you use a proxy server, the Tanzu Kubernetes Grid Integrated Edition proxy settings apply to outgoing telemetry data.
To configure Tanzu Kubernetes Grid Integrated Edition proxy settings for CEIP and Telemetry and other communications, see the following:
- For AWS, see Using Proxies with Tanzu Kubernetes Grid Integrated Edition on AWS.
- For vSphere, see Networking in Installing Tanzu Kubernetes Grid Integrated Edition on vSphere.
- For vSphere with NSX-T, see Using Proxies with Tanzu Kubernetes Grid Integrated Edition on NSX-T.
System Components
The CEIP and Telemetry programs use the following components to collect data:
-
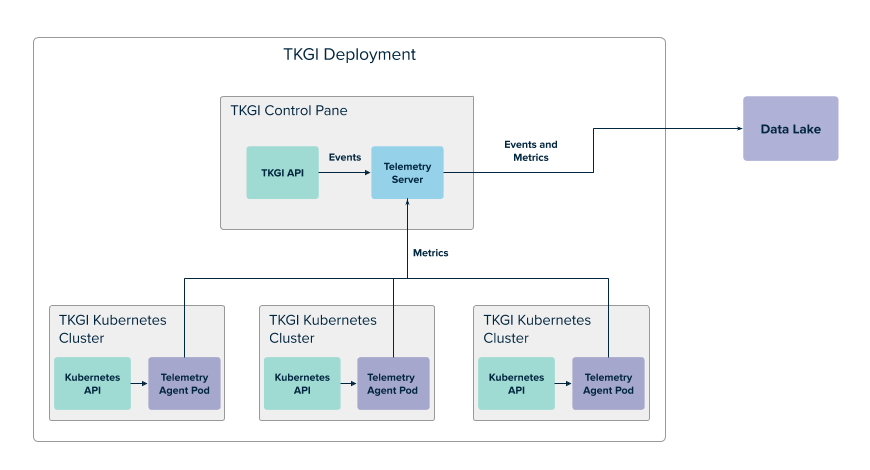
Telemetry Server: This component runs on the TKGI control plane. The server receives telemetry events from the TKGI API and metrics from Telemetry agent pods. The server sends events and metrics to a data lake for archiving and analysis.
-
Telemetry Agent Pod: This component runs in each Kubernetes cluster as a deployment with one replica. Agent pods periodically poll the Kubernetes API for cluster metrics and send the metrics to the Telemetry server.
The following diagram shows how telemetry data flows through the system components:
View a larger version of this image.
Data Dictionary
For information about TKGI Telemetry collection and reporting, see the TKGI Telemetry Data spreadsheet, hosted on Google Drive.
