If you see a discrepancy between the usage reported in the Subscription information page and what you think you’re actually consuming, there are a few things to look for.
Problem
Sometimes the usage that appears in the Subscription information page might differ from what you expect to see. There are a few reasons for this and some solutions.
Cause
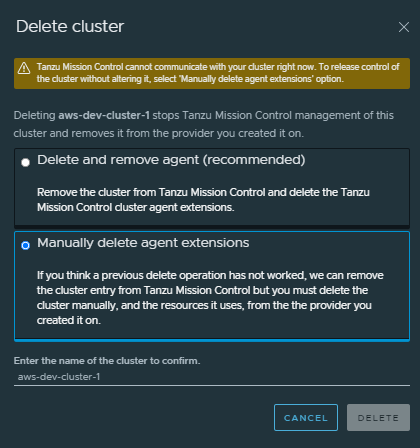
Do you have disconnected clusters? These clusters appear on the Clusters page with a health status of “disconnected.” Usually this happens because you delete a cluster directly from the infrastructure.
Are you counting CPU Capacity or Allocatable CPU? Tanzu Mission Control is licensed according to how many CPUs, vCPUs, or cores you place under management. So the Subscription information page tracks overall CPU Capacity of your clusters, including any space that’s reserved for system daemons that power the OS and Kubernetes. On other pages in Tanzu Mission Control, like the cluster details page, you see Allocatable CPU reported, which is what’s left over for your nodes after system-reserved, kube-reserved, and eviction-threshold have been subtracted from your CPU Capacity. Learn more about CPU Capacity and Allocatable CPU from Kubernetes.
How are you calculating usage? Tanzu Mission Control collects Kubernetes CPU information and approximates 2 Kubernetes CPUs = 1 Core or 2 vCPUs. For CPU-based subscriptions in vSphere environments, you can have up to 32 cores or 64 vCPU per CPU. However, you need to license your entire host to purchase CPU-based vSphere subscriptions.
If the cause of the problem is that you have disconnected clusters, follow the solution steps to delete the disconnected clusters.
 ) to the left of the disconnected cluster and choose