


Page last updated: August 27, 2021
This topic describes how to install and configure VMware Tanzu Observability by Wavefront Nozzle.
Create a Wavefront Account
The VMware Tanzu Observability by Wavefront Nozzle requires that you have a Wavefront account with an API access token. If you need an account, contact Wavefront Sales.
Install and Configure VMware Tanzu Observability by Wavefront Nozzle in Ops Manager
-
Download the product file from the Pivotal Network.
-
Navigate to the Ops Manager Installation Dashboard and click Import a Product to upload the product file.
-
Under the Import a Product button, click + next to the version number of VMware Tanzu Observability by Wavefront Nozzle. This adds the tile to your staging area.
-
Click the newly added Wavefront by VMware Nozzle for PCF tile.
-
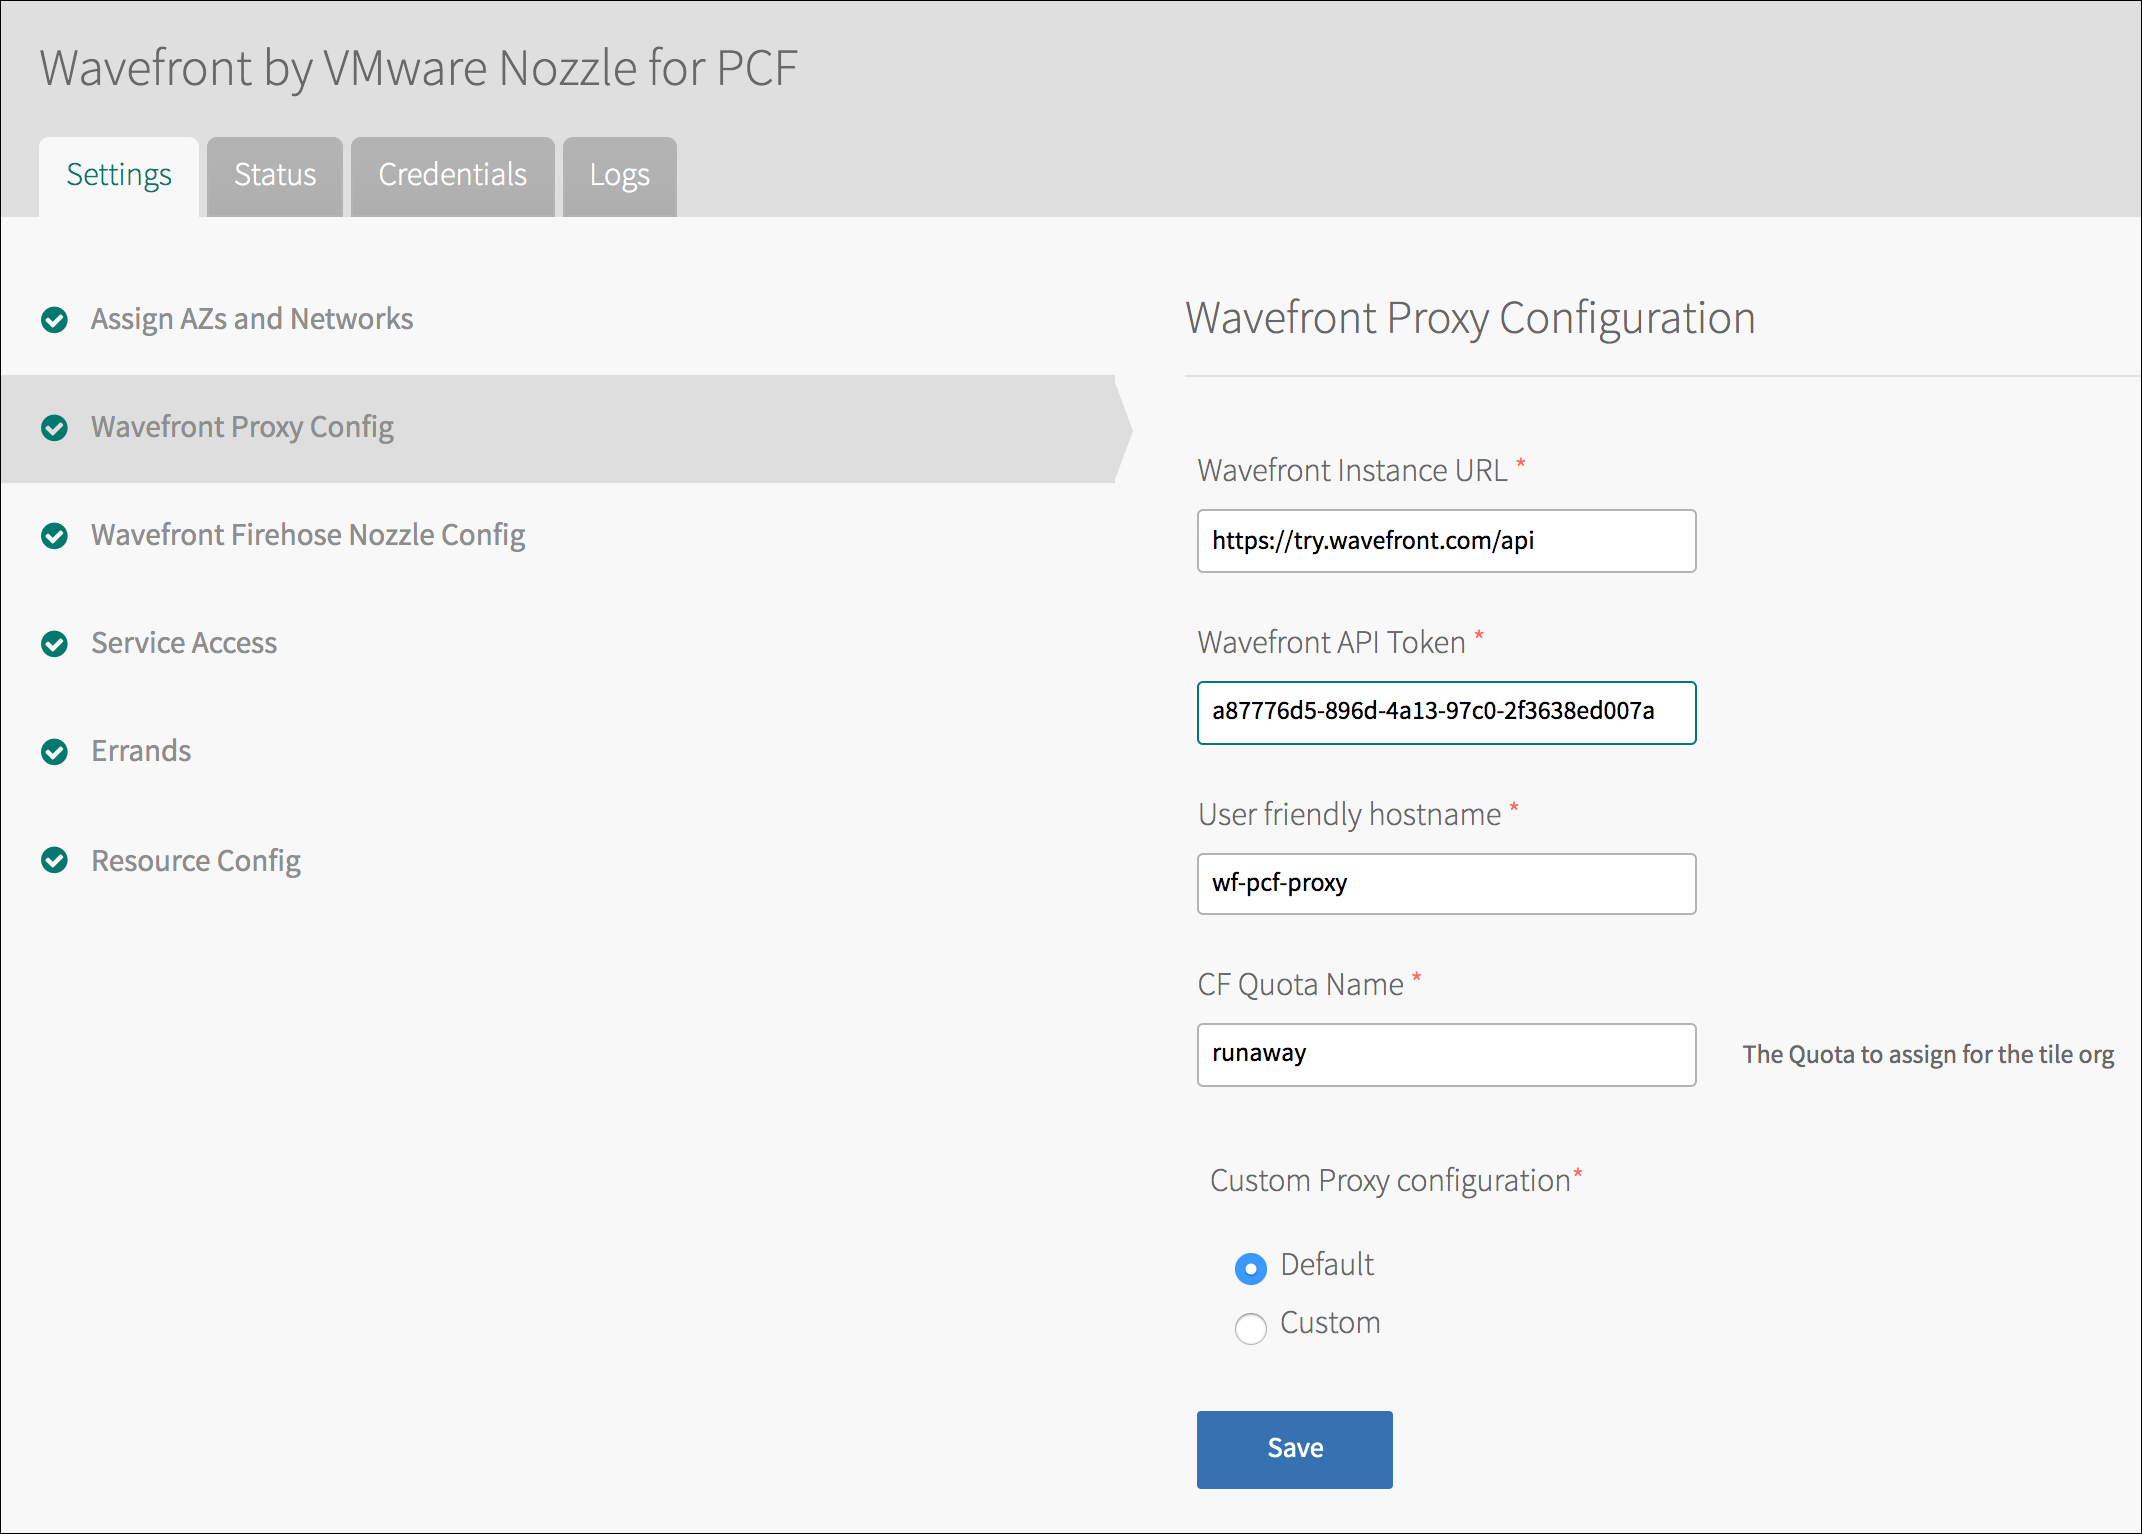
Click Wavefront Proxy Config.
-
Enter the following in the Wavefront Proxy Config page:
- Wavefront Instance URL: A URL, such as
https://YOUR_INSTANCE.wavefront.com/api. -
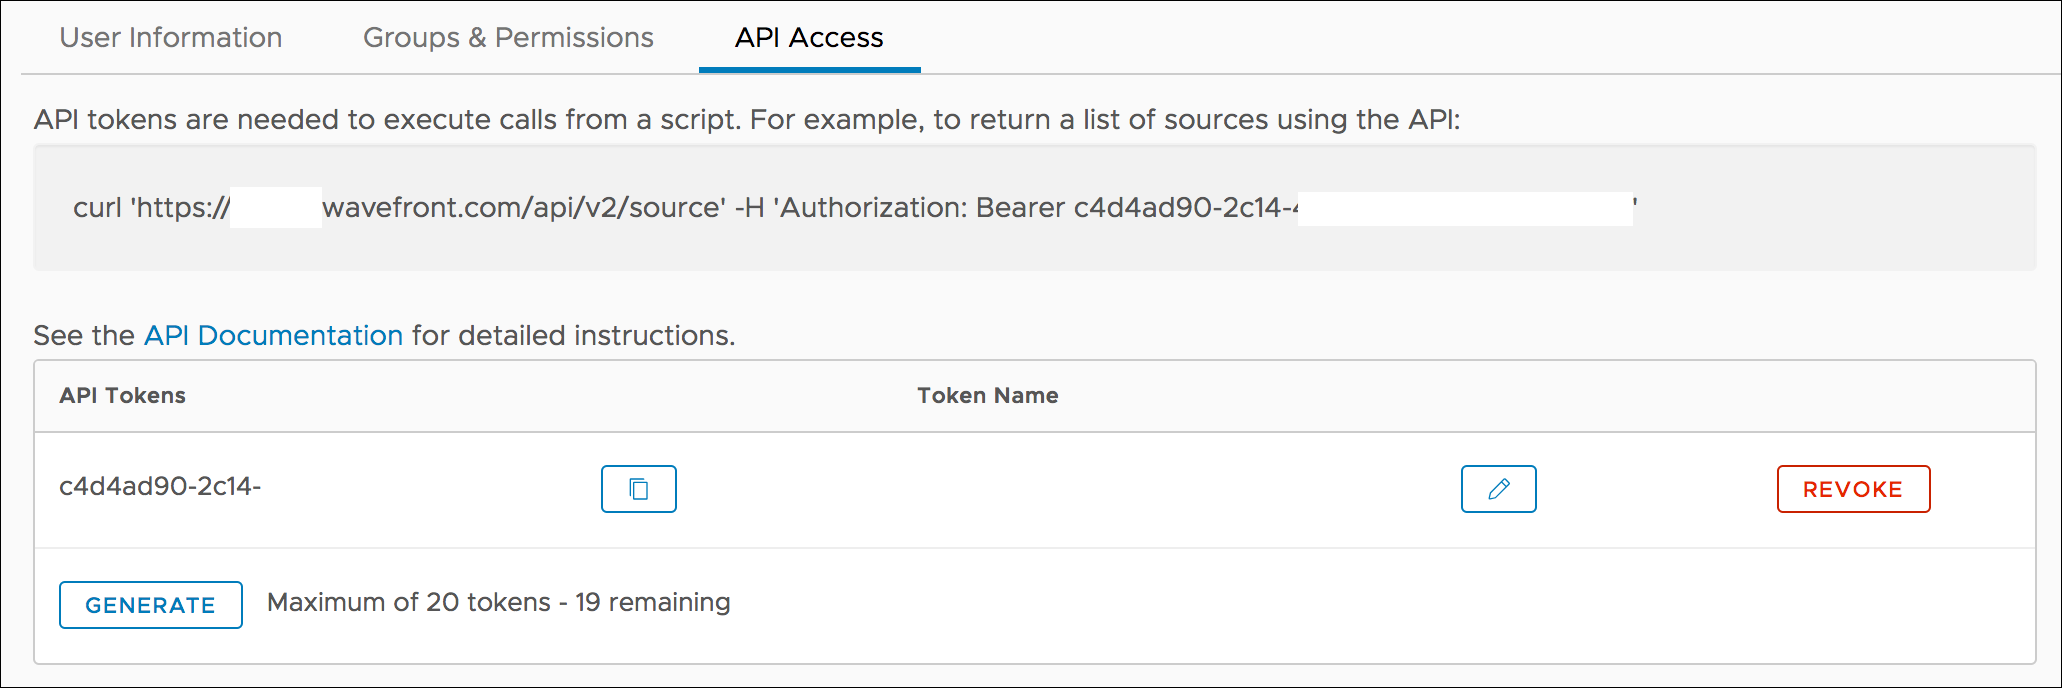
Wavefront API Token: An API access token from the profile page on your Wavefront instance. To access the API token:
- Click the gear icon on the top right in Wavefront.
- Select your username.
- Click the API Access tab for the API Token:
-
User friendly hostname: A unique hostname for the proxy such as
DOMAIN-pcf-proxy. - CF Quota Name: A CF org quota with at least 20 GB memory and a route and port available.
- Wavefront Instance URL: A URL, such as
-
Under Custom Proxy Configuration, select the proxy configuration to use.
- Choose Default for the default proxy settings.
-
You can optionally override the proxy configuration and preprocessor rules and use Custom settings.
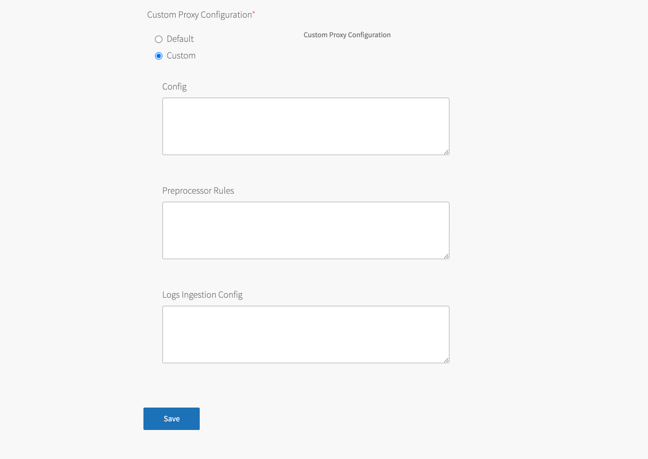
- Add the custom proxy configuration to the Config text box.
This configuration does not consider some of the custom properties. The directivesserver,hostname,token,pushListenerPorts,opentsdbPorts,idFile,buffer, andpreprocessorConfigFileare ignored. - In the Preprocessor Rules text box, enter the Wavefront preprocessor rules. For details, see Configuring Wavefront Proxy Preprocessor Rules.
- In the Logs Ingestion Config text box, enter the Wavefront log ingestion configuration. For details, see [Configuring the Wavefront Proxy to Ingest Log Data] (https://docs.wavefront.com/integrations_log_data.html#configuring-the-wavefront-proxy-to-ingest-log-data).
- Add the custom proxy configuration to the Config text box.
-
Click Save.
-
Click Wavefront Firehose Nozzle Config.
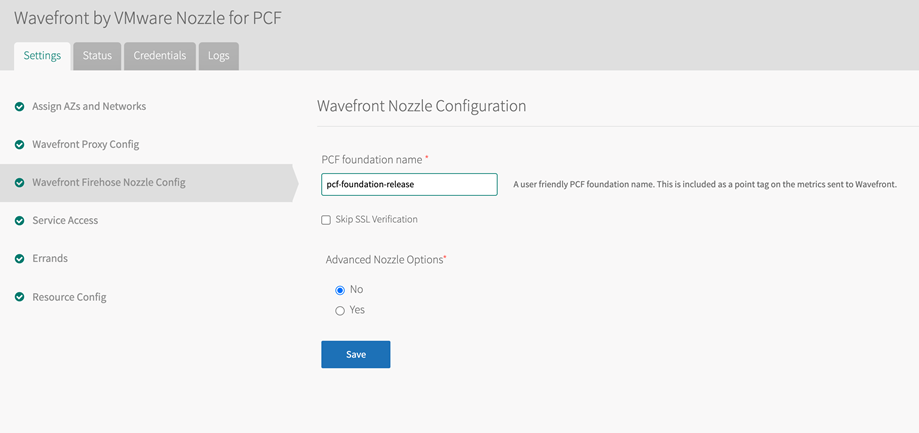
- Enter the following on the Wavefront Firehose Nozzle Config page:
- PCF foundation name: A user-friendly VMware Tanzu PCF foundation name. This is included as a point tag on the metrics sent to Wavefront.
- Skip SSL Verification: Select to skip SSL validation. Use this option in non-production environments.
- Under Advanced Nozzle Options select the settings to use.
- Select No for the default nozzle settings.
- Select Yes and configure advanced nozzle options.
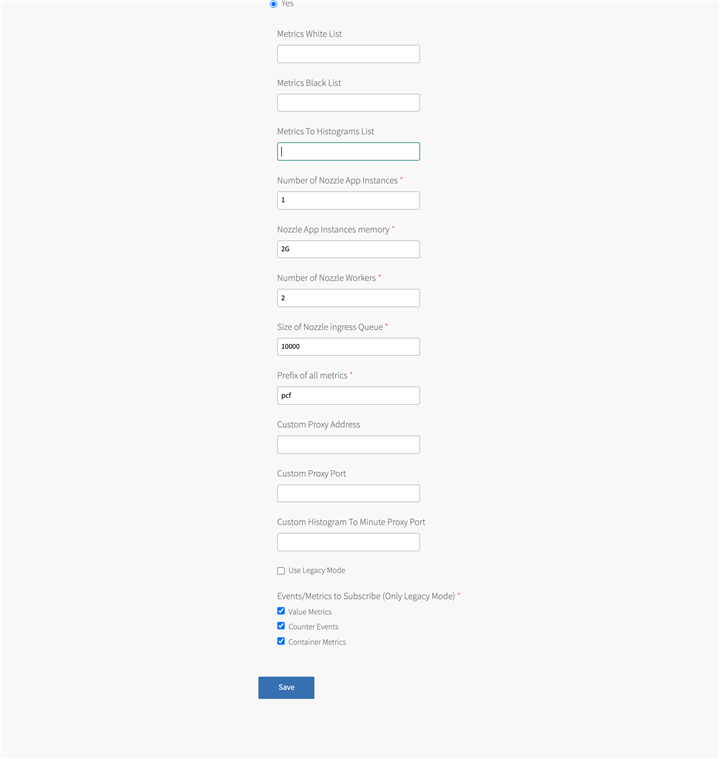
- Metrics White List: Enter a comma-separated allowlist of glob patterns. Only metrics with names matching the allowlist are reported.
- Metrics Black List: Enter a comma-separated blocklist of glob patterns. Metrics with names matching the blocklist are dropped.
- Metrics to Histograms List: Enter a comma-separated allowlist of glob patterns to control the flow of high velocity metrics. Only metrics with names matching the allowlist are converted Histograms distribution.
- Number of Nozzle App Instances: By default, only one firehose nozzle app instance will be deployed. You can enter a different number and deploy multiple firehose nozzle app instances.
- Nozzle App Instance Memory: By default, 2 GB of memory are allocated. You can increase the number.
Note: Enter an integer followed by either M (for megabytes), or G (for gigabytes). For example, 2G, 512M, and so on.
- Number of Nozzle Workers: The number of concurrent workers for each firehose nozzle app instance.
- Size of the Nozzle Ingress Queue: The maximum number of events allowed to store in the firehose nozzle queue.
- Prefix of all metrics: A prefix that will be added to all the metrics. The default is
pcf.
Note: If you change the prefix, the out-of-the-box dashboards may fail to load.
- Custom Proxy Address: Allows you to provide the address of an externally deployed Wavefront proxy.
Important: To use a custom proxy, you must make sure that the ports
pushListenerPortsandhistogramMinuteListenerPortsare enabled in the custom proxy configuration in thewavefront.conffile. Provide the values of these ports in the Custom Proxy Port and Custom Histogram to Minute Proxy Port text boxes. - Custom Proxy Port: Allows you to provide the proxy port of an externally deployed Wavefront proxy.
You can find the custom proxy port in thewavefront.conffile, listed as a value of thepushListenerPorts. The default port value is 2878. - Custom Histogram to Minute Proxy Port: Provide the Histogram port of the custom proxy to use and send the metrics listed in the Metrics to Histograms to this port.
You can find the histogram port in thewavefront.conffile, listed as a value of the propertyhistogramMinuteListenerPorts. The default port value is 40001. - Use Legacy Mode: Allows you to use a legacy version of the API.
- Enter the following on the Wavefront Firehose Nozzle Config page:
-
Click Save.
-
Return to the Ops Manager Installation Dashboard and click Apply changes to install VMware Tanzu Observability by Wavefront Nozzle tile.
Configure Service Instance for Wavefront Service Broker for VMware Tanzu
Follow the steps below to enable developers to send app metrics to the Wavefront Proxy:
- To provision a wavefront-proxy service instance:
cf create-service wavefront-proxy standard SERVICE_INSTANCE_NAME. - To bind apps to the service instance:
cf bind-service APP_NAME SERVICE_INSTANCE_NAME. - For information about how apps can send metrics to the Wavefront proxy, see the cloud-foundry-sampleapp.
