Monitoring resources for service reliability using VMware Tanzu Insights in Tanzu Platform hub
The Tanzu Insights capabilities in Tanzu Platform hub help you monitor your resources, identify and prioritize those that need your attention, and provides various views and data to help you troubleshoot and resolve problems.
How Tanzu Insights detects correlations and patterns
Insights are aggregated observations. Observations are the events and alerts generated by your native public cloud accounts or integrated VMware services.
Your native public cloud platforms and other data sources, such as VMware Aria Operations for Applications (formerly known as Tanzu Observability by Wavefront) or VMware Aria Operations for Logs, forward alerts and events to the Tanzu Insights engine. The engine uses machine learning that is based on time and topology data to correlate events. The correlation process eliminates alert noise and detects meaningful patterns. The correlated events are presented to you as observations and insights.
For example, if you see events that affect entity availability, such as a connected service that is down or a lack of capacity on another entity, then observations might that indicate that something is down, lost, failed, or has problems or errors.
Before you begin
- Add one or more data sources and verify that they are configured to support Tanzu Insights. The possible data sources include the following native public cloud and selected VMware services.
- Amazon Web Services
- Microsoft Azure
- VMware Aria Operations for Applications
- VMware Aria Operations for Logs
How to investigate an Insight
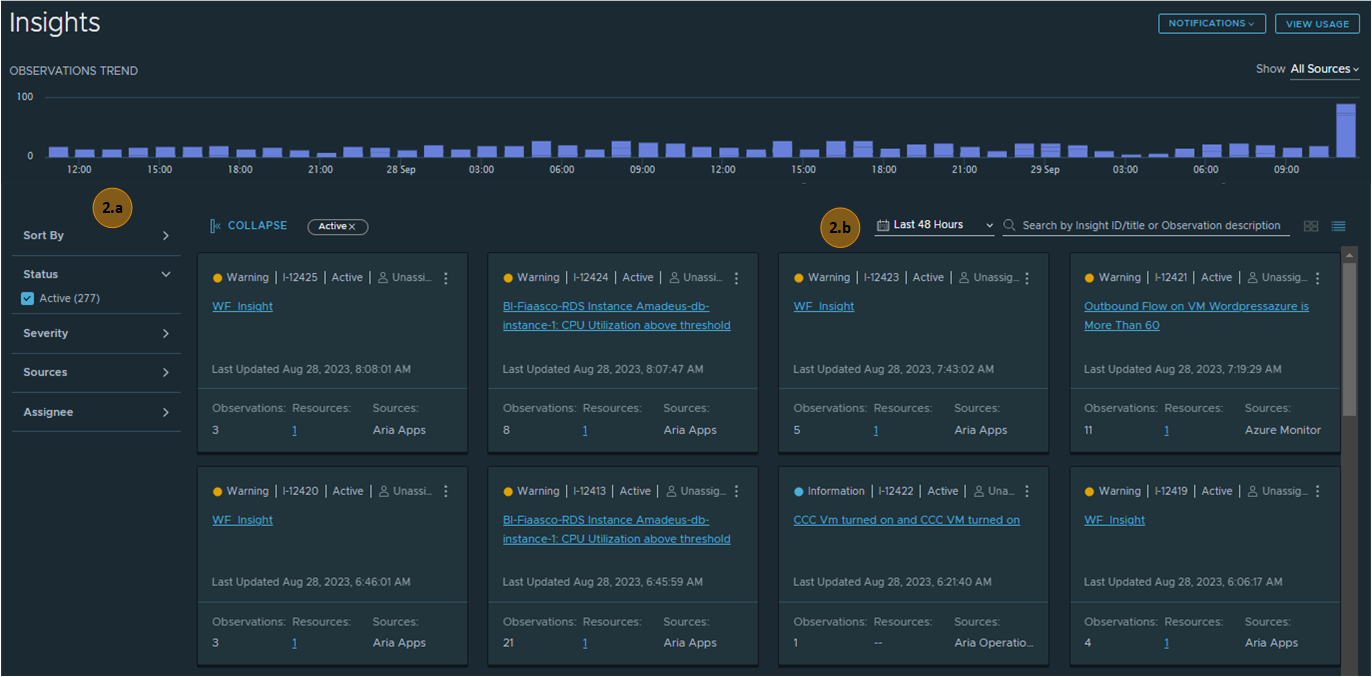
To begin your investigation, review the insights on the main Tanzu Insights page.
If you understand the naming pattern, then you begin to understand if the observations fall into the following areas.
- Insights that occurred during a similar time period. However, there is no clear events identified.
- Insights with one or more events that are not affecting other downstream resources.
- Insights with one or more affected applications but no clear event is identified.
- Insights with one or more events and one or more affected application.
As a reminder, observations are identified as events that indicate that something is down, lost, failed, has problems or error, or similar.
- To begin investigating an insight, click Intelligence Services > Insights.
-
Check the insights, filters, sources, and the time frame that you are investigating to ensure that you are not missing anything in your view or to limit the view for working.

- Filters. Use the filters to limit the number and type of insights that you are investigating.
- Time frame. Extend or reduce the time window where you want to investigate problems.
-
Review the Observation Trends.
The trends chart represents the volume of observations for each day based on your configured filters and time frame.
If you find that one service or provider is particularly relevant to a reported problem, you can change the view to reflect that source. The available sources depend on your VMware integrations and the cloud providers you are collecting data from.
-
Identify insights that need your attention.
You can use the information on the cards to determine the following characteristics.
- Severity
-
Insight name
The names follow the general naming convention previously provided.
-
Number of observations
Notice the number of observations and resources with observations.
-
Affected resources
- Alert source.
- To begin reviewing the observations, click the insight name.
How to investigate observations
Depending on the insight, particularly the number of observations and the number of affected applications or resources, you can use the following workflow to determine which view, Timeline, Observations, or Impact, is the most useful to you.
Observation are based on some sort of failure.
-
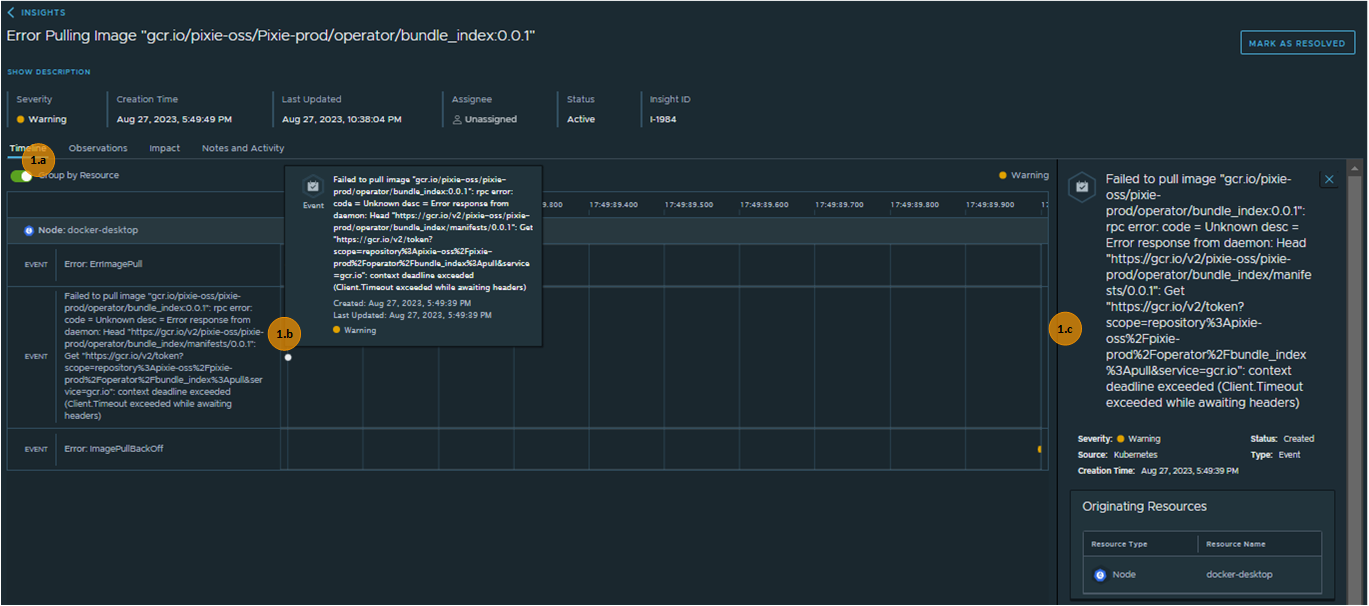
Review the Timeline so that you can see the spread of the observations across time and based on the severity.

- To change the presentation of the timeline from alerts on individual resources to chronological by based on initial trigger time, click Group by Resource.
- For a quick view of the alert or event details, hover your mouse over the segment in the timeline.
-
To see additional details, click the segment.
The details pane provides relevant information and a link to the resource from the service or platform where the alert or event was activated.
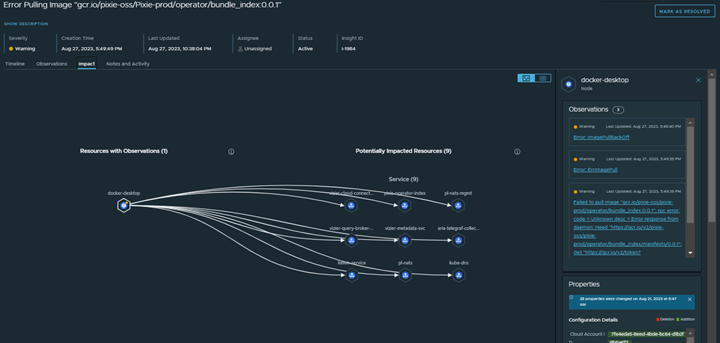
If you are investigating an entity, you can select it and then click back to the Impact view to see the relationships for that entity.
-
Use the Observations view to scan the observations so that you can triage the less useful observations while focusing on more immediate problems.

If you want the raw observation text, click View.
-
The Impact view provides a topological representation of the resources that are included in the generated insight. The view includes any resources that might be affected by the insight.

To learn more about the resource and its relationship to other entities, click the entity hex.
If you have the credentials for the service or platform where the alert or event was activated, you can open the UI and make changes to the entities to resolve problems.
-
To see a history of changes for the insight, click Notes and Activities.
- The system updates tell you how the insight has evolved over time.
- You might also see notes from other engineers working on the issue.
Log your investigation notes
Like most troubleshooting efforts, the notes of what you or other team members have done to investigate or resolve the issue help you improve your SLA and keep the system running for your stakeholders.
Resolve your Tanzu Insights
When your investigation is completed for an insight, you can resolve it.
You can Resolve an insight from the card, the menu in the top right corner of the card, or on the Observations page.
If you determine that an insight must be reopened, click Mark as Active.
Troubleshooting Tanzu Insights collections
For more about the sources and troubleshooting collections and processing, see Add data sources for VMware Tanzu Insights in Tanzu Platform hub.