


Observe a running application in a Space
After an application is running, you can view information about the state of the application and its related services in Tanzu Platform hub. You can view status information for an application from the Spaces details views.
Before you begin
Before exploring the Space Details views, ensure that:
-
The application was scheduled and deployed into a Space. For more information about Spaces, see What is a Space.
-
You have the necessary roles:
-
The Tanzu Application Platform Admin role or Tanzu Application Platform Viewer role is required to see all of the Space Details views.
-
The Tanzu Application Platform Developer role is not expected to have visibility into the underlying infrastructure, and it cannot access the Space Topology, Kubernetes Services, and Performance Metrics views. However, the role can see the Applications and Service Instances views.
-
The Tanzu Application Platform Member role can view the list of Spaces. The role has access to the Configuration view only.
-
Go to your Space
Go to the Space where the application you are interested in is running:
- In Tanzu Platform hub, scroll down and then expand Application Spaces on the left navigation pane.
- Click Spaces.
-
Click the Space your application is running in.
Note
Your Space can appear in the Recent Spaces area at the top of the page and in the Spaces table grid.
What you see in the table view depends on the role you have.
View the live logs of your application
Prerequisites
-
The
container-app.tanzu.vmware.comCapability is in the Profile that is assigned to your Space. This package contains the CRD and controller for the ContainerApp API. ContainerApp configuration represents a single application based on a single container where the application is a unit at “microservice-level granularity”. Examples: Rails web application, Rails worker, Spring Boot WebApp, Spring Cloud Task App.
- UI-based steps
-
Do the following on the Tanzu Platform hub:
- Open the Applications tab in the space details.
- Click on your application.
- Go to the Logs view.
-
Select an application instance to begin log streaming.
You can switch between the logs of the available application instances. Logs are streamed in the data grid based on the applied filters.
-
Adjust the log filters to make troubleshooting easier.

Available filters and settings for logs:
- Search filters logs by a string.
- Stop pauses log streaming.
- Start resumes log streaming from the current time.
- Refresh restarts the log streaming with the applied filters.
- Export exports all logs from the data grid as a CSV file.
- Options:
- Tail lines specifies number of log entries to begin streaming with. The default value is
500.
- Tail lines specifies number of log entries to begin streaming with. The default value is
- Using the Tanzu CLI
-
To use the Tanzu CLI to see the logs of your application:
-
Set your Space context by running:
tanzu project use PROJECT-NAME tanzu space use SPACE-NAME -
Stream the logs of a specific instance of your application, after printing a small amount of existing logs, by running:
tanzu app logs CONTAINER-APP-INSTANCE-NAMEThe logs continue streaming until you interrupt the process.
-
Use interactive mode to access the logs of an instance of your application, and respond to the prompts for required information.
tanzu app logs # You are prompted for the container app name and the instance name tanzu app logs CONTAINER-APP-NAME # You are prompted for the instance name -
Configure the
tanzu app logsbehavior. Use the--linesflag to specify the number of lines of existing logs to print. If the number of existing logs available is fewer than what you request, all existing logs are printed. Use the--recentflag to disable streaming and instead print only existing logs.
-
View the live logs of the pods backing your application
To access a data grid in which you can see live logs of the pods of your application:
- Open the Kubernetes Services tab in the space details.
- Click the Kubernetes service name.
- Go to the Logs view.
-
Select a service pod to begin log streaming.
The first container of this pod is selected automatically. You can switch between the logs of the available containers. Logs are streamed in the data grid based on the applied filters.
-
Adjust the log filters to make troubleshooting easier.

Available filters and settings for logs:
- Search filters logs by a string.
- Logs since lists options for displaying logs since a specific time. The default option is
Last 5 minutes. - Stop pauses log streaming.
- Start resumes log streaming from the current time.
- Refresh restarts the log streaming with the applied filters.
- Export exports all logs from the data grid as a CSV file.
- Options:
- Tail lines specifies number of log entries to begin streaming with. The default value is
500. - Include previous log lines starts log streaming for pod logs from the last pod restart. The default value is
false.
- Tail lines specifies number of log entries to begin streaming with. The default value is
Look at performance metrics of Kubernetes pods and services
Before starting:
-
Ensure that the
observability.tanzu.vmware.comTrait is configured in the Profile that is assigned to your Space. This Trait provides observability data related to the Space and its related components. -
Ensure that the
observability.tanzu.vmware.comCapability is in the Profile that is assigned to your Space. Observability enablesobservability-operatorandservicemesh-collectorto enrich metrics for the services in a Space where theobservability-traitis enabled. -
Ensure that the
servicemesh-observability.tanzu.vmware.comCapability is in the Profile that is assigned to your Space. The observability Capability package relies on this feature to intercept traffic and enhance the metrics metadata.
To view the performance metrics of your Kubernetes services:
- Go to the Network Topology view.
-
Click a Kubernetes service from the Network Topology view.
A side panel opens. This side panel provides more details about your Kubernetes service, including the HTTP performance charts HTTP Requests, HTTP Errors, HTTP Latency (p50), and HTTP Latency (p99):
- HTTP Requests shows the number of HTTP requests made to the given Kubernetes service.
- HTTP Errors shows the number of HTTP requests made to the given Kubernetes service that have resulted in a 4xx or 5xx HTTP response.
- HTTP Latency p50 and HTTP Latency p99 both show the amount of time needed for an HTTP request made to the given Kubernetes service to receive a response.
The data for these charts is based on the following time periods for which the Space details are displayed:
Last 5 Mins,Last 15 Mins,Last 1 Hour, andLast 12 Hours. -
With the details side panel open, view the performance metrics of your Kubernetes service’s pods by clicking the Show Details button.
The Kubernetes Service details page opens. By default, the Performance view is selected. The details page includes the same HTTP performance charts found in the side panel and two additional charts: CPU Utilization and Memory Usage.
The CPU Utilization and Memory Usage charts show data for the Kubernetes pods that are associated with the given Kubernetes service.
The data for these charts is based on the following time period for which the Space details are displayed:
Last 5 Mins,Last 15 Mins,Last 1 Hour, andLast 12 Hours.
Alternatively, you can find a list of your Kubernetes services under the Kubernetes Services view of your Space details page. Click a Kubernetes service in the list to open the Kubernetes Service details page. On this page, under the Performance view, you can view the performance metrics of your Kubernetes service and its associated pods.
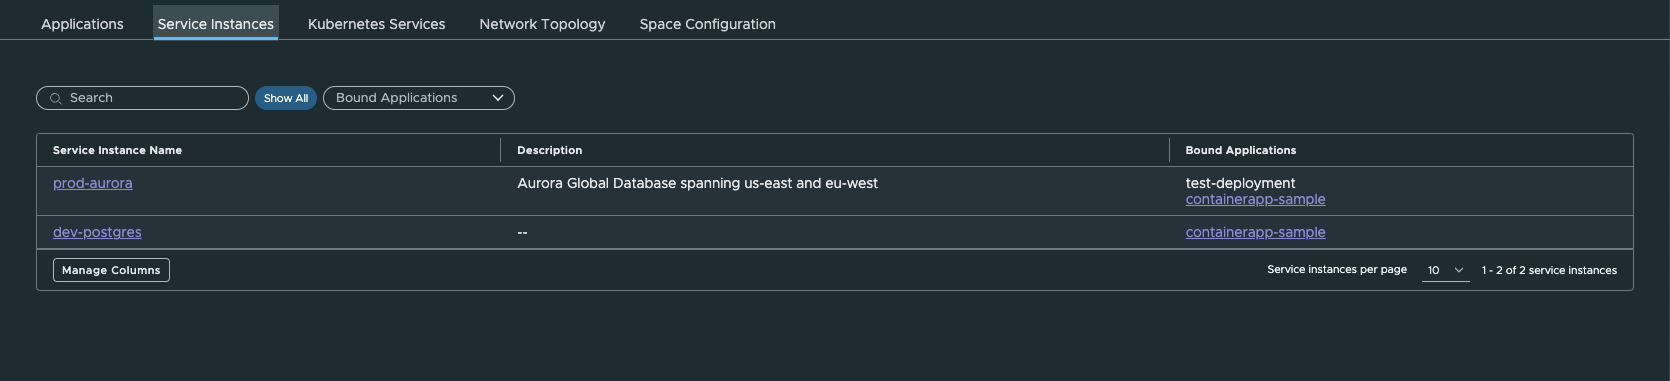
Look at service instances
This Service Instances view shows details about all service instances that are created in the Space.
Service instances can include:
- Bitnami-based backing services, which selected from the Bitnami Catalog and deployed to the Space.
- Pre-provisioned services, which are physically hosted outside the Space. For example, services hosted on cloud-provider infrastructure.
To create a service instance, use either the Tanzu CLI or kubectl. For detailed instructions, see Bind backing services to your application.
You can bind service instances listed in that view to a deployment or application, or not bind them to anything. To bind a service instance to an application:
- Bind the service to an application.
- Click the service-instance name to see more details about the selected service instance.
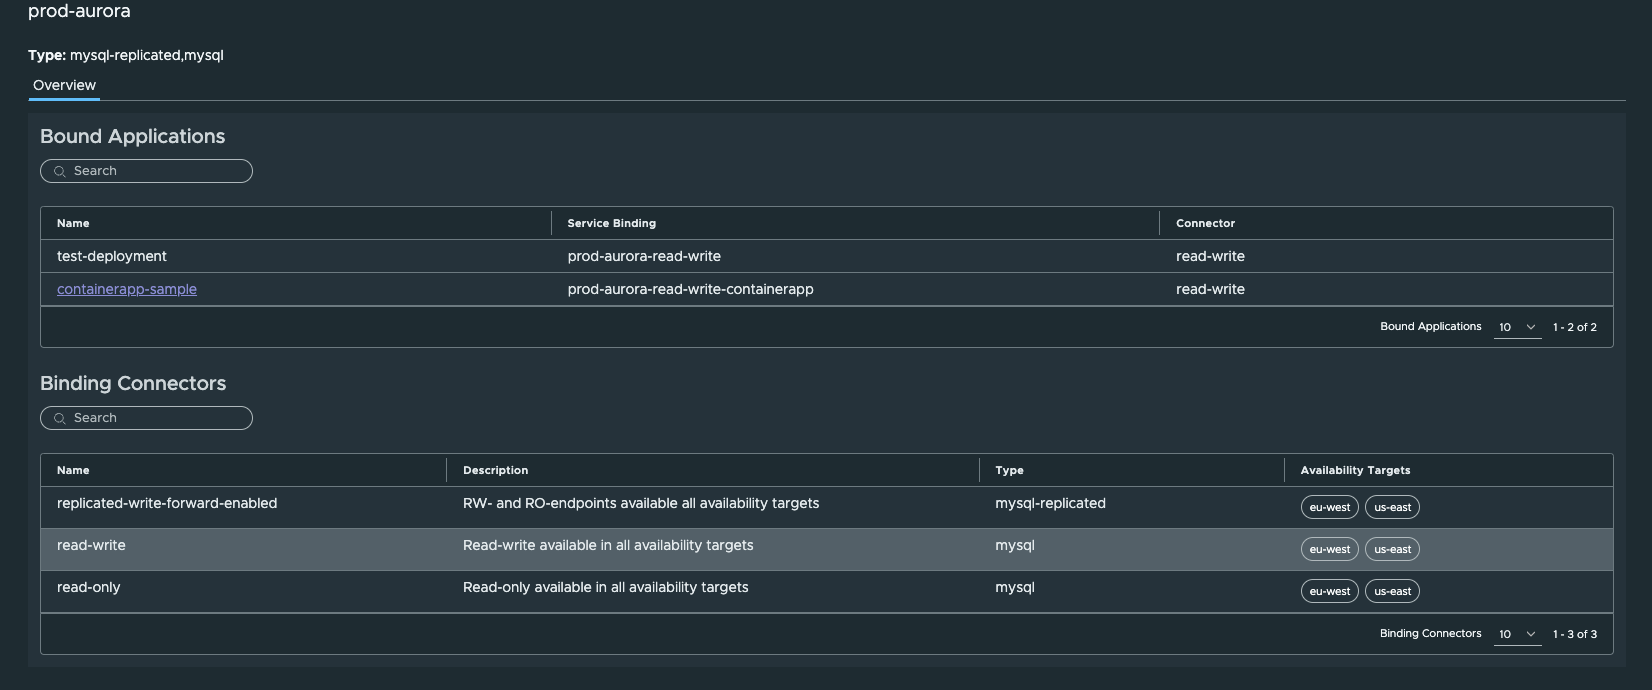
The information shown in the Service Instance details view includes:
-
Binding connectors:
Each connector refers to a binding secret that can be specific to an Availability Target. Typically, the secret contains everything required for a client to establish an authenticated and authorized connection with the corresponding endpoint. For example, a host, a port, a user name, or a password.
-
Bound applications:
Bound applications are Kubernetes deployments or applications that consume the service. The table displays the exact binding connector used to establish the connection.
Click the bound application name to see more details about the bound application.
Note
Bitnami Services do not have binding connectors. This is because they are local to the Space and directly reference a secret that is not specific to an Availability Target.
