Dashboard reports
The Dashboard can visualize various kinds of system metrics and network data. You can view reports of the most recent system metrics using the Dashboard.
| Report |
Description |
Available filters |
| Salt Events |
- Displays the number of Salt events over time, such as jobs or other operations
- Useful for monitoring expected or unexpected spikes in network activity
|
- All Salt masters or specific Salt masters
- Time range (from the past hour up to 24 hours)
|
| Salt Event Payload Size |
- Displays the payload size of Salt events over time, such as jobs or other operations
- Useful for monitoring the amount of processing power or memory used to complete jobs or other operations
|
- All Salt masters or specific Salt masters
- Time range (from the past hour up to 24 hours)
|
| Celery Queue Depth |
- Displays the depth of the celery queue over time, which refers to the number of jobs that were queued while waiting for CPU or database resources to become available
- Useful for identifying CPU or database bottlenecks
|
- All RaaS servers
- Time range (from the past hour up to 24 hours)
|
| RaaS Webserver Requests |
- Displays the number of requests made to the API (RaaS) server over time
- Useful for monitoring expected or unexpected spikes in server activity
|
- All RaaS servers
- Time range (from the past hour up to 24 hours)
|
| Webserver Response Time |
- Displays the amount of processing time required by the API (RaaS) server to respond to requests over time
- Useful for monitoring bottlenecks and the overall performance of the API (RaaS) server
|
- All RaaS servers
- Time range (from the past hour up to 24 hours)
|
| RaaS Salt Master Iteration Time |
- Displays the amount of time it took Salt masters connected to Tanzu Salt to complete a webserver request, from beginning to end, over time
- Useful for monitoring Tanzu Salt-related load on each Salt master
|
- All Salt masters or specific Salt masters
- Time range (from the past hour up to 24 hours)
|
| SSE Users Authenticated |
- Displays the number of distinct users that were logged into Tanzu Salt over time
- Useful for monitoring expected or unexpected spikes in users logging into Tanzu Salt
|
- Time range (from the past hour up to 24 hours)
|
| Database Activity |
- Displays the number of actions (deleted, read, inserted, updated) on various PostgreSQL database rows over time
- Useful for monitoring expected or unexpected spikes in read/write activity on the PostgreSQL database
|
- Time range (from the past hour up to 24 hours)
|
| Database Connections |
- Displays the number of connections between the PostgreSQL database and the API (RaaS) server over time
- Useful for monitoring expected or unexpected spikes in activity on the PostgreSQL database
|
- Time range (from the past hour up to 24 hours)
|
| Redis Commands Executed |
- Displays the number of commands executed against the Redis server over time
- Useful for monitoring the number of requests for information in the Redis caching layer (such as query results)
|
- Time range (from the past hour up to 24 hours)
|
| Jobs |
- Displays the number of jobs that succeeded, missed returns, failed, or that were in progress over time
- Useful for evaluating overall system activity and performance
|
- Time range (from the past hour up to 24 hours)
|
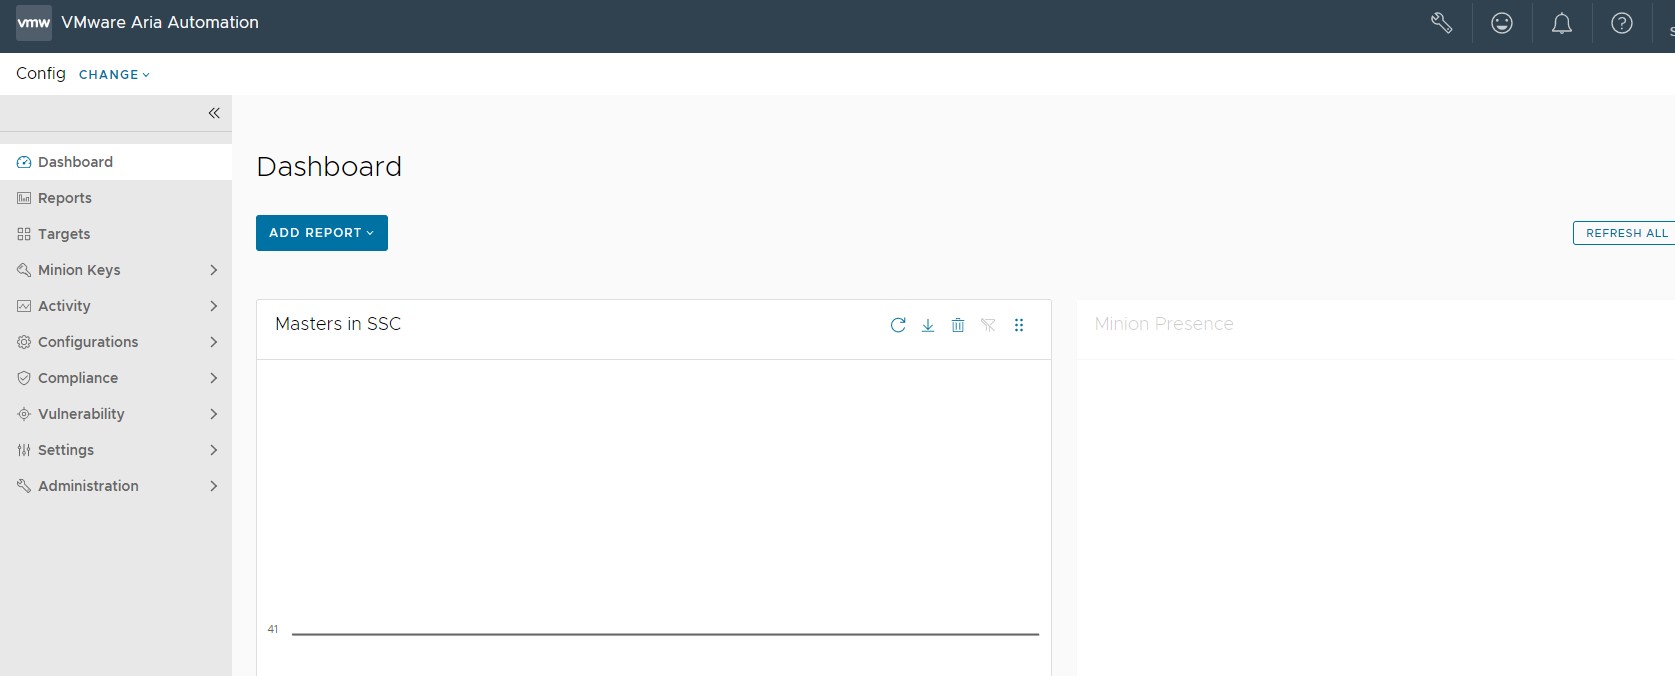
| Salt Masters in SSE |
- Displays the number of Salt masters registered in Tanzu Salt over time
- Useful for monitoring whether Salt masters went down unexpectedly or if there are more Salt masters than expected over time
|
- Time range (from the past hour up to 24 hours)
|
| Minion Presence |
- Displays the number of minions connected to Salt masters through Tanzu Salt over time
- Useful for monitoring if minions went down unexpectedly or if there are more minions than expected over time
|
- All Salt masters or specific Salt masters
- Time range (from the past hour up to 24 hours)
|
For information on system metrics, see Monitoring your system metrics using Tanzu Salt.
Adding reports
To add a report to the Dashboard:
- In the Dashboard workspace, click Add Report to open a menu.
- Select the name of the report you want to add to the Dashboard.
The report you selected now appears in the Dashboard. If you already have several reports in your Dashboard, the new report you just added appears at the top of the Dashboard on either the left or right column. It appears in whichever column had the fewest reports at the time you added it.
All the reports in the Dashboard workspace can be filtered by the duration of time shown in the report, from the past hour up to 24 hours. All reports are set to 12 hours by default. To change the duration, click the duration filter in the lower left of the report to select a different time range.
You can also download reports by clicking the Download icon  and selecting Download JSON or Download CSV.


