


Tanzu Service Mesh provides an actionable SLO feature that you can use to influence service autoscaling decisions.
Example of Use Case 3
To illustrate this use case, let’s use the Acme application example.
Deploy the acme application to the acme namespace in your clusters.
Create an autoscaling policy acme-order targeting the order service.
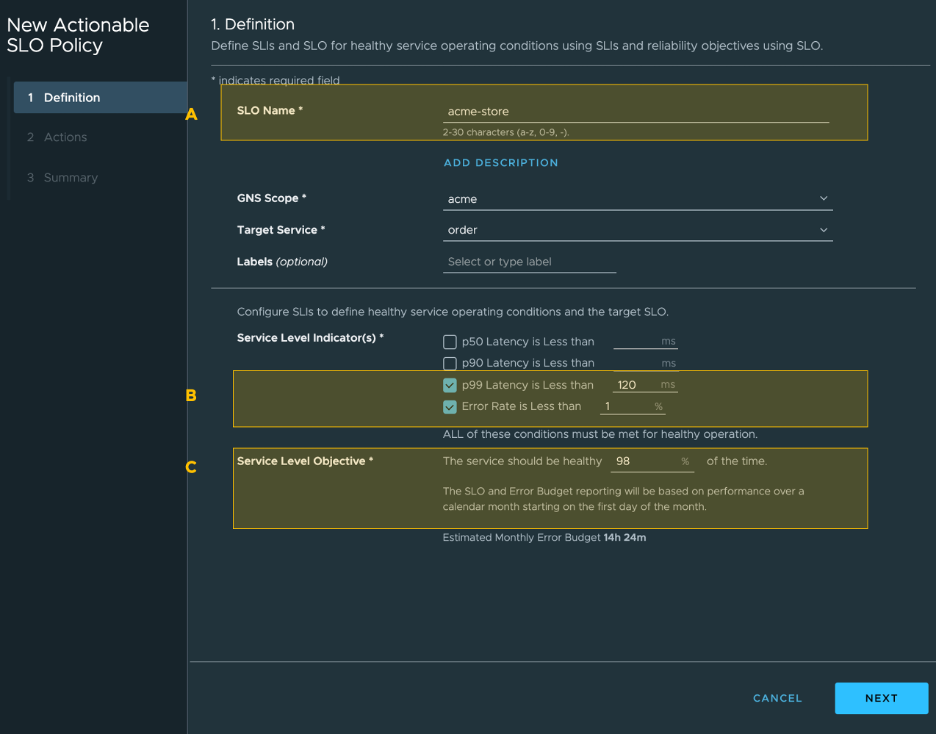
Create an SLO policy acme-order targeting the order service.
You can now view the actionable SLO and autoscaling in action for the order service on the Performance tab for the service.
The screenshot below shows an actionable SLO (A) and a p99 latency SLI set to 120 ms (B), and an Error Rate SLI set to 5% (C). For more information about configuring an SLO, see Access the SLO Feature.
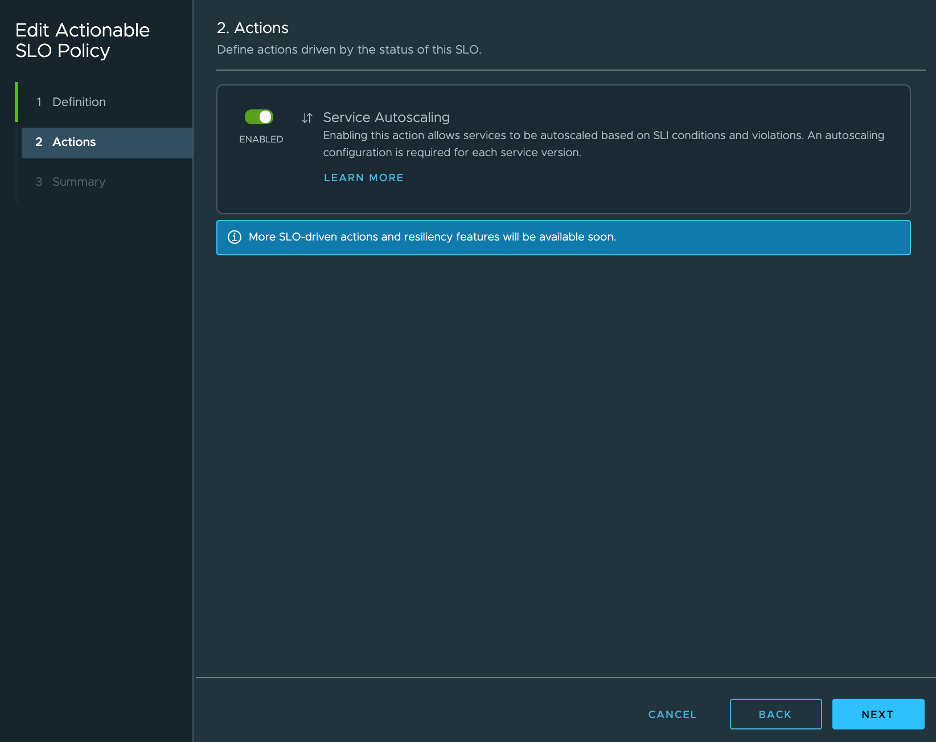
In this screenshot, Service Autoscaling is enabled for the order service.
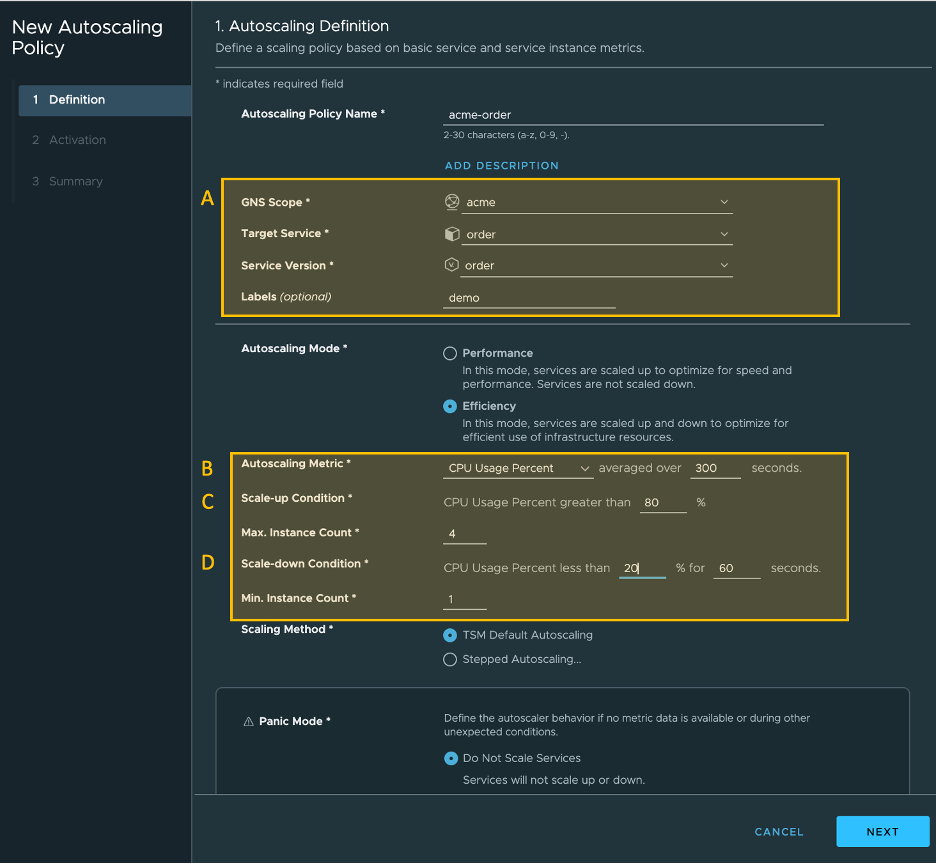
The screenshot below shows the following autoscaling policy:
A. An autoscaling policy is set for the order service, and autoscaling mode is set to Efficiency.
B. CPU Usage Percent is selected as the autoscaling metric in the autoscaling policy.
C. The service is set to scale up if the CPU Usage percentage is greater than 80% to a maximum of 10 service instances.
D. The service is set to scale down if the CPU Usage percentage is below 20% to a minimum of 1 service instance. For more information about configuring an autoscaling policy, see Approach 1: Configure Gns-Scoped Autoscaling Policy Using Tanzu Service Mesh UI in the Service Autoscaling with Tanzu Service Mesh User’s Guide.
The following screenshot illustrates an SLO-linked autoscaling scenario for the order service where an SLI in an SLO is violated, and the autoscaling metric is below the scale-down threshold.
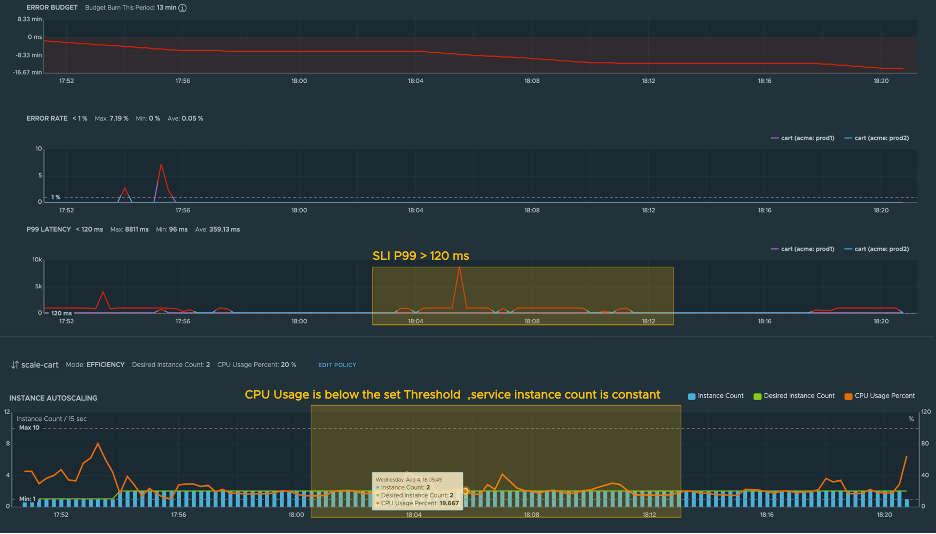
To illustrate this scenario, let’s consider this example:
The SLI P99 latency is greater than 120 ms, which means that the response time for 90% of requests received by the order service is greater than 120 milliseconds. This is above the SLI set for the order service.
The Autoscaling Metric CPU Usage Percent for the order service is less than 20%, which is below the scale-down threshold.
In this scenario, even though the autoscaler metric value is below the scale-down threshold, Tanzu Service Mesh Autoscaler will not scale down the order service because the SLO has been violated according to one of the SLIs (P99).
Example Resiliency Configurations and Autoscaler Outcomes
Configuration Scenario |
Autoscaler Outcome |
|---|---|
|
"cart_v1" will be autoscaled based on monitoring the CPU metric. |
|
No autoscaling of "cart_v1" because there is no autoscaling configuration associated with it. |
|
“cart_v1” will be autoscaled based on monitoring both CPU and p95_latency. |
Scenarios in SLO-Linked Autoscaler
An actionable SLO is configured with SLI p90_latency set at 500 ms for the cart service:
An autoscaling policy is configured for cart_v1.
Autoscaling mode - Efficiency
Autoscaling Metric – CPU Usage
Scale Up Condition – 80%
Scale Down Condition -40%
Condition |
Autoscaler Outcome |
|---|---|
|
Since it is a scale-up condition, cart_v1 will be scaled up. |
|
Since it is a scale-up condition, cart_v1 will be scaled up. |
|
No scaling actions. |
|
Since it is a scale-down condition, cart_v1 will be scaled down. |
|
Even though it is a scale-down condition, cart_v1 will not be scaled down because the SLI is violated. |
