


A common measure of the health of a service is latency percentile values. Of the three latency percentiles available to use with Tanzu Service Mesh SLOs, the p99 latency is the most appropriate service level indicator (SLI) for production environments because this metric most fully covers the experience of the users of a service.
The p99 latency is the highest latency value (slowest response) of the fastest 99 percent of requests. In other words, 99 percent of requests have responses that are equal to or faster than the p99 latency value.
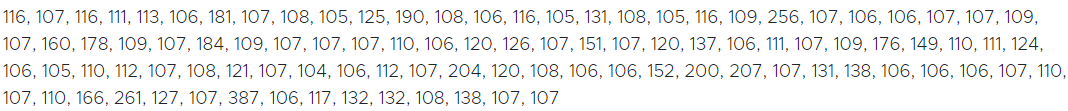
Because latency percentiles are not the easiest metric to understand, let’s use a concrete example to explain how it is determined. Consider the following dataset of 100 latencies recorded in milliseconds for a microservice application:
Take the above 100 request latencies and sort them in ascending order. To find the p99 latency value of this dataset, highlight 99 of the requests with the lowest latencies (fastest response times). Then select the highest latency (slowest response time) from the highlighted data and emphasize it in bold. The p99 latency, which in this dataset is 261 ms, is in bold.
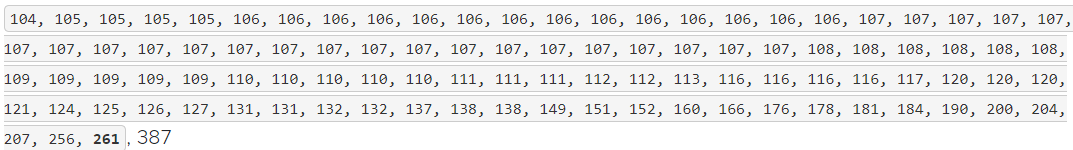
Set the SLI threshold value for latencies to the maximum amount a time a user must wait for 99 percent of the requests when using a high-quality application. If the service quality is sufficient with 99 percent of requests having latencies lower than 261 milliseconds, a p99 of 261 is appropriate. However, if these latencies are not acceptable, set the p99 latency to a lower value.
