


Based on SLOs, teams can track “error budgets,” that is, a length of time over which performance can be outside the desired SLIs without violating the SLO.
For example, an SLO of 99.9 percent permits a service to be “unhealthy” for 0.1 percent of the time. You can visualize error budgets for a specific length of time using a burn-down chart. The chart shows how error budgets are consumed while a service is unhealthy and indicates the remaining error budget for that length of time.
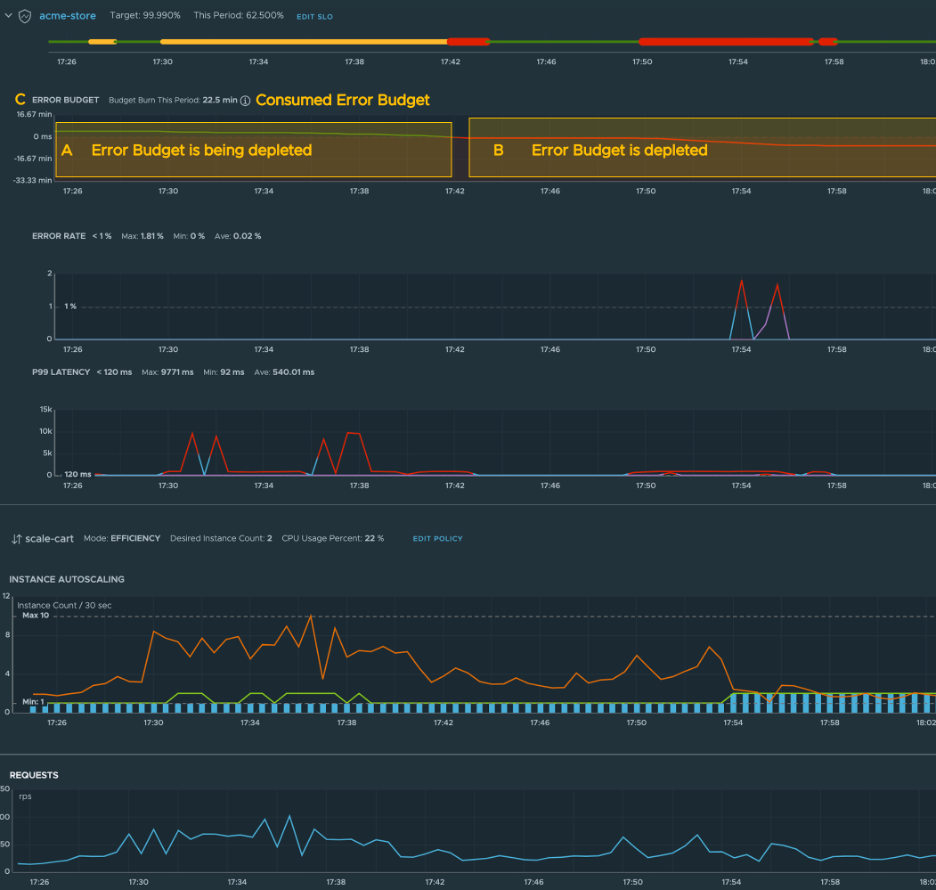
A. The error budget, which was set for 0.1 percent of the time, is being quickly depleted.
B. The monthly error budget allocated is completely depleted.
C. The error budget consumed in the selected period in the UI.
Once the monthly error budget is completely consumed, the budget for the rest of month will continue to be depicted in negative for the service. This allows the actual amount of time that the service violated the SLIs in the month to be measured.
