


Developers and operators can use the Service Level Objective (SLO) graph to see how Tanzu Service Mesh Service Autoscaler impacts the stated microservice objectives.
Developers and operators can use Tanzu Service Mesh Service Autoscaler to ensure consistent application capacity and user experience across multiple clouds and platforms. For more information, see the Service Autoscaling with Tanzu Service Mesh User’s Guide.
Examples of Use Case 2
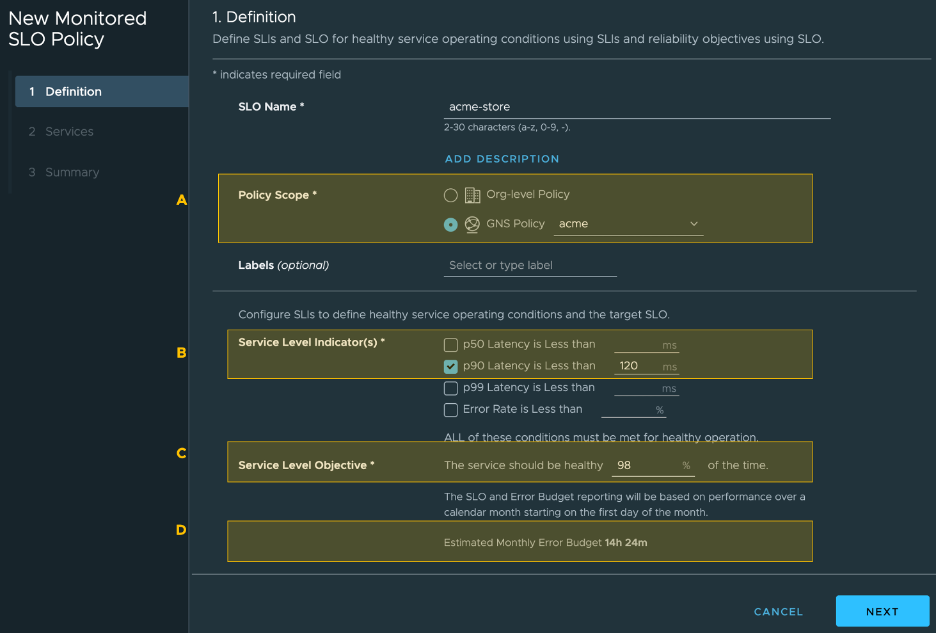
You can create and configure an SLO from the Tanzu Service Mesh user interface, as shown in the following screenshot.
In the screenshot, A shows a monitored SLO policy, and B shows a p90 latency SLI. Ninety percent of the requests are expected to be faster than 120 milliseconds. However, if the p90 latency is higher than 120 milliseconds, the slow response times will cut into the allowed error budget. The error budget is set (D) to allow the SLI conditions to be unmet 2 percent of the time. D shows how much time has been allotted to the error budget for a month.
The following screenshot shows the SLO in the Tanzu Service Mesh console user interface. We have labeled the diagram with the letters A-K. Each highlighted area is described below.
A. SLO warnings are in yellow. An SLO is in warning when the SLIs exceed their threshold values and the error budget is being depleted.
B. SLO violations are in red. Red indicates that the error budget has been fully depleted while the process continues to violate the SLO.
C. A green line indicates a healthy SLO.
D. The error budget is being depleted quickly, but it’s still in the positive.
E. The budget has been entirely depleted and has gone into the negative.
F. Latencies are increasing.
G. Latencies are back down to low levels.
H. Autoscaling has been disabled, and the number of service instances remain constant.
I. The number of service instances have increased because autoscaling has been enabled.
J. Requests are coming in at a constant rate.
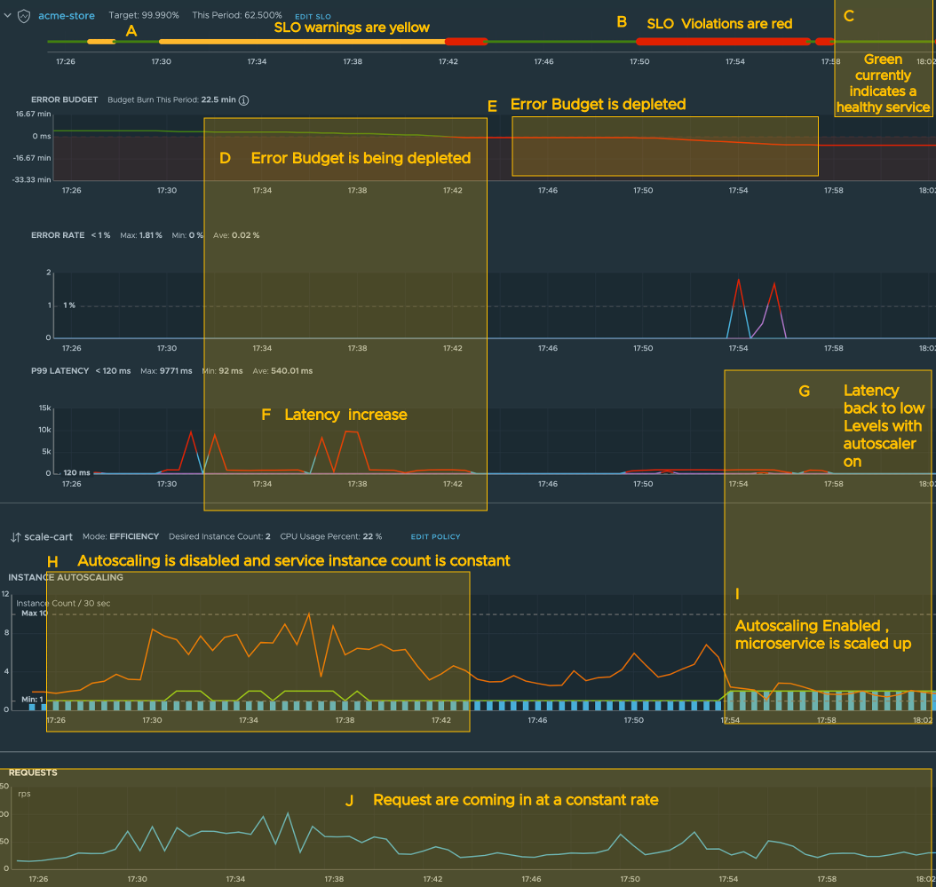
The previous screenshot shows the SLO in the Tanzu Service Mesh console user interface. At the top of the screen is a green line. The green line is obscured by a thicker yellow line (A) when the SLIs exceed their threshold values and the error budget is being depleted (D). The sections covered with red lines (B) indicate that the error budget has been fully depleted while the process continues to violate the SLO. Green (C) indicates a healthy SLO.
The cause of the SLO violation was the high number of requests, which is sustained through most of the example (J). Latencies increase (F) because the service cannot respond quick enough to keep up with the traffic. During the time of high latencies, the number of service instances remained low (H) and could not keep up with demand.
When autoscaling is enabled, you can see the service instance count increase (I), leading to lower latencies (G) and a healthy SLO (C). Note that the error budget will be fully replenished on the first of every month.
