


After you define SLO configurations, you can view and track violations of SLIs and SLOs in real time in the Tanzu Service Mesh Console user interface.
To see the SLOs in action, perform these steps:
In the left navigation menu, click Inventory and then click Services.
Click one of the service names where an SLO has been defined.
Click the Performance tab.
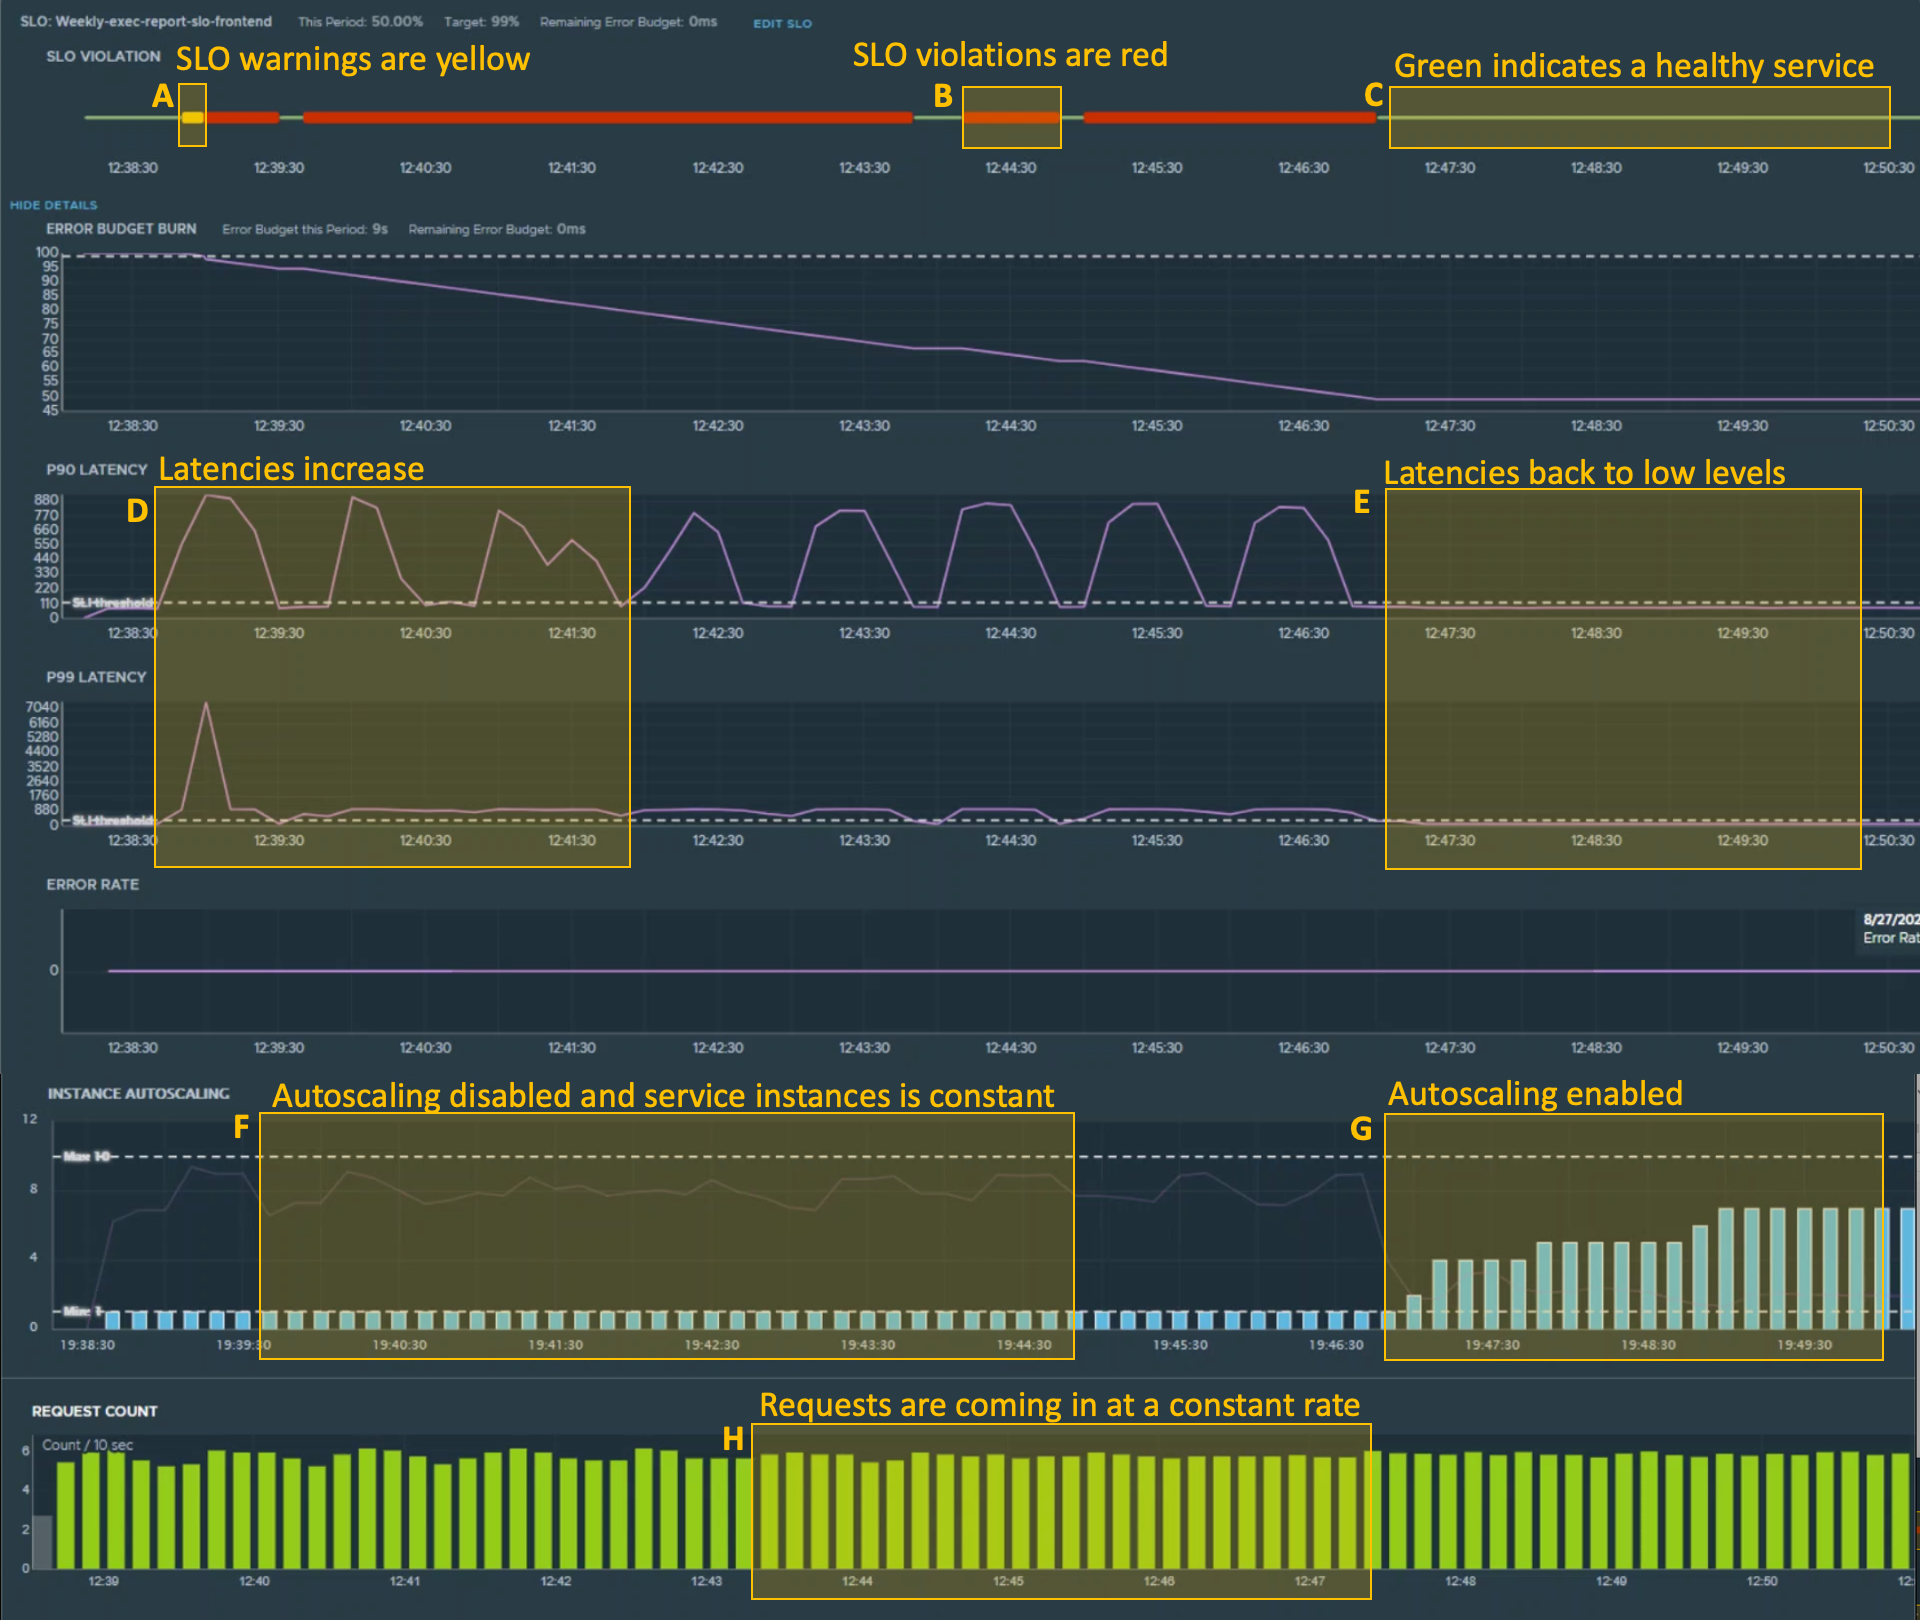
Toward the top of this screenshot, different color lines show service health. When SLI thresholds are not met or exceeded, a green line (B) appears. The green line indicates a healthy service. Services whose SLIs are being exceeded and are depleting their error budgets are indicated with a yellow line (A). The screenshot shows why the SLI thresholds are being exceeded: latencies are high (C) and service instance counts do not meet demand levels due to lack of scaling (E). The service becomes healthy again when autoscaling is enabled (F), bringing latencies back to low levels (D) that do not exceed the SLI thresholds.
This example shows that it is easy to see which services require work in existing features. It is just as easy to see which services do not consume SLO budgets and have low error rates. For these healthy services, you can focus on new feature development.
