


Tanzu Service Mesh API discovery is the capability that allows auto-discovery of APIs signatures between microservices running inside or outside the mesh. API discovery creates a custom API schema for each API that is close to OpenAPI spec 3.0. Tanzu Service Mesh graph renders the detected APIs in the Enforcing mode by default. In the Enforcing mode, Tanzu Service Mesh Enterprise enforces the policies (access control, security, service level objectives, threat detection, and autoscaling) on all the services in a global namespace. If a new API is detected in the enforcing mode, it is considered as a violated API. Users can accept those APIs when they believe they are legitimate.
Count of Active APIs
To view the count of active APIs at cluster level, in the navigation panel on the left side of the Tanzu Service Mesh Console, click Home > GNS Overview tab. The GNS Overview tab displays the cards for the global namespaces created in Tanzu Service Mesh.
A global namespace card displays the count of active APIs discovered between the microservices internal and external to the Tanzu Service Mesh, along with additional details. The metrics bar at the top of the Home page also shows the total number of active APIs.
GNS Topology View
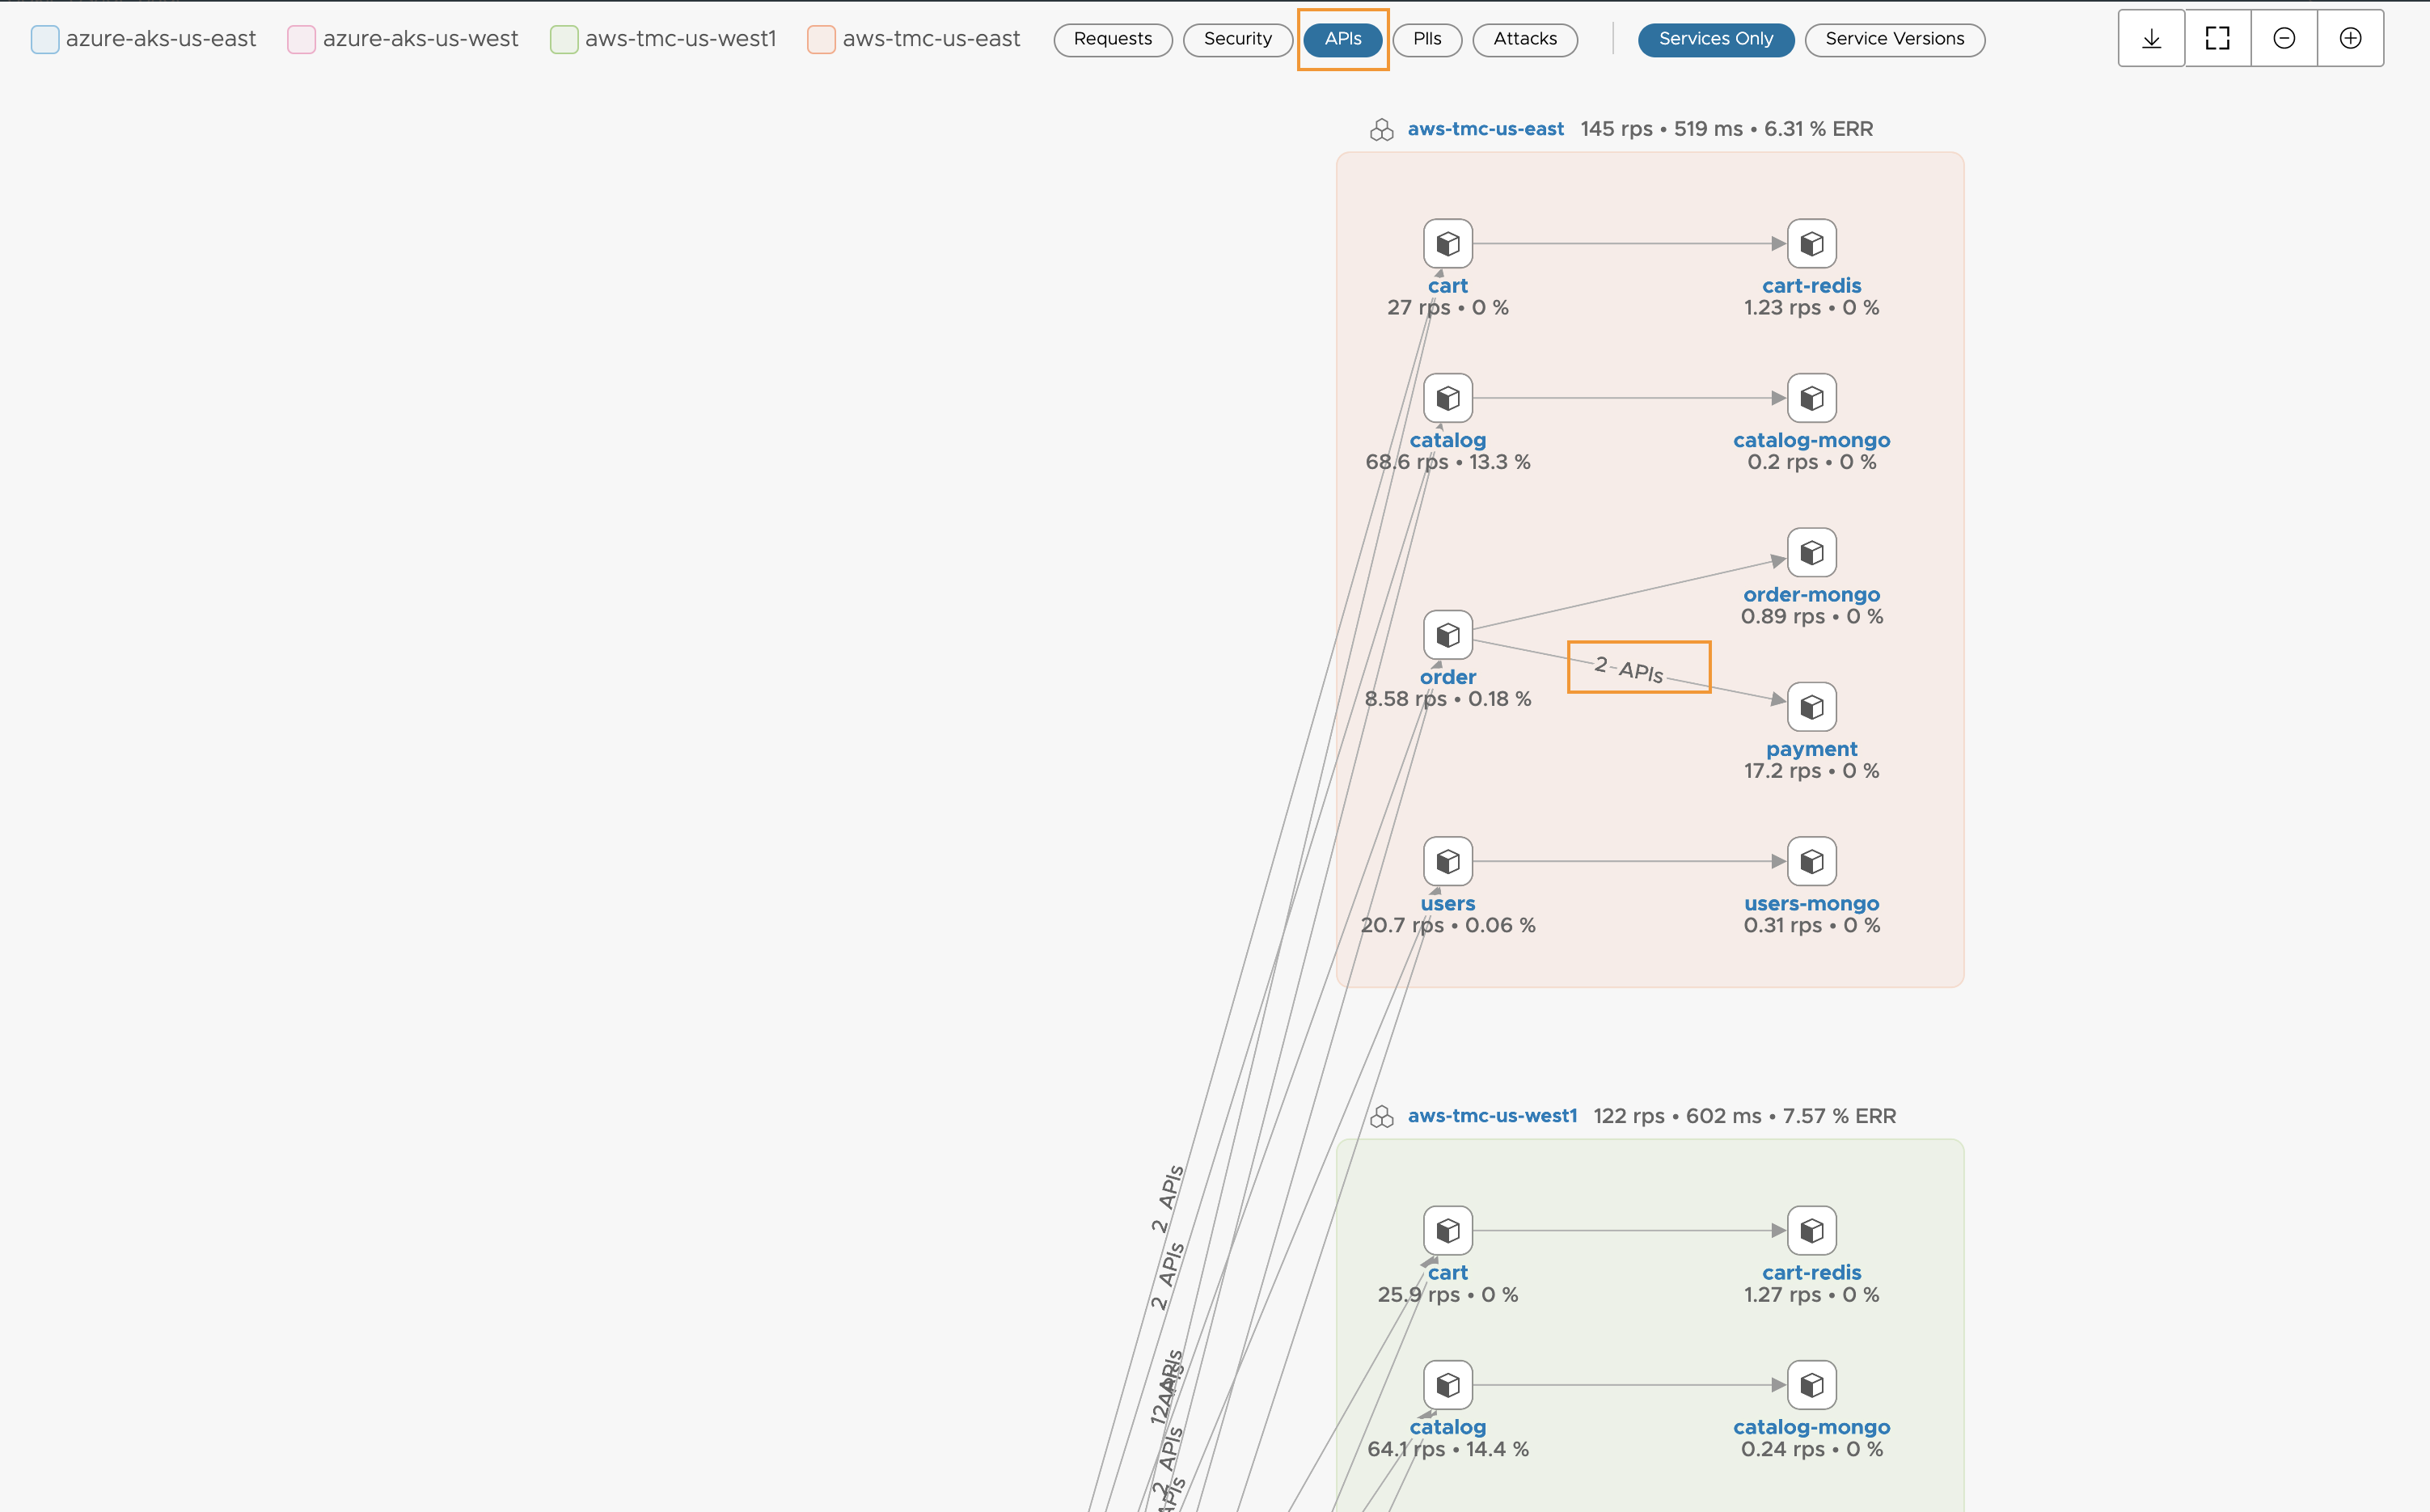
To view the topology graph of the services in the global namespace, click the topology thumbnail or the global namespace name in the card and select the APIs option. This action opens up the GNS Topology panel that displays information about all incoming and outgoing requests from each service across the global namespace, as well as the number of APIs detected between services.
API Information at Service Level
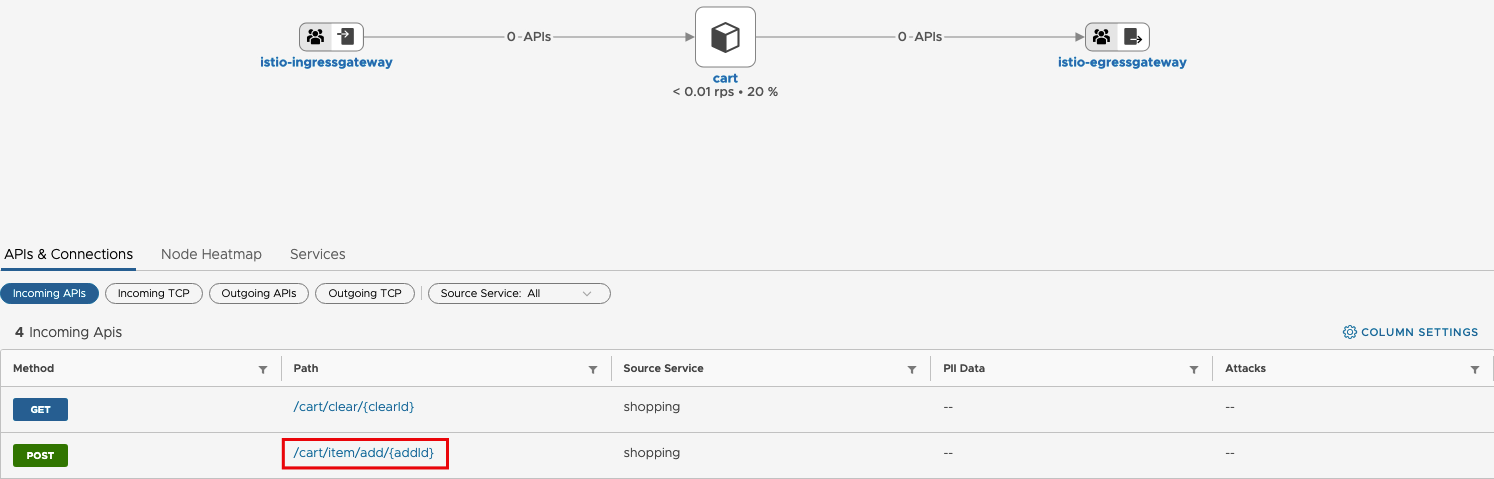
On the GNS Topology page, each service graph connection, when expanded, displays the following information about APIs detected between the services under the APIs & connections tab.
For HTTP requests:
Incoming APIs. The Incoming APIs tab lists the incoming API requests including methods, path, source service, PII data, and attacks detected between the services connected via this service link.
Outgoing APIs. The Outgoing APIs tab lists the incoming API responses including methods, path, destination service, PII data, and attacks detected between the services connected via this service link.
For TCP requests:
Incoming TCP. The Incoming TCP tab lists the incoming TCP requests including source service name, the port at which the TCP connection was established, bytes sent, bytes recived, and active connections. Received and sent bytes depicts the change in the number of bytes sent and received over time. Active Connections depicts the change in the connections established over time.
Outgoing TCP. The Outgoing TCP tab lists the outgoing TCP responses including destination service name, the port at which the TCP connection was established, bytes sent, bytes recived, and active connections.
API Endpoint
On the API & Connections tab, click the desired path to open the API Endpoint page. There are three tabs on this page: API Overview, API Schema, and API Logs.
API Overview: Security Analytics
This help page provides detailed analytics about the API and PII transactions, TCP connections, users involved, errors occurred, API vulnerabilites, and the public services and APIs detected within the application mesh. The discovery, interpretation, and communication of several services in the Tanzu Service Mesh is represented in the form of graphs to understand the patterns in data for effective decision making. Each widget consists of a graph view and a detailed view.
Security Events:
Description. The Events widget on per service page provides information about all the events logged when this service is experiencing a new API, PII transaction, or any unusual transactions. The events are categorized into three types based on the severity level:
Warning Events. The events with a medium level of severity and are to be handled.
Critical Events. The events with the highest level of severity and are not expected to occur.
Non-Critical Events. The events with the lowest level of severity and are expected to occur.
Top View. The event grid holds event logs where each cell represents the time at which the event occurred. Each cell, when clicked, opens up a detailed view that lists all the events of this service that occurred during that period of time.
Detailed View. The detailed view provides the following information:
Timestamp. The time at which the selected event occurred.
Event Risk Level. The risk level of the selected service event. The risk levels are categorized into low, medium, and high.
Services Detected. The services that were involved in the communication.
Locations. The location from where this API or PII data flow was invoked.
User Involved.The users who triggered this event.
API Detected. The API with the services communicated.
API Schema
Tanzu Service Mesh Enterprise discovers API transactions between the services internal and external to the mesh across the global namespace. HTTP traffic is captured between all the services. Tanzu Service Mesh generates a custom API schema from the captured HTTP traffic, which is close to the OpenAPI specification. The API Schema tab lists those discovered APIs with a custom API schema generated for each. Request and response header information from the HTTP traffic is present in the custom schema.
API Logs
The API Logs Page logs information about each API detected, service that received this API requests, namespace where this service resides, and the domain name. In addition, each log message contains the following information:
URL. Detected API URL.
Timestamp. The time at which this API was detected.
Violation. A Yes/No flag indicates whether or not it is a valid API request. A negative value indicates a violation.
User ID. User information included in API requests.
Status Code. A response status code indicates whether a specific HTTP request has been completed.
PII Information. PII data included in API requests.
