Tanzu Service Mesh provides detailed information to help you monitor the health and performance of a public service. This information includes the overall health status, global server load balancing (GSLB) routing information for the service's public URLs, and performance metrics. You can also view the different details about the public service, including its configuration.
You can monitor a public service and view its details and configuration from its details page in the Tanzu Service Mesh Console UI.
The details include the health status of the public service. Tanzu Service Mesh computes an overall health status based on the health status of each public URL of the public service. Tanzu Service Mesh periodically sends the configured number of connection attempts, or health check probes, to each URL to evaluate the health status of the URL. If the service responds successfully to the probes sent to a particular URL on all the clusters, that URL is considered healthy. If the service fails to respond to the probes sent to a URL on all or some of the clusters, that URL is considered unhealthy. The overall status of the public service is healthy if all its public URLs are healthy. If at least one of the public URLs is unhealthy, the overall state of the public service is considered unhealthy.
A public service can have one of the following color-coded statuses:
Healthy (in green) - The public service is healthy and reachable at all its public URLs.
Syncing (in blue) - A temporary state that is displayed when you create a public service or edit the public service configuration. This status is displayed for a few minutes while Tanzu Service Mesh is applying the configuration of the public service to AWS, NSX Advanced Load Balancer, and the client clusters, and while Tanzu Service Mesh is sending health check probes to the service on the different clusters to see if it's healthy. When the public service configuration is applied, and the health checks are complete, this status changes to Healthy, Warning, or Error.
Note:
The Health Check Interval and Healthy & Unhealthy Threshold specified in the health check settings of the public service affect the length of time that the public service is in Syncing state.
Warning (in yellow) - The public service is unreachable at some of its public URLs because of a problem with the service on some of the clusters.
Error (in red) - The public service is down or unreachable on all the clusters because of a problem.
Procedure
- Open the public service details page.
- On the Home page, on the GNS Overview tab, in the card for the global namespace that contains the public service, click the name of the global namespace.
- On the global namespace details page, click the Public Services tab.
- In the Public Service column, click the name of the public service.
The top of the public service details page displays the following summary information:
The public URLs of the public service, that is, the URLs at which users and external clients can access the service.
Overall health status of the public service. The status is displayed in a color-coded rectangle. Tanzu Service Mesh computes the status based on whether the service is reachable at its public URLs. To see the health status of the service at each URL with a breakdown by cluster in the Public Service Status window, click the status rectangle. If the status is Warning or Error, the Public Service Status window displays the details of the error, and the clusters where the service is unhealthy is indicated with a red circle with an exclamation mark.
Note:
If the public service is in the Warning or Error state, running this kubectl command on a cluster can help determine the cause of the problem:
kubectl --context {cluster} get pods -A
If the service is not running correctly, it has a status other than Running in the output of the command. Take the appropriate corrective action according to the error status.
If the service has a status of Running, and other services on the cluster can access the service, there might be a problem with the ingress gateway on the cluster or with the global server load balancing (GSLB) configuration of the public service. In that case, to resolve the problem, open a support request with VMware.
The name and domain of the global namespace that contains the public service, and the local address of the public service within the global namespace. To view the details page for the global namespace, click its name.
The names of the clusters that host instances of the public service. To view the details page for a cluster, click its name.
The tabs of the public service details page display the different details and configuration information for the public service. For more information about the details that are displayed on each tab, see the following steps.
- To view the GLSB routing information for the public service, click the GSLB Routing tab.
The top of the GSLB Routing tab displays a selector for switching between the different public URLs of the public service and the aggregated requests per second (RPS), 99th percentile latency, and error rate metrics for the selected URL. If the public service has more than two public URLs, you can access the other URLs by clicking the box with three ellipses. The legend that identifies the color codes used for the clusters appears to the right of the metrics.
The tab displays a GSLB routing data card for the selected public URL. A separate color-coded rectangle appears inside the card for each cluster. The boxes inside a cluster rectangle represent the number of public service instances deployed in that cluster. To display the metrics and details for a service instance in a hover card, point to the box for that instance inside its cluster rectangle.
The global load balancing scheme (Round Robin, Weighted, or Failover) specified for the URL appears in the upper-right corner. The RPS and error rate metrics are broken down by cluster. If a global load balancing scheme of Failover (Active/Passive) is specified, the metrics are also broken down for the active group and passive group.
The lines to the left of the GSLB routing data card represent the incoming connections of the public service to other services, and the lines to the right of the card represent the outgoing connections. The names of the connected services appear above the boxes at the end of the lines.
- To view the global load balancing (GLSB) routing information for the public service, click the GSLB Routing tab.
The top of the GSLB Routing tab displays a selector for switching between the different public URLs of the public service and the aggregated requests per second (RPS), 99th percentile latency, and error rate metrics for the selected URL. If the public service has more than two public URLs, you can access the other URLs by clicking the box with three ellipses. The legend that identifies the color codes used for the clusters appears to the right of the metrics.
The tab displays a GSLB routing data card for the selected public URL. A separate color-coded rectangle appears inside the card for each cluster. The boxes inside a cluster rectangle represent the number of public service instances deployed in that cluster. To display the metrics and details for a service instance in a hover card, point to the box for that instance inside its cluster rectangle.
The global load balancing scheme (Round Robin, Weighted, or Failover) specified for the URL appears in the upper-right corner. The RPS and error rate metrics are broken down by cluster. If a global load balancing scheme of Failover (Active/Passive) is specified, the metrics are also broken down for the active group and passive group.
The lines to the left of the GSLB routing data card represent the incoming connections of the public service to other services, and the lines to the right of the card represent the outgoing connections. The names of the connected services appear above the boxes at the end of the lines.
- To monitor the performance of the public service on the different clusters by using metric charts, click the Performance tab.
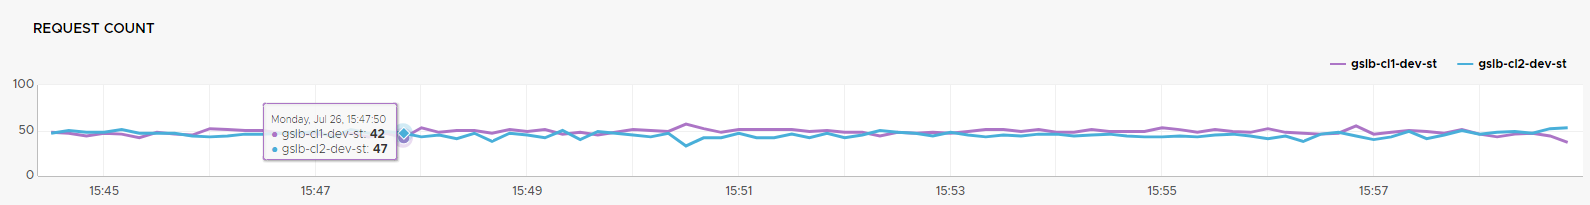
The performance charts on the Performance tab displays metrics collected for the public service in the time range selected in the Metric Time Range drop-down menu in the upper-right corner. Each chart displays a separate colored line for each cluster where the public service is deployed. The cluster color-code legend appears at the upper right above each chart.
- To view the metric values collected at a specific date and time, point to the appropriate data point on the chart, as shown the example below.
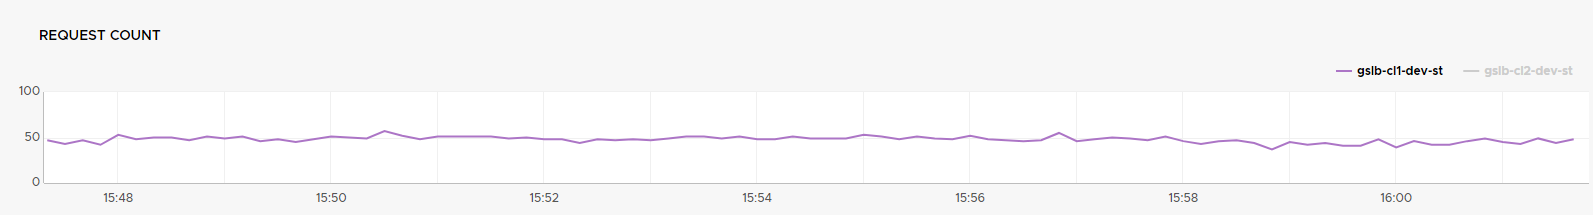
- To display the metric lines only for some of the clusters and hide the lines for the other clusters on a chart, in the cluster color-code legend above the chart, click the name of each cluster that you want to hide.
The chart displays the metric lines only for the selected clusters. The names of the clusters that you chose to hide appear gray in the cluster color-code legend.
This example shows that the Requests Count chart displays the metric line only for a cluster named gslb-cl1-dev-st and hides the line for the gslb-cl2-dev-st cluster.
- To display only the metrics that you want on the Performance tab, in the upper-right corner, click Chart Settings and select the check box next to each metric that you want to display.
You can select a maximum of four metrics to be displayed.
- To view the details and the infrastructure metrics for the nodes that contain the public service instances, click the Nodes tab.
To view the details of a node on the node details page, in the Node Name column, click the name of the node.
- To view the configuration of the public service, click the Configuration tab.