After you instantiate a Virtual Network Function (VNF), you can monitor its performance metrics and take corrective actions.
Prerequisites
Note: This procedure is not supported for network functions that are imported from partner systems.
Procedure
- Log in to the VMware Telco Cloud Automation web interface.
- Select Network Functions > Inventory.
- Click the desired network function to monitor.
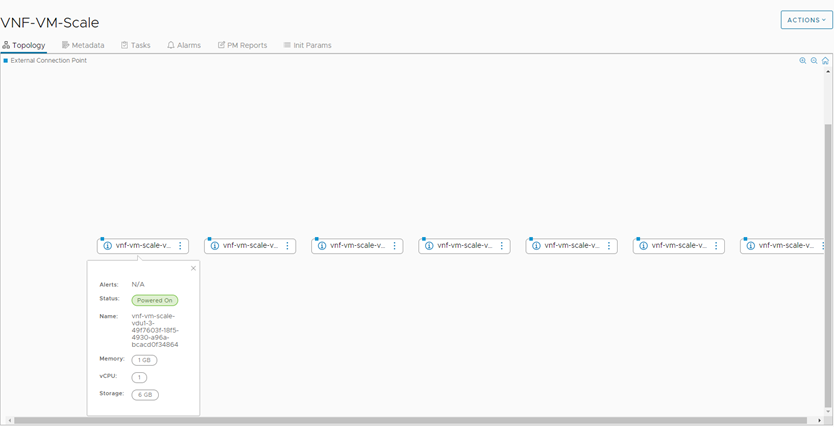
The network function topology is displayed.
- Perform the desired monitoring or management actions:

- To view more details of a Virtual Deployment Unit (VDU) such as alerts, status, name, memory, vCPU, and storage, click the i icon.
- To view more information about the virtual link, point at the blue square icon on the VDU.
- To view detailed information about the VDU and the VNFs, their performance data, alarms, and reports, click the ⋮icon on the desired VDU and click Summary. The details page provides the following tabs:
- Summary - Provides a detailed summary of the VDU.
- Alarms - Lists the alarms generated for the VDUs of the selected VNFs. You can acknowledge alarms from here.
- Performance Monitoring - Provides a graphical view of the performance metrics for CPU, Network, Memory, and Virtual Disk. For example, to view more information about the CPU performance, click CPU. For an overview of all metrics, click Overview. The performance metrics captured here are live with an interval of 1 hour.
- Reports - To set parameters for generating performance reports, click Schedule Reports. You can generate historic reports for a metric group, set the collection period, reporting period, and the reporting end date.
- To view historical tasks for a desired network function, go to Network Functions > Inventory and click the desired network function. The Tasks tab displays the historical tasks and their status.