


vRealize Operations communicates with all management components to collect metrics that are presented through various dashboards and views.
The deployment of vRealize Operations is a single instance of a 3-node analytics cluster that is deployed in the management cluster along with a two-node remote collector group.
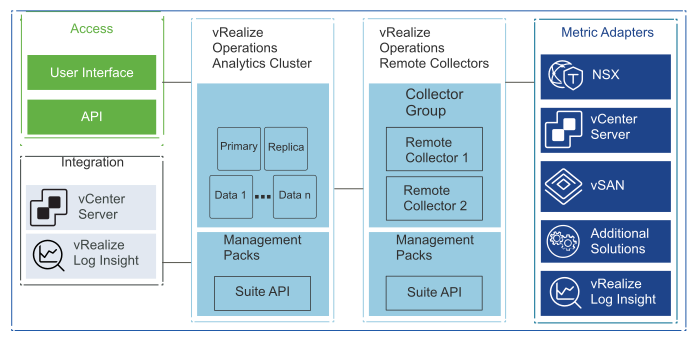
The analytics cluster of the vRealize Operations deployment contains the nodes that analyze and store data from the monitored components. You deploy a configuration of the analytics cluster that meets the requirements for monitoring the number of VMs.
Deploy a three-node vRealize Operations analytics cluster that consists of one primary node, one replica node, and one data node to enable scale-out and high availability.
This design uses medium-size nodes for the analytics cluster and standard-size nodes for the remote collector group. To collect the required number of metrics, add a virtual disk of 1 TB on each analytics cluster node.
You can use the self-monitoring capability of vRealize Operations to receive alerts about issues that are related to its operational state.
vRealize Operations displays the following administrative alerts:
System alert: Indicates a failed component of the vRealize Operations application.
Environment alert: Indicates that vRealize Operations stopped receiving data from one or more resources. This alert might indicate a problem with system resources or network infrastructure.
Log Insight log event: Indicates that the infrastructure on which vRealize Operations is running has low-level issues. You can also use the log events for root cause analysis.
Custom dashboard: vRealize Operations shows super metrics for data center monitoring, capacity trends, and single pane of glass overview.
Design Recommendation |
Design Justification |
Design Implication |
|---|---|---|
Deploy vRealize Operations as a cluster of three nodes:
|
|
All the nodes must be sized identically. |
Deploy two remote collector nodes. |
Removes the load from the analytics cluster from collecting application metrics. |
When configuring the monitoring of a solution, you must assign a collector group. |
Deploy each node in the analytics cluster as a medium-size appliance. |
Provides the scale required to monitor the solution. |
ESXi hosts in the management cluster must have physical CPUs with a minimum of 8 cores per socket. In total, vRealize Operations uses 24 vCPUs and 96 GB of memory in the management cluster. |
Add more medium-size nodes to the analytics cluster if the number of VMs exceeds 10,000. |
Ensures that the analytics cluster has enough capacity to meet the VM object and metric growth. |
|
Deploy the standard-size remote collector virtual appliances. |
Enables metric collection for the expected number of objects. |
You must provide 4 vCPUs and 8 GB memory in the management cluster. |
Add a virtual disk of 1 TB for each analytics cluster node. |
Provides enough storage for the expected number of objects. |
You must add the 1 TB disk manually while the VM for the analytics node is powered off. |
Configure vRealize Operations for SMTP outbound alerts. |
Enables administrators and operators to receive email alerts from vRealize Operations. |
Requires access to an external SMTP server. |
