The K4M UI is a Graphical User Interface (GUI) that helps you to design KPI Definitions, Threshold Collection, and KPI Streams. The K4M GUI eases the user to learn the KPI domain-specific language by providing a simple and clean interface, and handling the JSON creation in the background.
Preparing the Catalog before using KPI Designer
When designing a KPI Definition, the customer can have hundreds of metrics or reference data to select from. The content assistant helps user to browse and search the metrics used in the KPI calculation. The metrics and reference data must be configured before using the KPI designer through the Catalog service.
The Catalog service is accessible from KPI REST API at: http://localhost:8083/omega-stream/v2/catalog
- Name: Name of the catalog.
- displayName: Same as the name.
- type: Type of the catalog:
- metric: For metrics that show in the content assistant and the “Available Metrics” selection box.
- refdata: For reference data that shows in the content assistant and the “Available Reference Data” selection box. Where refdata function is not used and configured, the “Available Reference Data” selection box is hidden.
- values: Array of catalog items; in each catalog item:
- name: Name of the catalog item.
- description: Description of the catalog item.
- displayName: Same as name.
The following JSON payload is an example with one catalog item. The values array usually includes multiple catalog items.
{
  "displayName": "Your-Metric-Catalog-Name",
  "name": " Your-Metric-Catalog-Name",
  "type": "metric",
  "values": [
    {
      "catalogName": "This-Field-Is-Not-Required",
      "description": "Your-Metric-Description",
      "displayName": "Your-Metric-Name",
      "name": " Your-Metric-Name "
}
  ]
}
The catalog can be created by using the POST /catalog operation. The catalog item can be created by using the POST /catalog/{catalogID} operation.
The catalog can be retrieved by using the GET /catalog operation. The catalog item can be retrieved by using the GET /catalog/{catalogID} operation.
The catalog can be updated by using the PUT /catalog/{catalogID} operation. The catalog item can be updated by using the PUT /catalog/{catalogID}/{catalogItemID} operation.
The catalog can be deleted by using the DELETE /catalog/{catalogID} operation. The catalog item can be deleted by using the DELETE /catalog/{catalogID}/{catalogItemID} operation.
After the metric/refdata catalog is configured, they can be displayed in the content assistant and selection box of KPI Definition page, which will be covered in the following sections.
Navigate to KPI UI
Click KPI Designer, at the left side navigation panel, the KPI Designer displays in the content area.
- KPI Streams: Provides a list of KPI streams.
- KPI Designer: Provides a list of KPI definitions.
- Threshold Designer: Provides a list of threshold collections.
- Enrichment Streams: Provides a list of enrichment streams.
KPI Streams Page
On the KPI Streams page, you can browse, edit, delete, deploy, undeploy, verify job detail, and export the created KPI Streams.
In the KPI Stream list, at the beginning of each row, there is an action button similar to the KPI Definition list.
- Edit: Allows you to edit the selected stream.
- Delete: Allows you to delete the selected stream.
- Deploy: Allows you to deploy the selected stream. This menu item shows when the stream is not deployed.
- Undeploy: Allows you to undeploy the selected stream. This menu item shows when the stream is deployed.
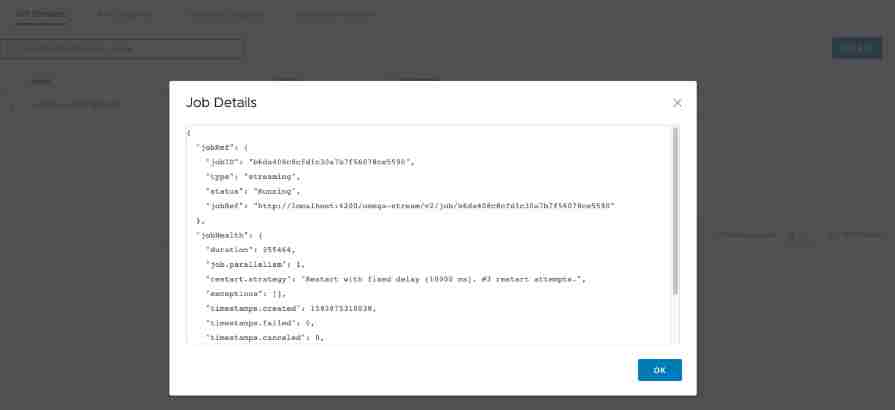
- Job Detail: Displays the job detail of the selected stream.
- Export: Exports the stream configuration DSL (Domain-Specific Language) in the JSON format.

- Created: When the stream is saved, but not deployed to the streaming engine yet, the status displays as CREATED in the blue color.
- Running: When the stream is deployed, the status shows as RUNNING in the green color.
- Cancelled: When the stream is undeployed, the status shows as CANCELLED in the green color.

KPI Stream Page
To navigate to the KPI Stream page, click CREATE. The KPI Stream page allows you to create or edit a KPI Stream. In Create mode, a blank KPI Stream page is displayed. In Edit mode, the page is populated with the selected KPI Stream.
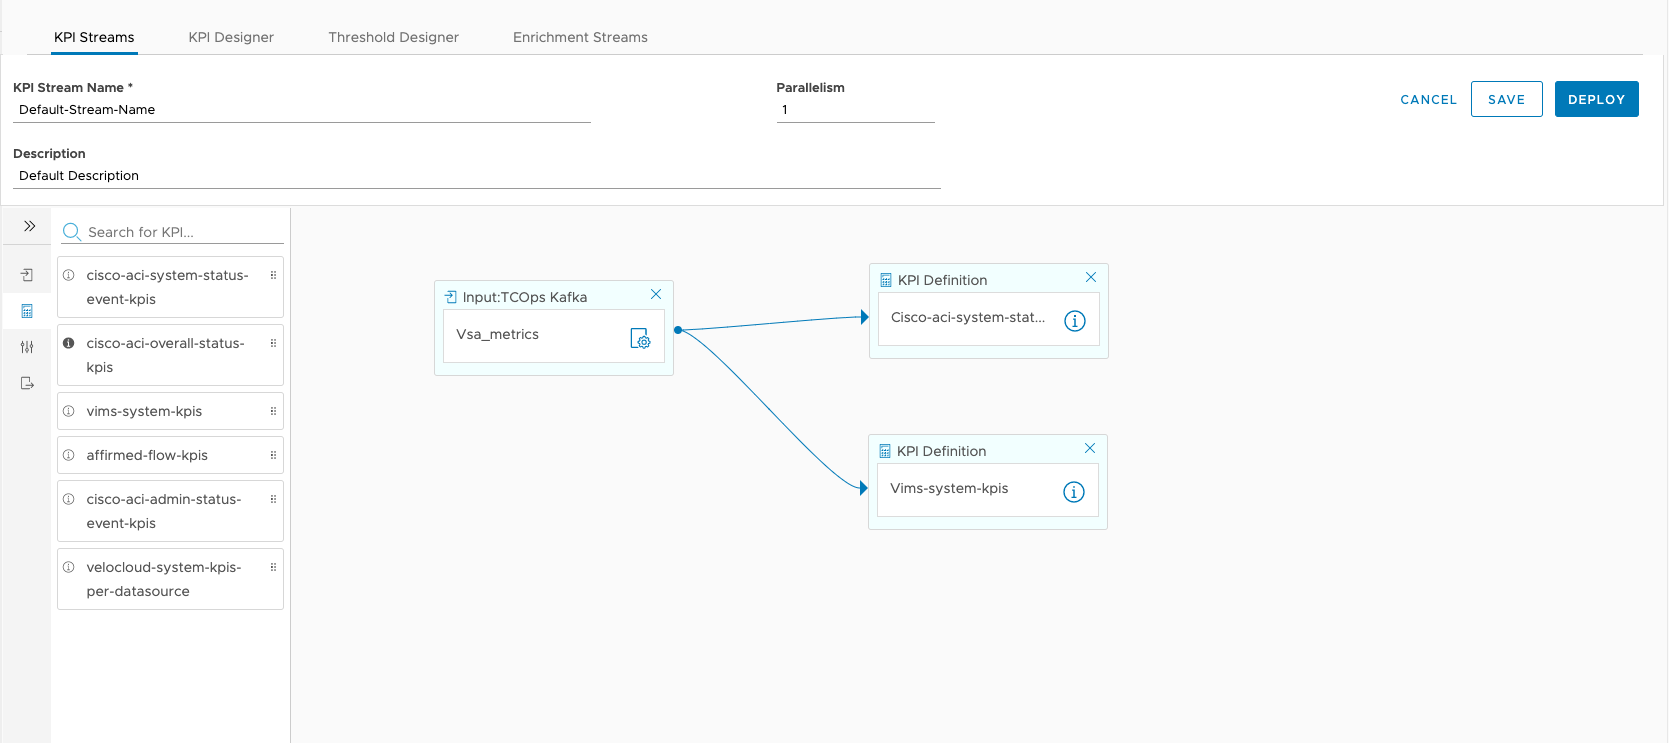
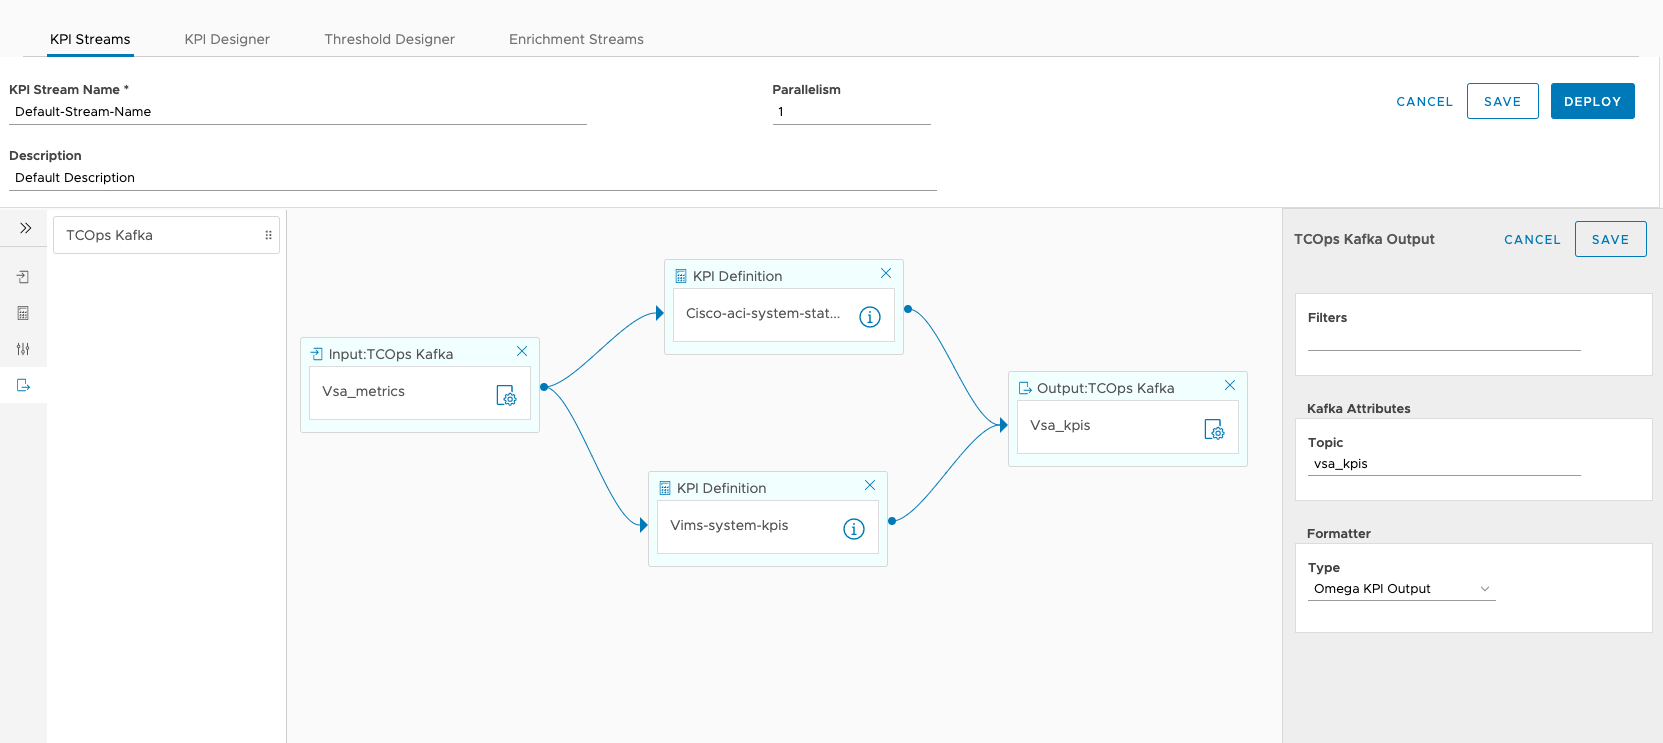
There are three sections as shown in the following figure. The stream form on the top of the page, the component categories at the left side panel, and the workspace in the content area.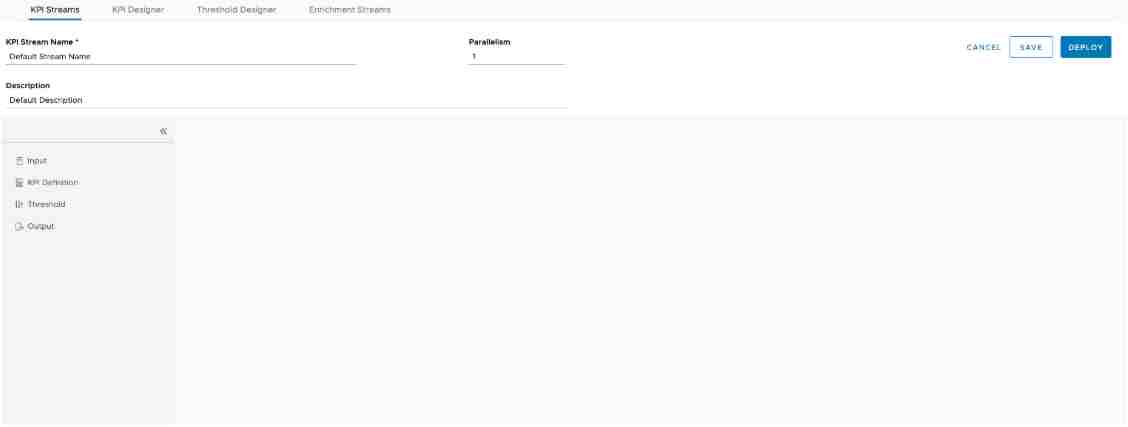
- Name: Name of the stream
- Description: Description of the stream
- Parallelism: Parallelism of the stream
- Input: Input components that receive events.
- KPI Definition: Contains the pre-configured KPI Definitions. When there are too many KPI Definitions to browse, you can use the search box on the top of the palette to search the desired KPI Definition.
- Threshold: Contains the pre-configured Threshold Collections. When there many Thresholds Collections to browse, you can use the search box on the top of the palette to search the desired ones.
- Output: Output components that publish events.
Input Components: Only one input component is supported in this release.
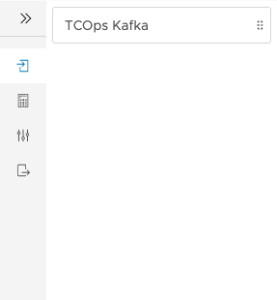
VMware Telco Cloud Operations Kafka Input: VMware Telco Cloud Operations stream internal Kafka broker.
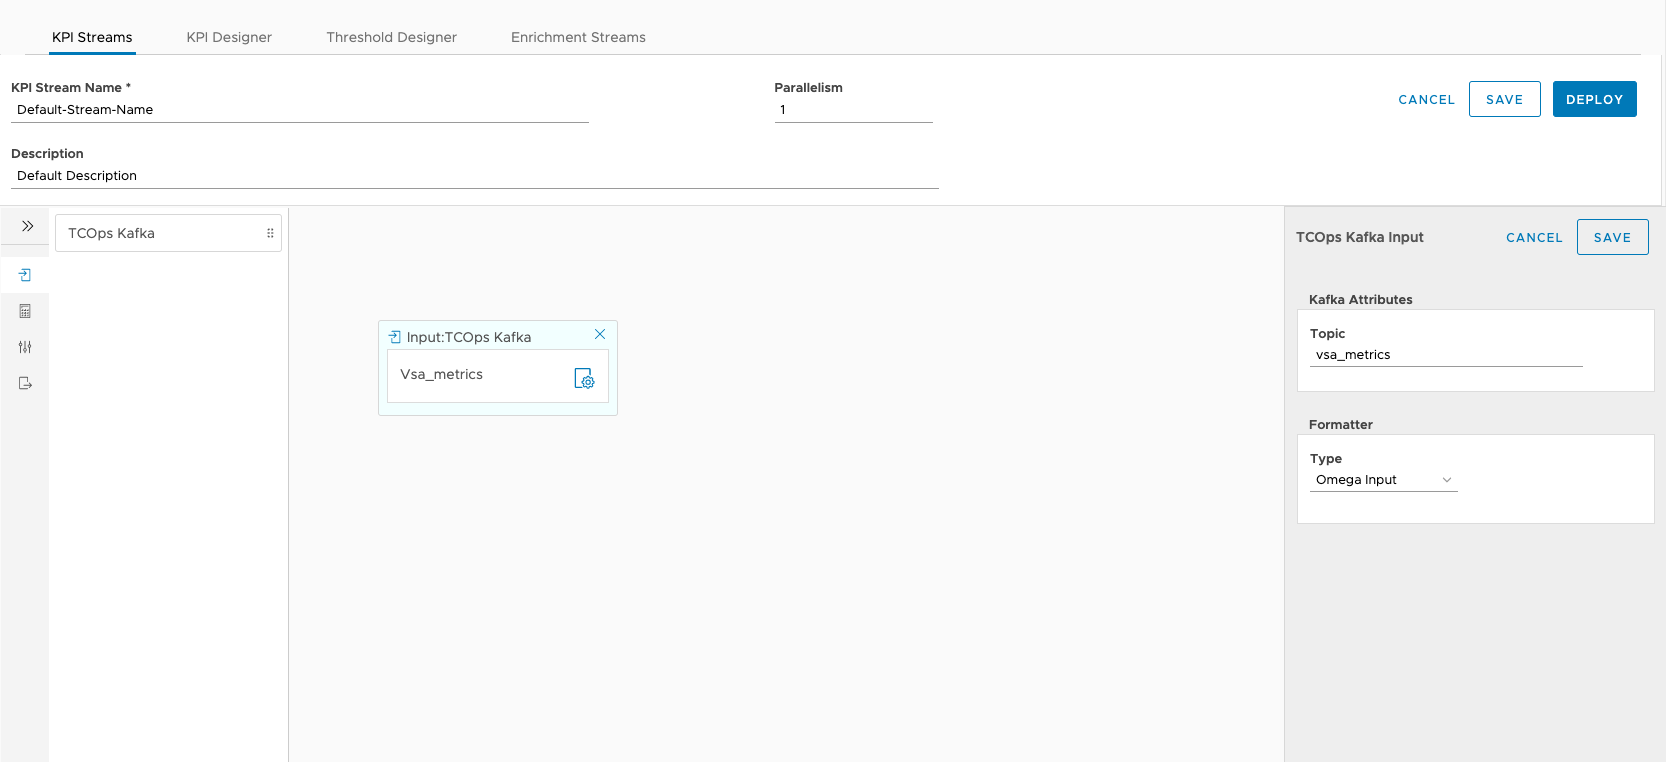
To add the component to the enrichment stream, use drag to move the default Kafka Input to the workspace.
- Topic: Kafka input topic.
- Formatter: To format the input event to the internal data model.
KPI Definition components
The KPI definitions palette contains previously configured KPI definitions. After a KPI definition is saved to the backend server, it displays as following:
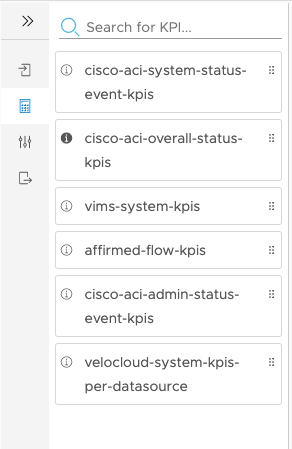
You can drag one or more KPI definitions to the workspace. A connection between input components and the KPI definition is added. The connection indicates the data flow direction:
To view the summary of the KPI Definition, click the information icon on the KPI Definition component. Following summary is displayed in a popup window: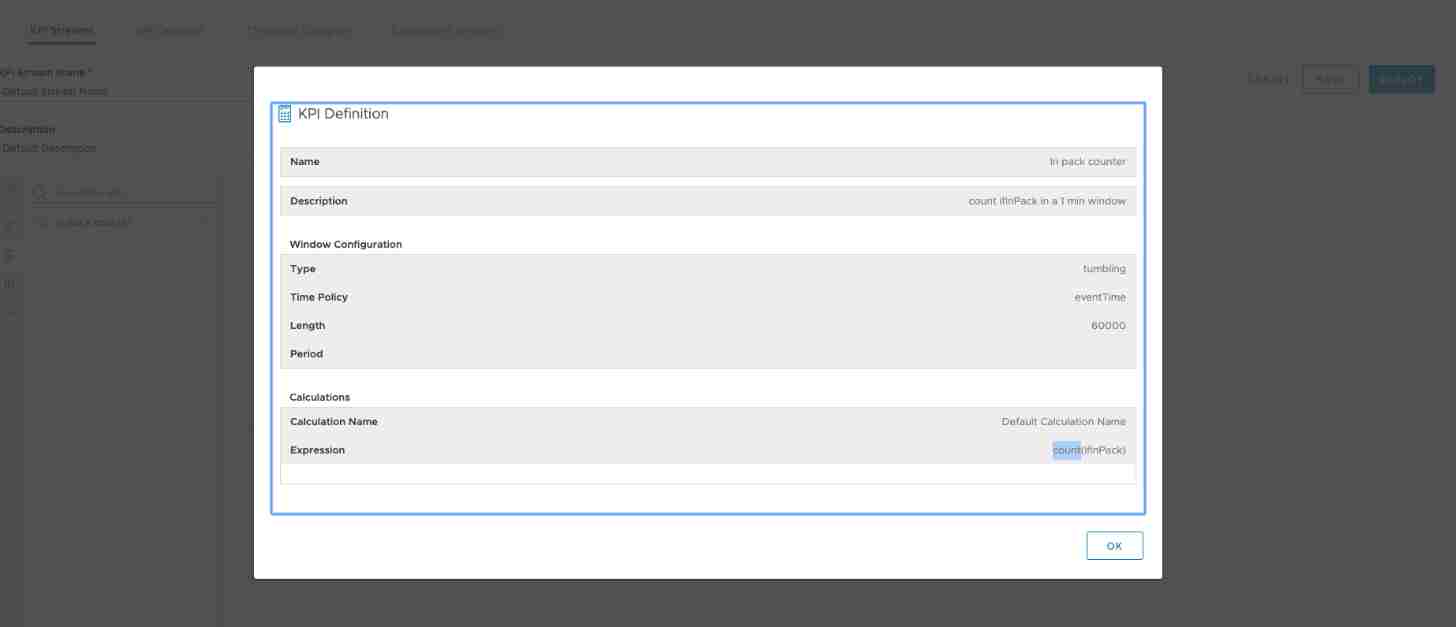
To close the popup window, click OK.
Threshold components
The Threshold window contains previously configured thresholds. After a threshold is saved to the backend server, it displays in the following palette:
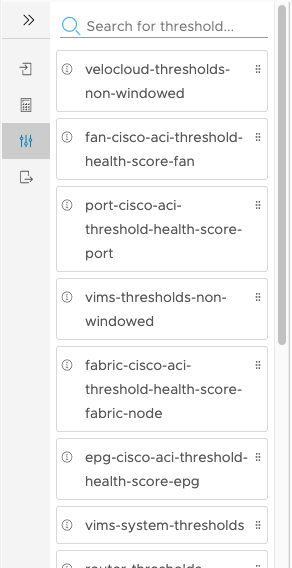
To view the summary, click the information icon on the threshold component. The summary is displayed in a popup window as following:
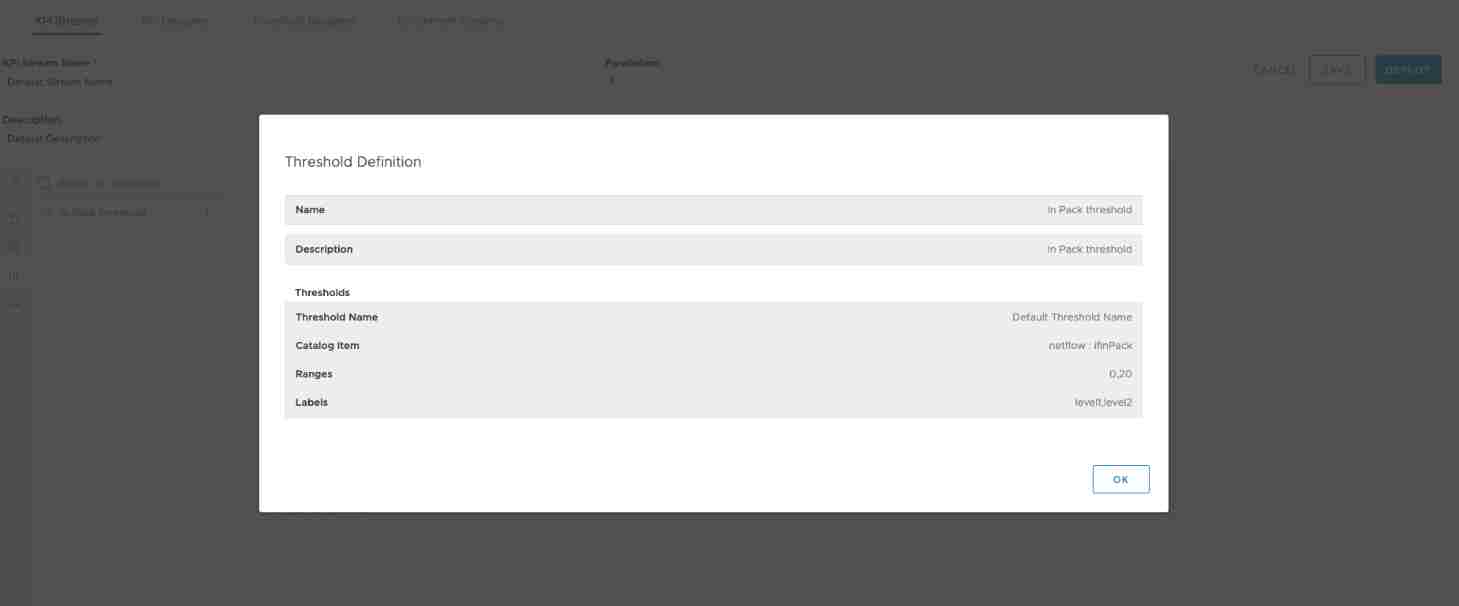
To close the popup window, click OK.
Output components
Only one output component supported, VMware Telco Cloud Operations Kafka.
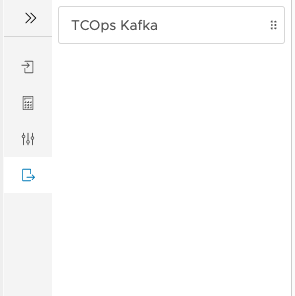
VMware Telco Cloud Operations Kafka Output
To add the component tot the stream, drag the VMware Telco Cloud Operations Kafka to the workspace. A connection between the KPI definition and the Kafka output is added to indicate the data flow direction.
- Filters: SpEL (Spring Expression Language) expression evaluated to be true or false. The evaluation result is used as the filter condition to apply to the event. For example: filter metadata['storagePoolId'] == '3921' allows only event with metadata storagePoolId equals to 3921 being published to the output Kafka topic.
KPI Definitions Page
In KPI Definitions page, you can browse, edit, export, or delete the list of created KPI Definitions. You can also create KPI Definition.
In the KPI Definition list, at the beginning of each row, there is an action button (three vertical dots).
Click the action button, the action menu appears.
On the action menu, there are three action menu items Edits, Delete, and Export, as following:
To edit the selected KPI Definition, click Edit.
To delete the selected KPI Definition, click Delete.
To export, and download the JSON file of the selected KPI Definition, click Export.
Click CREATE. The page navigates to the KPI Definition page, where you can create KPI Definition.
KPI Definition Page
KPI Definition page allows you to create or edit the KPI definition. In Create mode, a blank KPI Definition page is displayed. In Edit mode, the page is populated with the selected KPI definition.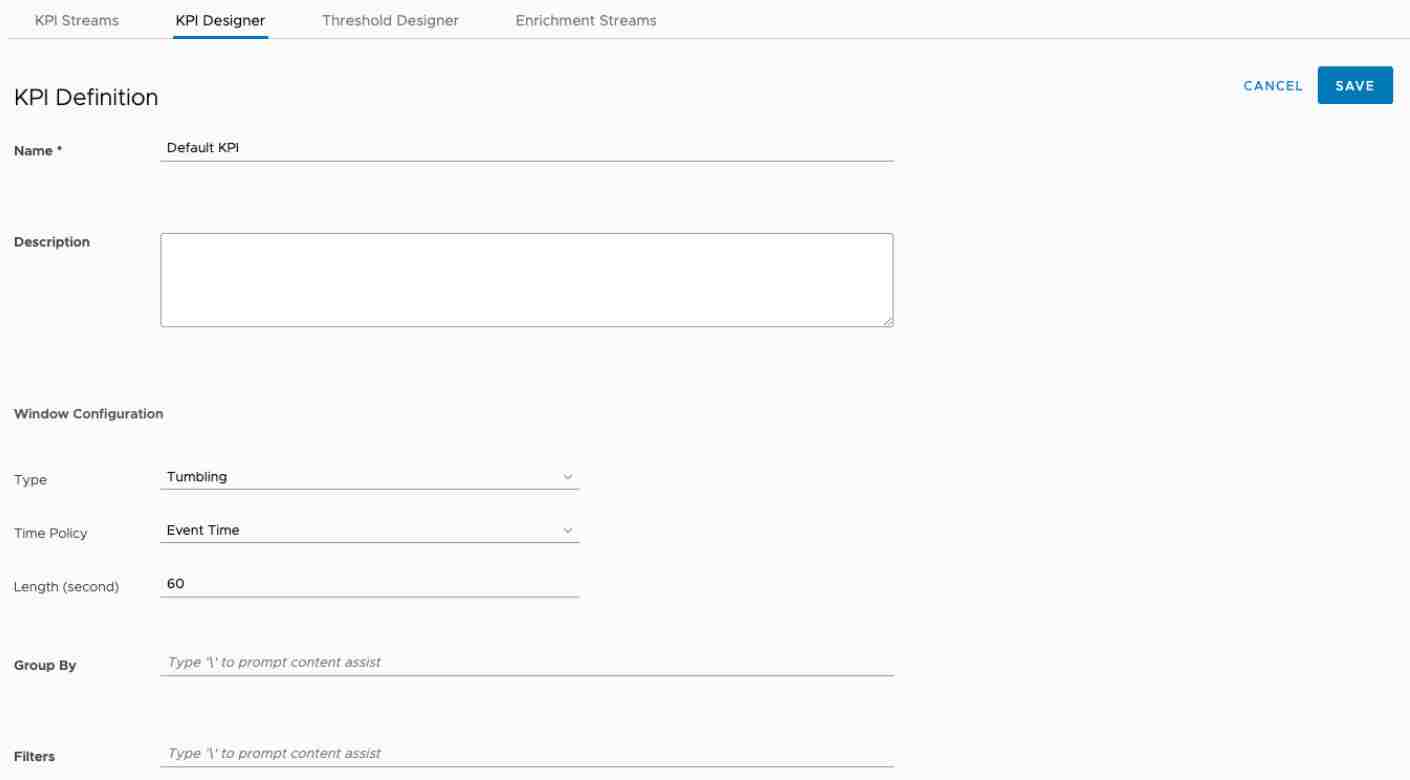
- Name: Name of the KPI Definition, a mandatory text box.
- Description: Description of the KPI Definition.
- Window Configuration: KPI calculation window configuration, which includes four subfields:
- Type: Acceptable op
- Sliding: Select, Sliding, the Period text box appears.
- Tumbling: Select, Tumbling, the Period text box becomes hidden.
- Time Policy:
- Event Time: Use event time for calculation. System adds the Event time where/when the event is generated.
- Processing Time: Use processing time for calculation. Processing time is added when KPI Engine receives the event for calculation. Compare with the Event time, the Processing Time is less accurate on reflecting when the event happens.
- Length: Length of the window in second.
- Period: Period of the sliding window in second.
- Type: Acceptable op
- Group By: Which text box is used to group the metrics for the aggregation calculation. When the pointer is in this input text box, the user can press “\” to show the content assistant.
- Filter: Which text box is used to filter the metrics. When the pointer is in this input text box, the user can press “\” to show the content assistant.
As an example, the following figure displays the content assistant for the Group By text box :
In the KPI Definition page, you can configure one or more calculations in the Calculations section.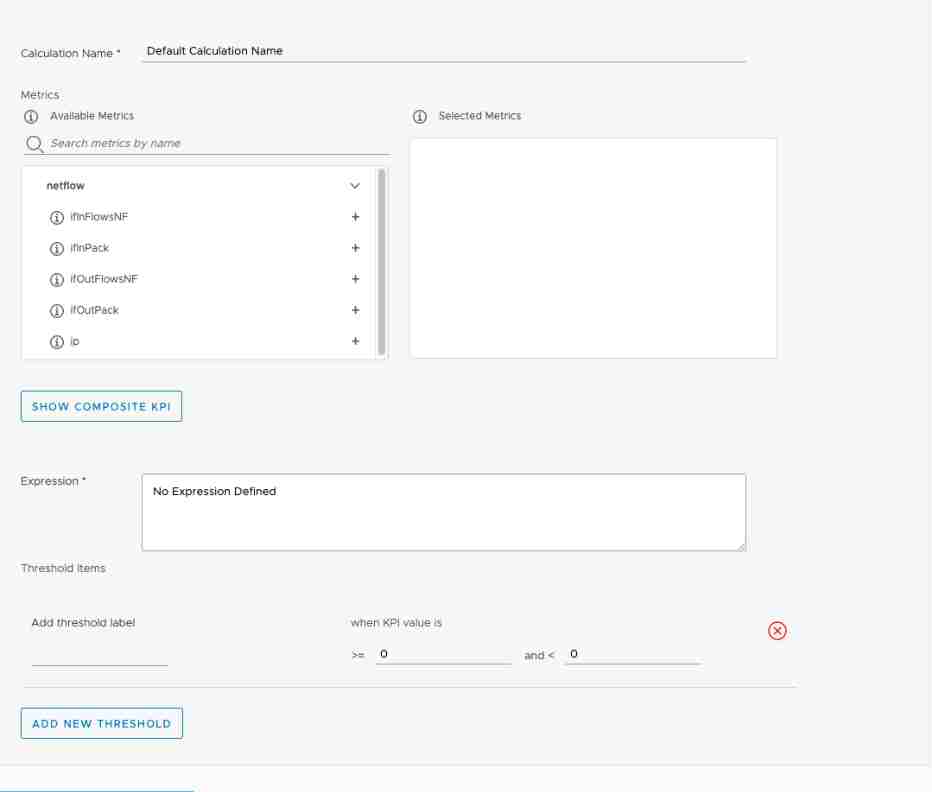
- Calculation Name: Name of the calculation.
- Metrics: You can select the metrics from the Available Metrics box by selecting the metric name, and click the metric name to remove the metrics from the Selected Metrics box. When you hover over the information icon, the configured description for the metrics displays as a tooltip.
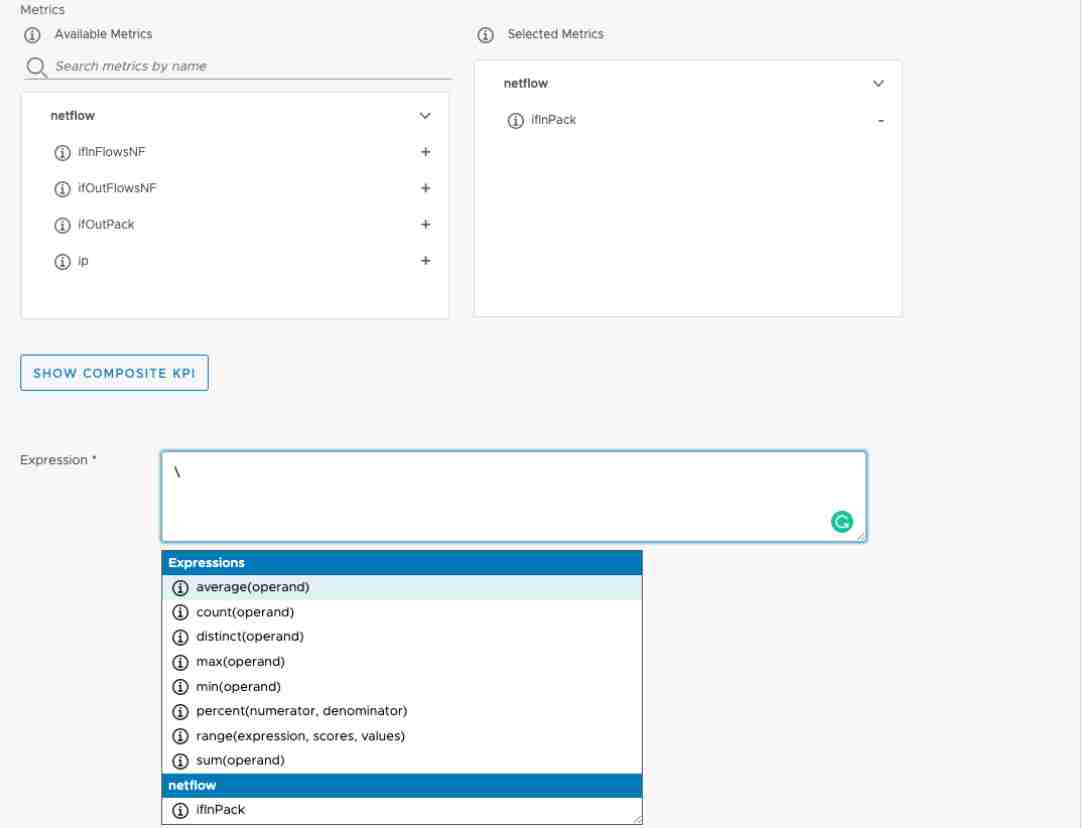
- Expression: Calculation expression. Pressing “\” shows built-in expressions and user selected metrics. The following figure shows the content assistant for Express text box, where the built-in expressions and user-selected metric are listed:
Composite KPI allows you to define a KPI by using KPI calculations and thresholds defined in a different KPI definition or Threshold definition.
The user interface provides the selection component to present the calculations and thresholds catalog, to facilitate you to select existing calculations and thresholds and use them in the expression.
The selection boxes for KPI and Threshold are hidden initially.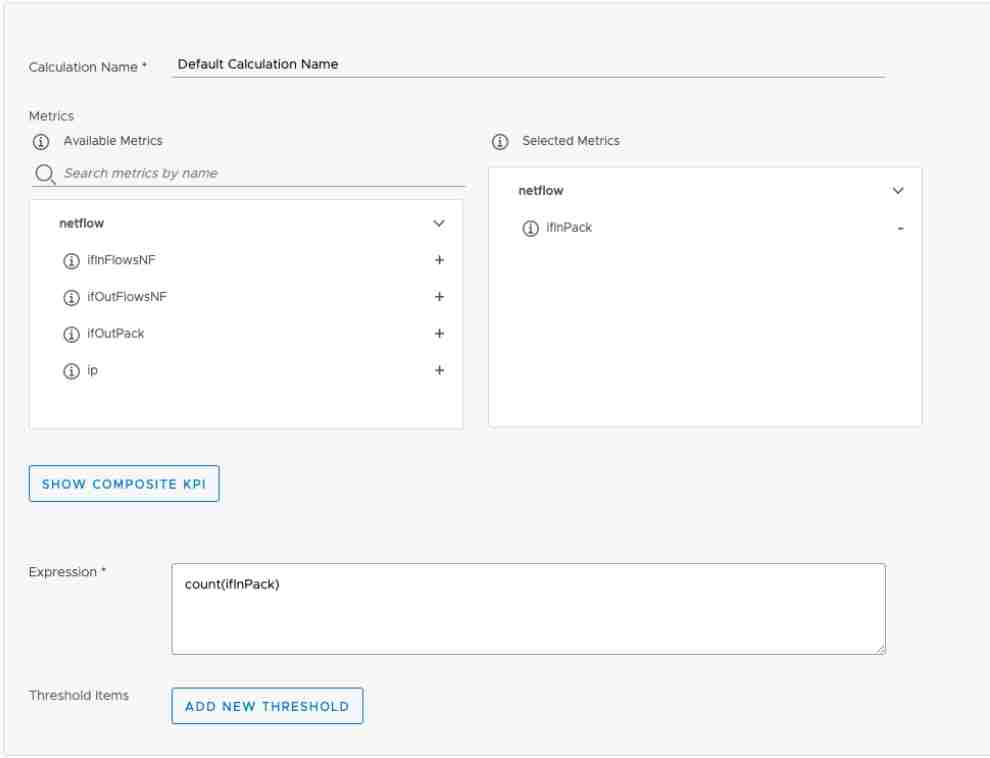
To view the selection box, click SHOW COMPOSITE KPI.
To hide the selection box, click HIDE COMPOSITE KPI.
You can use the search bar to search the KPIs and Thresholds.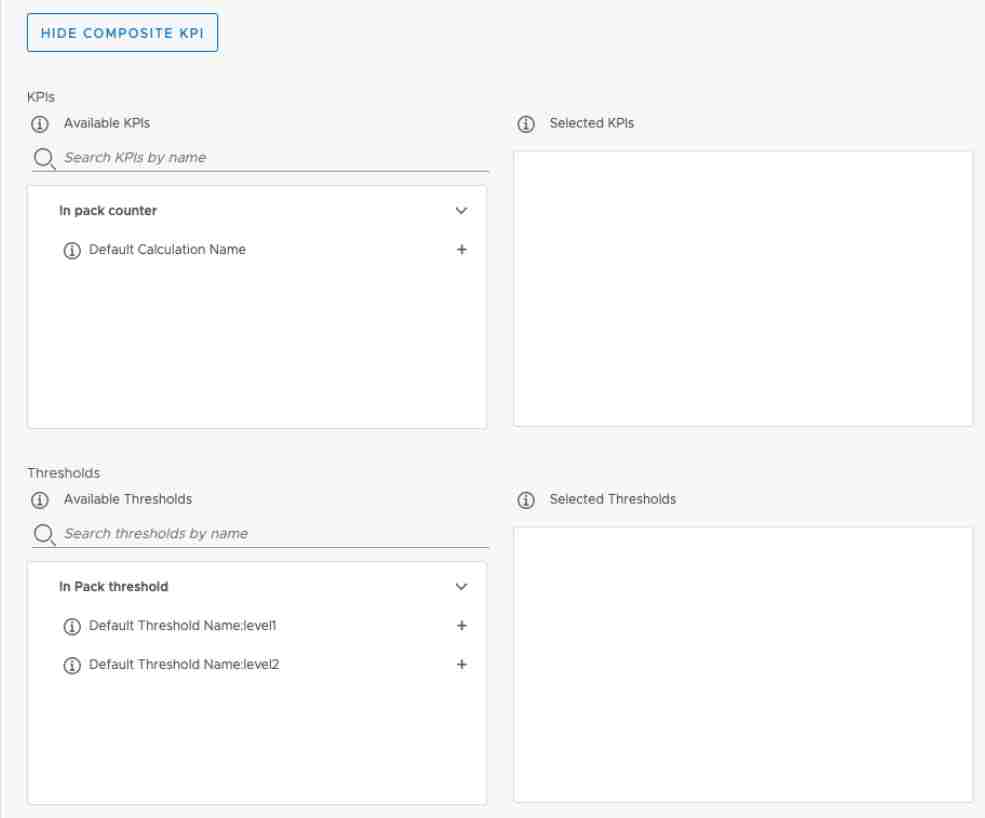
Select KPI or Threshold, in the Available box, respective available KPI, and Threshold appears in the Selected boxes as displayed. 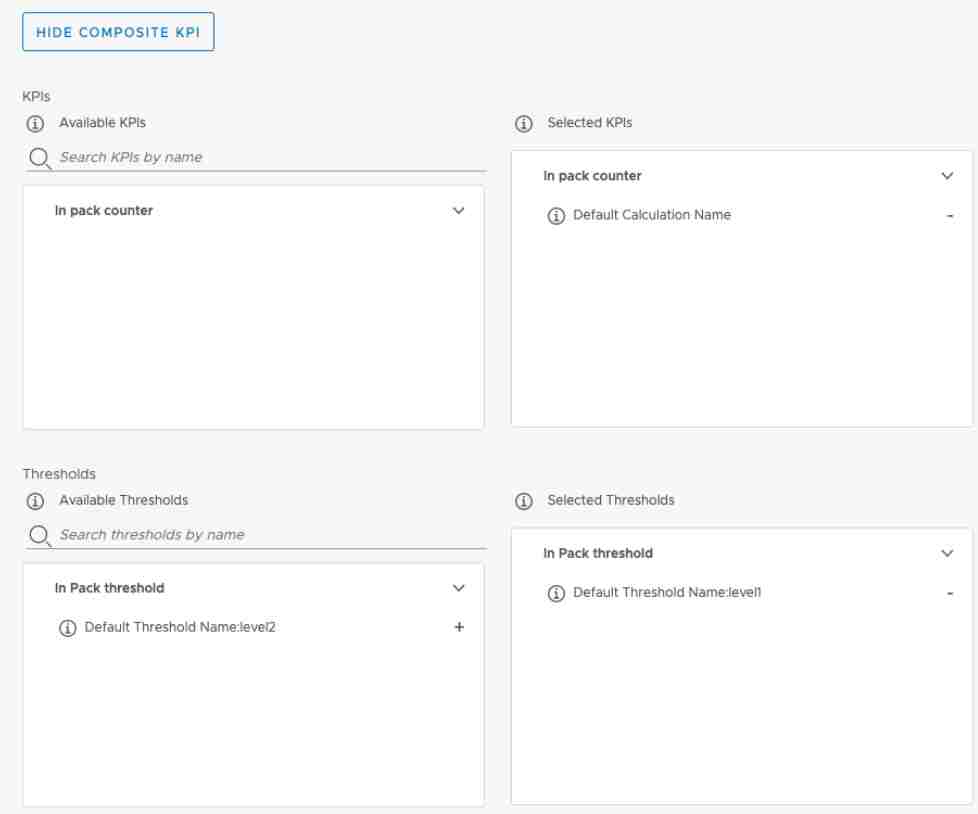
The KPI definitions are sorted by the KPI definition name. The calculations are listed under the KPI definition name.
The Thresholds are sorted by the threshold collection name. Under the threshold collection name, the thresholds are listed in thresholdName:thresholdLabel format.
After the KPIs or thresholds are selected, they are available in the expression content assistant menu. The content assistant menu appears, when you enter the '\'.
Select the Threshold in the menu, the thresholds is inserted into the current editing location.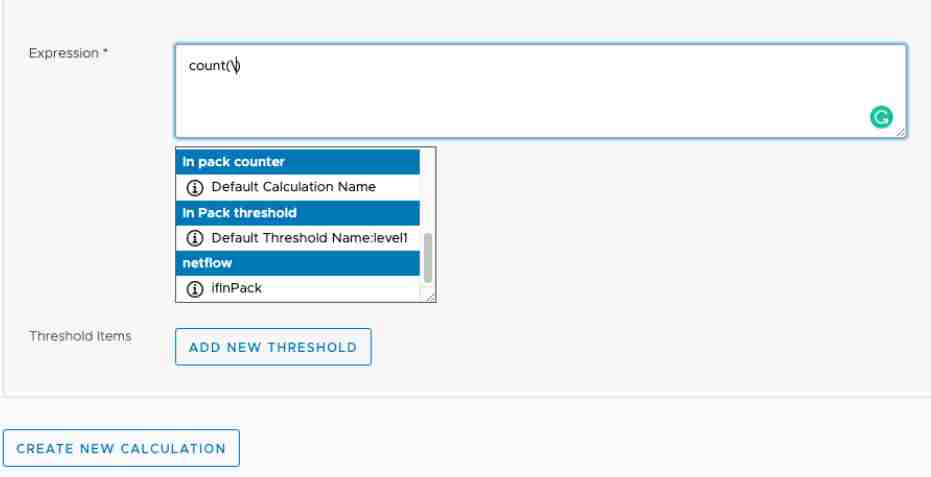
For the KPI threshold, refer to the Window-Based Threshold section for detail.
To create more calculation, click CREATE NEW CALCULATION. When two or more calculations are configured, the delete button appears in the calculation section to allow you to delete an undesired calculation configuration.
To save the KPI Definition, click SAVE. The page navigates to KPI Definitions page after the KPI Definition is saved.
When editing a KPI definition, you can clone the current KPI Definition and makes minor changes in certain text boxes. You can click CLONE, the Name text box of the KPI Definition is changed to Clone of Previous-Name (change me please). You can make want changes on the text boxes, rename the KPI Definition, and click SAVE to save the new KPI Definition.
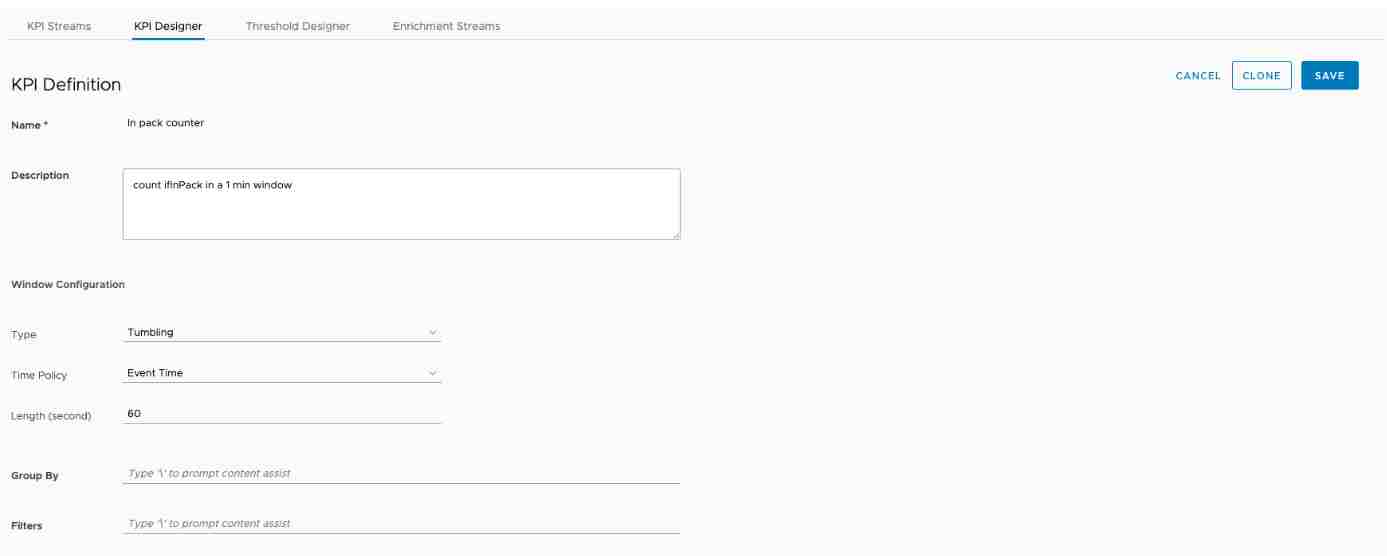
The CANCEL button allows you to cancel the current edition, and navigate back to the KPI Definition list page.
Thresholding Function
The thresholding function allows you to tag the stream event (non-windowed threshold) or KPI calculation result (window-based threshold) with threshold labels. The following section introduces the configuration of the non-windowed threshold and window-based threshold through threshold GUI.
Window Based Threshold
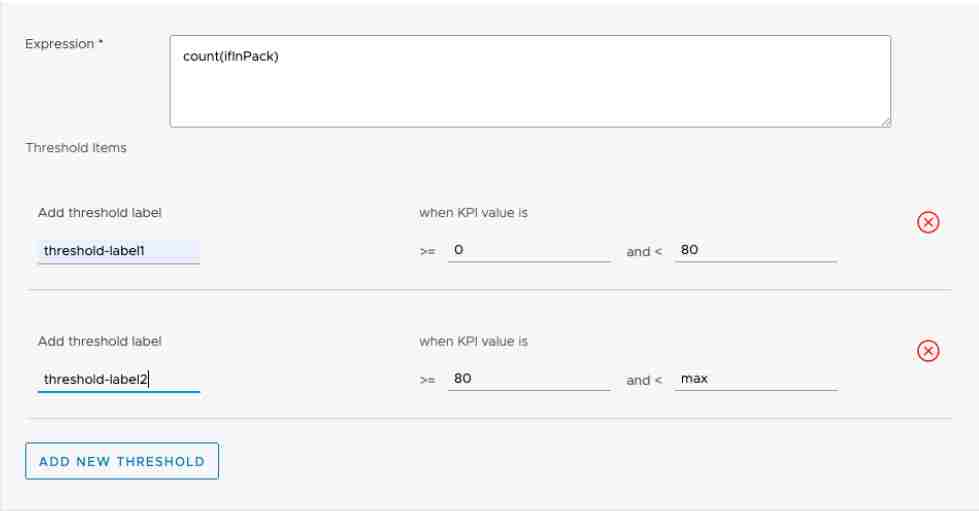
The window-based threshold is always associated with a KPI calculation result. The configuration for the window-based threshold is located in the KPI Definition page, so that you can verify the KPI calculation configuration when configuring the threshold.
The threshold configuration is under the Expression section. Click ADD NEW THRESHOLD, is added.
Click the cancel icon on the threshold item, the corresponding threshold item is removed.
- Threshold label: A threshold label is added to the KPI calculation result when the KPI value is between the configured threshold values.
- Threshold values: The value range of the KPI value to trigger a threshold label to be added.
Hidden Threshold
When the events flow into the stream, the hidden threshold allows the event to be tagged with a configured threshold label, and if the event value is between a configured range.
To navigate to the threshold list page, click Threshold Designer. Where the configured hidden threshold displays in the list:
- To navigate to the threshold creating/editing page, click Edit. Where you can edit the threshold configurations.
- To delete the selected threshold configuration, click Delete.
- Click Export, the selected threshold configuration is exported in a JSON format.

To navigate to Threshold Collection, click CREATE. Where multiple thresholds can be configured on the page.
- Name: The name of the threshold collection.
- Description: The description of the threshold collection.
- Filter: SpEL (Spring Expression Language) expression evaluated to be true or false. The evaluation result is used as the filter condition to apply to the event. For example: filter metadata['storagePoolId'] == '3921' allows only event with metadata storagePoolId equals to 3921 being processed. Enter '\' shows the content assistant menu.

- Threshold Name: The name of the threshold.
- Catalog: A catalog includes a collection of event metrics. By selecting the catalog, the corresponding event metrics are shown in the Catalog Item select text box.
- Catalog Item: The event metric name that the threshold is configured against.
- In the Threshold Items section, the threshold item row can be added by clicking the ADD NEW THRESHOLD LEVEL button. By clicking the cancel icon on the threshold item, the corresponding threshold item is removed. Each threshold item row has the following text boxes:
- Threshold label: A threshold label to be added to the event when the event metric value is between the configured threshold values.
- Threshold values: The value range of the event metric value to trigger a threshold label to be added.
Note: The second value in a row will be auto-filled as the first value in the next row. The values have to be in ascending order for this release.
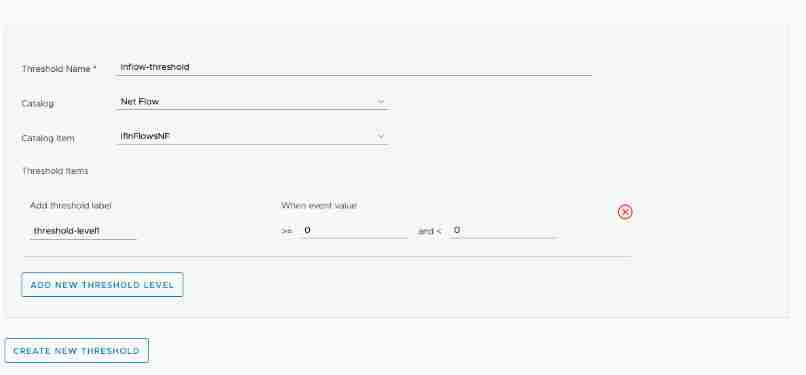
Click CREATE NEW THRESHOLD, a new threshold section is added.
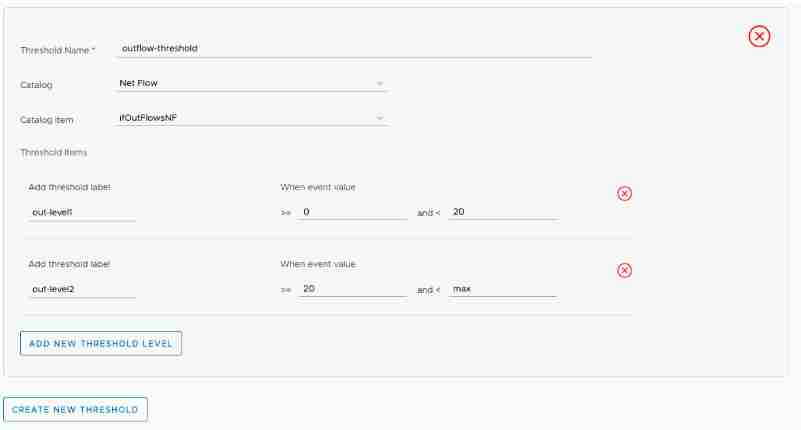
After the thresholds are configured, Click the SAVE, to save the threshold collection configuration.