In this topic, you can find information on viewing Smart notification collector reports.
Prerequisites
To start the data flow, you must start the Smart Notification and Topology collector, see the Collector in VMware Telco Cloud Operations Configuration Guide for more information.
Procedure
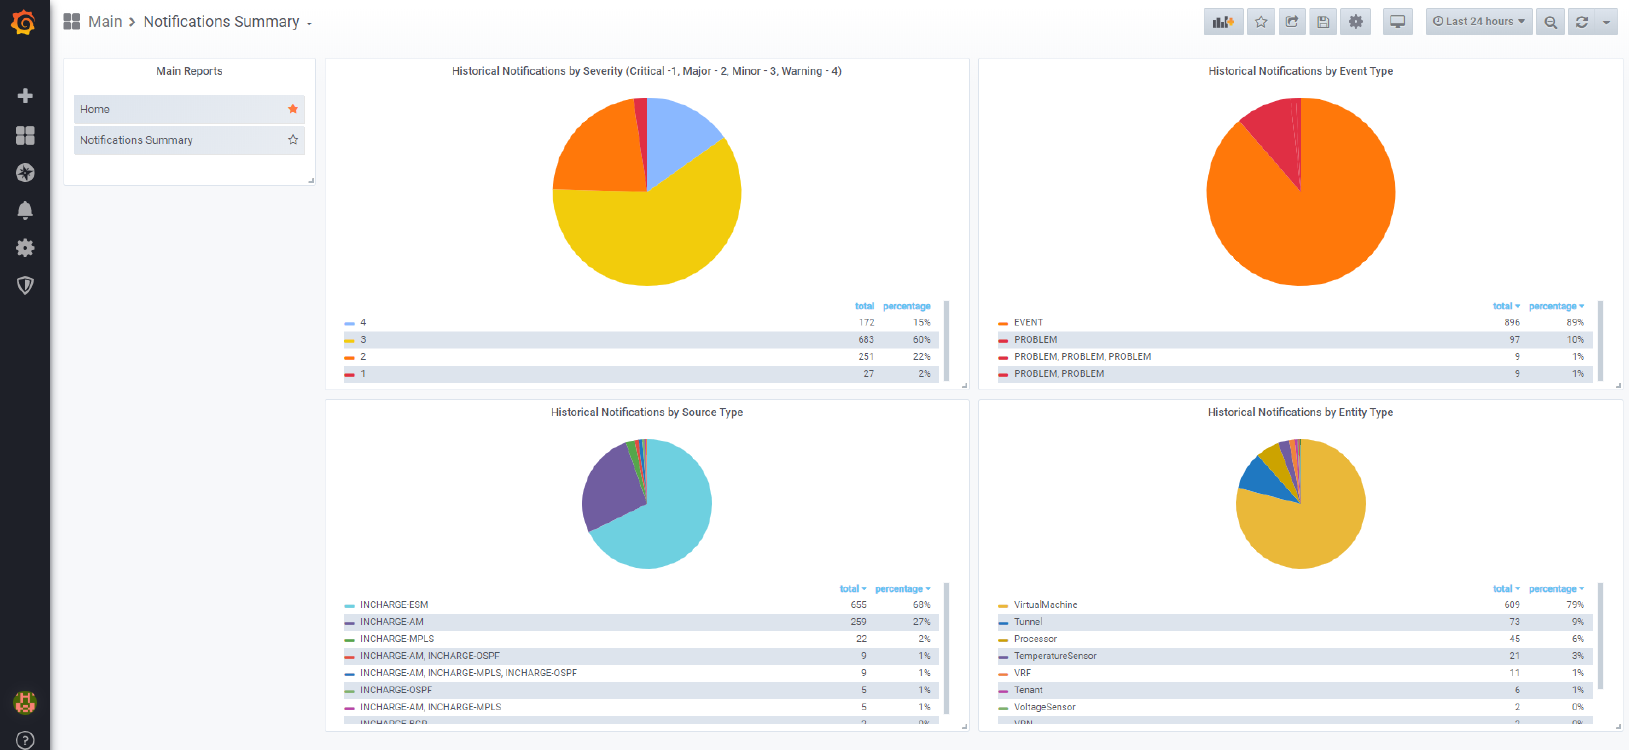
- To view the notification summary report, click Notification Summary.