


- Fully automated deployment: both phases use the Deploy-Tool
- Fully manual deployment: VMs are deployed through vCenter and when Clusters are deployed through the Deployment UI
- Semi-automated deployment: VMs are deployed using the Deploy-Tool and Cluster are deployed through the Deployment UI
Troubleshooting Tools
Troubleshooting can be done offline (without direct access to the system) or online by logging into the system.
Offline:
1. Using the VM-Level Diagnostic Tool which is a command-line tool. Details explained in the next section.
2. Using the VMware Telco Cloud Operations GUI. Further details provided in the VMware Telco Cloud Operations User Guide in the Collecting troubleshooting Information section.
Online access. When the user can login to the TCOos Custer they can use the following means
Online:
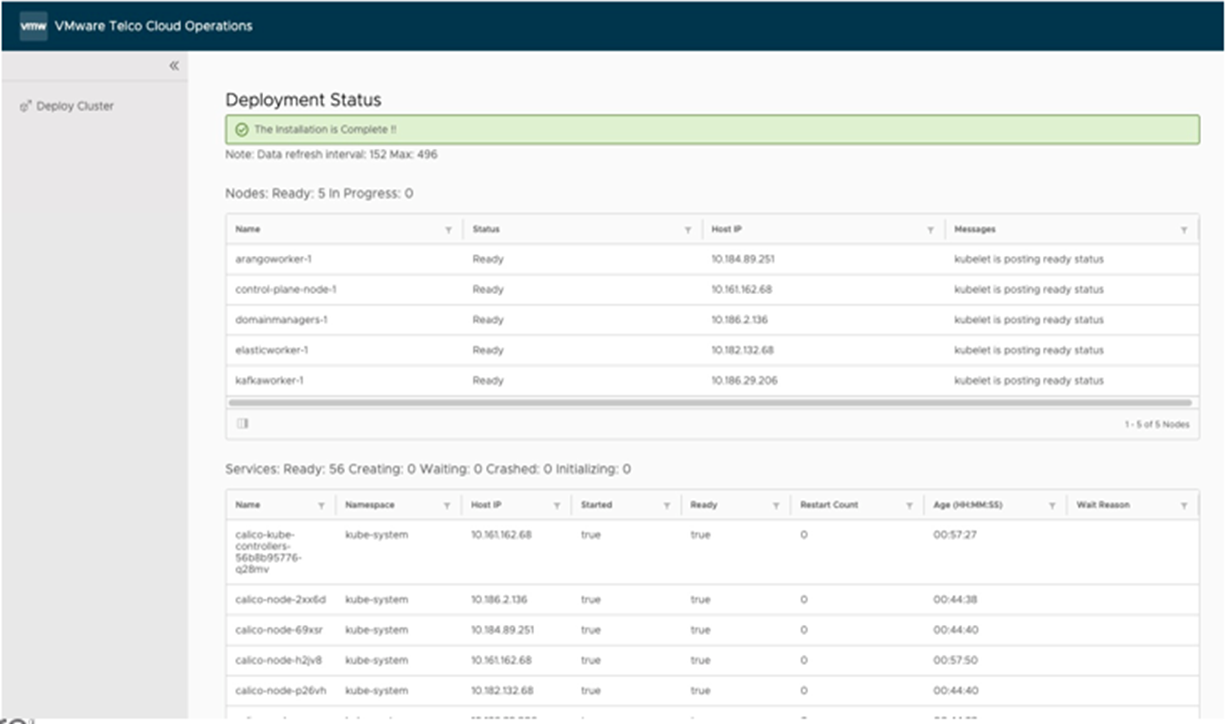
1. View Health Status Report/Dashboard). Details in the VMware Telco Cloud Operations User Guide.
2. Examine log files for application and system services on each VM. These include deployment process logs. System-level details can also be reviewed.
Troubleshooting Process
Role of Deploy Server
After VM deployment a system service known as the Deploy Server runs on each VM. This service is responsible for cluster deployment. The Deploy Server on the control plane node receives a cluster deployment POST request from either the Deploy-Tool or Deployment UI. The server verifies the footprint resources for all VMs and indicates if a verification fails and stops deployment. If verification succeeds, the server deploys Kubernetes nodes across the VMs by calling other system services. Each of the following steps are logged on each VM:
i. Creates control-plane-node on the CPN VM. Kubernetes and Harbor services are running.
ii. Pushes application services images to the Harbor registry.
iii. Sends messages to worker VMs to begin deployment with Kubernetes details.
iv. On each worker VM, the Deploy Server connects the worker node to the control-plane-node.
v. On the CPN VM, calls on Kubernetes to deploy pods across all worker nodes.
When deployment completes successfully, the Deploy Server is shut down on all worker VMs to avoid exposing port 4960. The Deploy Server continues to run on the control-plane-node.
All the above steps get logged on each VM and checking status and logs for Deploy Server and system services is one of the main methods of troubleshooting deployment.
Successful Deployment Indicators
Upon successful deployment you should see the following messages:
1. Fully automated deployment: when both the VM and Cluster deployment are complete.
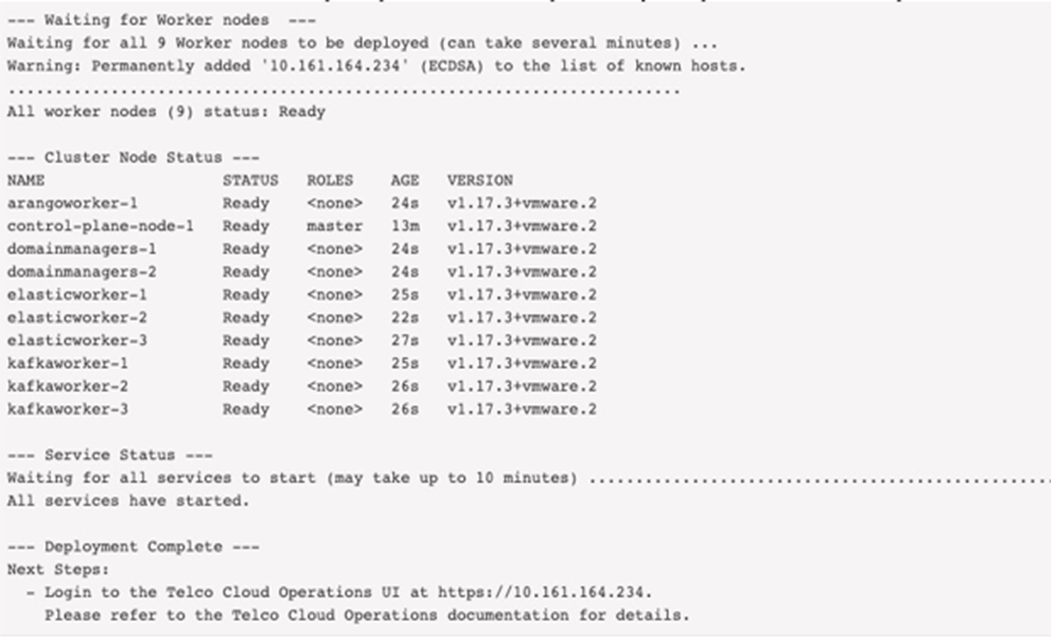
2. Semi-automated deployment: after the VM deployment steps completes correctly you will see the following:
T--- VM Deployment Complete ---
All VMs have been deployed.

Next Steps:
  1. Login to the Deployment UI at https://10.161.176.131:1081 to begin deploying the cluster and services.
      username : clusteradmin
      password : ADMIN_PASSWORD value in deploy.settings
  2. Please refer to the Telco Cloud Operations Deployment Guide for further details.
If there are errors the Deploy-Tool outputs the details to the terminal and stops.
3. Semi-automated or manual: when VM deployment completes succesfully:
Deployment Version and Build
To find out the version and build details of a VMware Telco Cloud Operations deployment, login to the control-plane-node as clusteradmin. Run the following command to view the details as shown below:
$ cat /etc/tco-release
— About this Artifact —
File: VMware-TCOps-Control-Plane-Node-1.3.0-1.ova
Company: VMware
Product: TCOps
Artifact: Control-Plane-Node
Version: 1.3.0
Build Id: 1
- File: This is the name of the OVA file used to deploy the Virtual Machine.
- Version: The product version.
- Build Id: The identifier of the specific build.
$ cat /etc/tco-release
— About this Artifact —
File: VMware-TCOps-Control-Plane-Node-1.2.0-8.ova
Company: VMware
Product: TCOps
Artifact: Control-Plane-Node
Version: 1.3.0
Build Id: 1
Specific Deployment Issues
- Log into the control plane node as clusteradmin.
- Check the status.
$ sudo systemctl status [email protected]
- View the service log.
$ sudo journalctl –u [email protected]
- If necessary, restart the Deployment UI.
$ sudo systemctl start [email protected]
When using the Deploy-Tool you may see the following error message (this is an example and IP addresses will vary per the user’s deployment).
Starting deployment on Control Plane Node VM : 10.107.8.143
ERROR: Cluster deployment failed !
Please verify that the Control Plane Node VM [10.107.8.143] and worker VMs (IP addresses listed above)
have been deployed correctly and powered ON. Refer to the Deployment Troubleshooting Guide for further steps.
HTTP status code: 400
Response Received:
{"error":"Error:NodeName:elasticworker:IP:10.107.8.203 Server Not reachable\n\nError:NodeName:elasticworker:IP:10.107.8.170 Server Not reachable\n\nError:NodeName:domainmanagers:IP:10.107.8.85 Server Not reachable\n\nError:NodeName:kafkaworker:IP:10.107.8.70 Server Not reachable\n\nError:NodeName:kafkaworker:IP:10.107.8.14 Server Not reachable\n\nError:NodeName:domainmanagers:IP:10.107.8.156 Server Not reachable\n\nError:NodeName:arangoworker:IP:10.107.8.13 Server Not reachable\n"}400
Exiting Deploy Tool
- Something failed on the worker VMs. This needs further investigation using the subsequent steps.
- Cluster deployment completed and the Deploy Server stopped. This occurs because the user has tried to deploy on an existing deployment. If the Deploy-Tool is run again using the same VM names, then the tool skips VM deployment since they already exist. Since the cluster is also deployed earlier it displays the message seen above.
Workaround: In either case, currently we don’t support redeploying just the cluster. The VMs will have to be redeployed completely, so uninstall all the VMs and then redeploy the VMs and cluster.
If the deployment is unable to complete (using Deploy-Tool or Deployment UI) the follow these steps:
- Check if Deploy Server is running. Login to the control plane node and examine /var/log/deployServer/logfiles. Use sudo when clusteradmin or login as root.
$ cd /var/log/deployServer/logfiles/
	$ ls -al
	total 8
	drwxr-xr-x 2 root root  64 Jan 12 19:17 .
	drwxr-xr-x 3 root root  22 Jan 12 19:17 ..
	-rw-r----- 1 root root 569 Jan 12 19:17 tcoDeploy-20210112-T191759.log
	-rw-r--r-- 1 root root 166 Jan 12 19:17 tcosetup.txt
Check for any errors in the following logs:
tcosetup.txt : contains set up details for the VM
tcoDeploy-*.log: contains access the deployment process logs.
- Check the Deploy Server (deployServer.service)
- Check the status $ sudo systemctl status deployServer.service
- View the service log
$ sudo journalctl –u deployServer.service
OR
$ sudo journalctl –u deployServer.service  -n number_of_lines
If necessary, start the Deploy Server.$ sudo systemctl start deployServer.service
Check other system services invoked by Deploy Server. Depending on the type of VM control-plane-node/worker services are selectively run.
- Check bootstrap-cluster.service (runs on all VMs). On the control-plane-node the bootstrap-cluster.service is responsible for initializing cluster, deploying Kubernetes network. On the worker nodes, the bootstrap-cluster.service responsible for joining the cluster. Upon successful completion the services disables itself.
- Check status $ sudo systemctl status bootstrap-cluster.service
- View the service log
$ sudo journalctl –u bootstrap-cluster.service
OR
$ sudo journalctl –u bootstrap-cluster.service –n number_of_lines
- Check harbor-init.service. This services only runs on the control-plane-node VM and pushes images to the Harbor registry.
- Check status $ sudo systemctl status harbor-init.service
- View the service log
$ sudo journalctl –u harbor-init.service
OR
$ sudo journalctl –u harbor-init.service –n number_of_lines
- Check tco-init.service. This service only runs on control-plane-node VM. The service waits for all nodes to join K8s cluster and then deploys application service pods across all nodes.
- Check status $ sudo systemctl status tco-init.service
- View the service log
$ sudo journalctl –u tco-init.service
OR
$ sudo journalctl –u tco-init.service –n number_of_lines
- Check sa-registry service. This service only runs on control-plane-node VM and generates a server certificate used by the Deployment UI and Harbor registry.
- Check status $ sudo systemctl status [email protected]
- View the service log
$ sudo journalctl –u [email protected]
OR
$ sudo journalctl –u [email protected]  –n number_of_lines
- Check registry-cert service. This service only runs on the the worker VM and trusts the Harbor certificate on the control-plane-node VM, so images can be pulled.
- Check status $ sudo systemctl status registry-cert.service
- View the service log
$ sudo journalctl –u registry-cert.service
OR
$ sudo journalctl –u registry-cert.service –n number_of_lines
- Check generate-worker-cert service. This services only runs on the the worker VM and the service creates a server certificate that can be used by main Nginx UI container replicas.
- Check status $ sudo systemctl status generate-worker-cert.service
- View the service log
$ sudo journalctl –u generate-worker-cert.service
OR
$ sudo journalctl –u generate-worker-cert.service –n number_of_lines
Troubleshooting Operation
Issue 1: Deployment completed (both phases) but services not running correctly
- Get the status of the cluster nodes.
$ kubectl get nodes -o wide -n vmware-smarts
NAME         STATUS   ROLES    AGE     VERSION            INTERNAL-IP      EXTERNAL-IP   OS-IMAGE                 KERNEL-VERSION   CONTAINER-RUNTIME
arangoworker-1         Ready    <none>   7h55m   v1.17.3+vmware.2   10.184.92.6      <none>        VMware Photon OS/Linux   4.19.112-1.ph3   docker://18.9.9
control-plane-node-1   Ready    master   8h      v1.17.3+vmware.2   10.161.176.131   <none>        VMware Photon OS/Linux   4.19.112-1.ph3   docker://18.9.9
domainmanagers-1       Ready    <none>   7h55m   v1.17.3+vmware.2   10.186.30.17     <none>        VMware Photon OS/Linux   4.19.112-1.ph3   docker://18.9.9
domainmanagers-2       Ready    <none>   7h55m   v1.17.3+vmware.2   10.78.231.90     <none>        VMware Photon OS/Linux   4.19.112-1.ph3   docker://18.9.9
elasticworker-1        Ready    <none>   7h55m   v1.17.3+vmware.2   10.182.143.118   <none>        VMware Photon OS/Linux   4.19.112-1.ph3   docker://18.9.9
- Get the status of the pods. All pods should display a "Running" under the STATUS column and a "1/1" under the READY column.
$ kubectl get pods -o wide -n vmware-smarts
NAME                           READY   STATUS    RESTARTS   AGE     IP                NODE                   NOMINATED NODE   READINESS GATES
alerting-rest-685ff79449-zffdj           1/1     Running   0          8h      192.168.244.132   arangoworker-1         <none>           <none>
analytics-service-f565dddf8-tk76b        1/1     Running   0          7h58m   192.168.244.195   domainmanagers-2       <none>           <none>
apiservice-7f6d5879-55kg8                1/1     Running   0          8h      192.168.244.131   arangoworker-1         <none>           <none>
apiservice-7f6d5879-hfd4w                1/1     Running   0          8h      192.168.247.66    kafkaworker-3          <none>           <none>
collector-manager-844c6559cf-2mhgn       1/1     Running   0          8h      192.168.244.193   domainmanagers-2       <none>           <none>
collector-manager-844c6559cf-dxxzk       1/1     Running   0          8h      192.168.246.65    domainmanagers-1       <none>           <none>
elasticsearch-workernode-0               1/1     Running   0          7h59m   192.168.244.67    elasticworker-1        <none>           <none>
elasticsearch-workernode-1               1/1     Running   0          7h59m   192.168.247.130   elasticworker-3        <none>           <none>
- If one or more pods not Running or 1/1, examine the pod. Describe the pod. Issues will be displayed at the bottom.
$ kubectl describe pods <pod_name> -n vmware-smarts
- Examine the pod log. Any application errors should be visible.
N$ kubectl logs <pod_name> -n vmware-smarts
OR
$ kubectl logs <pod_name> -n vmware-smarts -f [Tail the log]
- Drop into the container to examine process state, created files etc.
$ kubectl exec -it elasticsearch-workernode-0 bash -n vmware-smarts
elasticsearch [ /opt/vmware/vsa ]$
- Examine the kubelet service log.
$ sudo systemctl status kubelet.service
$ sudo journalctl –u kubelet.service
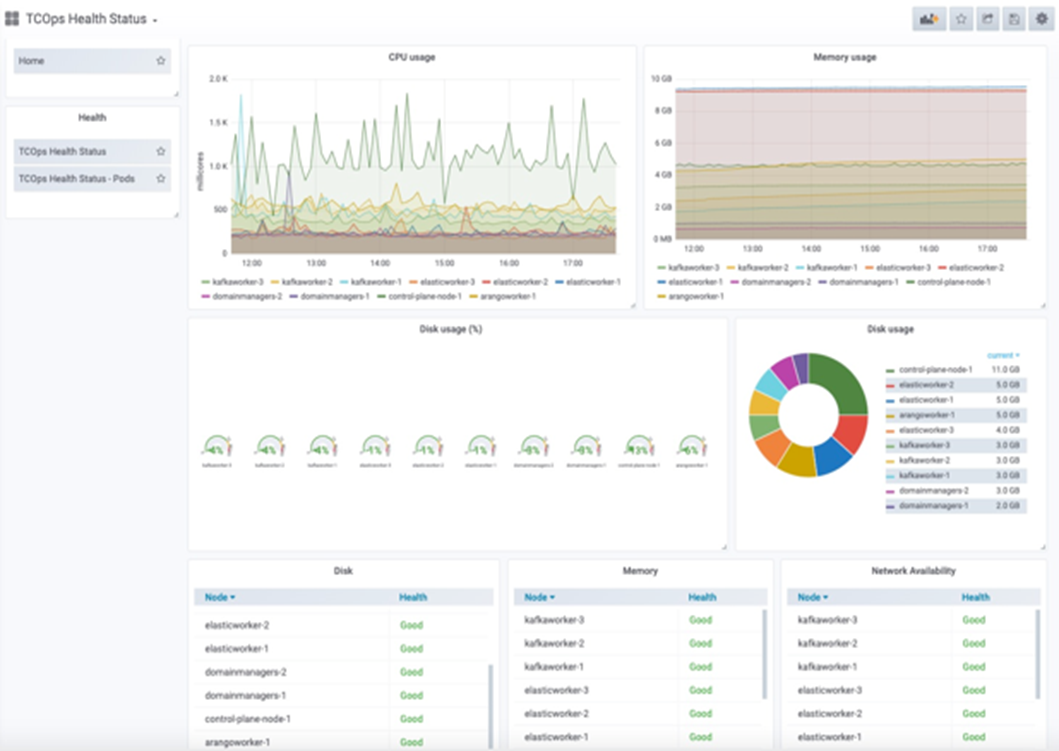
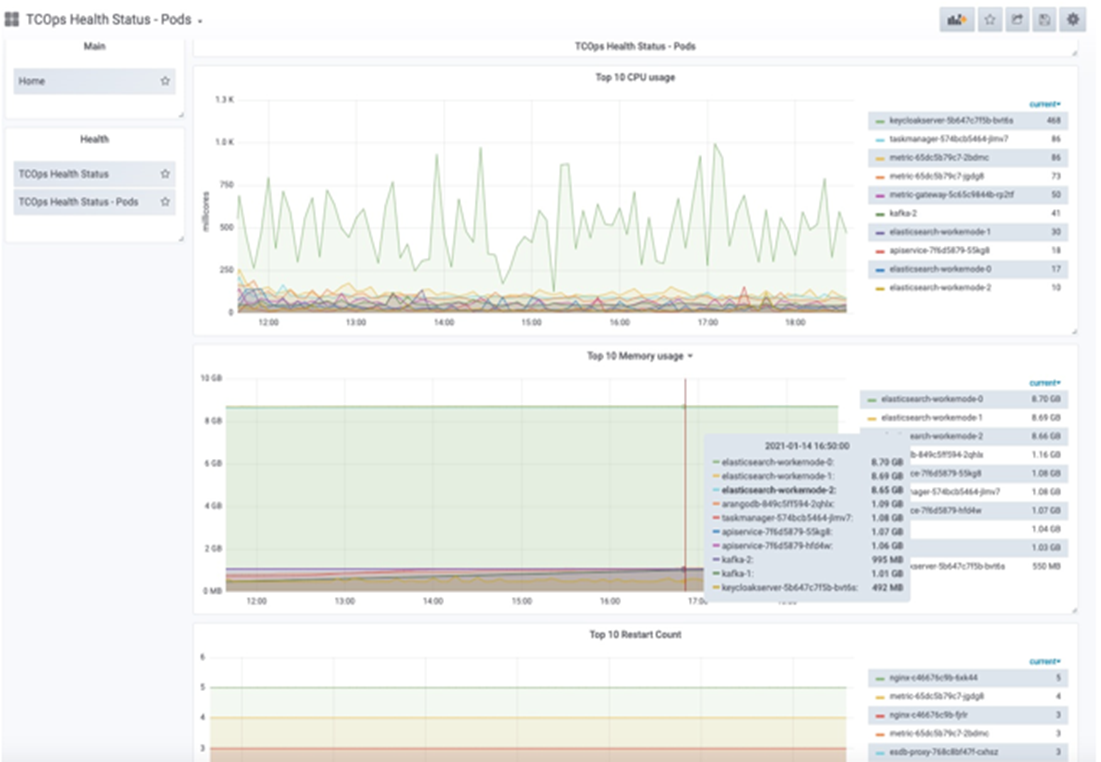
- Check resource usage (trend can be viewed in dashboard).
$ kubectl top nodes
$ kubectl top pods -n vmware-smarts
Support Bundle for Offline Troubleshooting:
Another to gather troubleshooting information is using the Support Bundle as follows:
- Log into https://control-plane-node-IP.
- Select Administration and choose Support Bundle.
- Click START BUNDLE COLLECTION button.
- Download the tar.gz file with all the details discussed earlier viz. outputs of kubectl commands for:
- Node details
- Service details
- Pod details for VMware Telco Cloud Operations applications
- Logs for VMware Telco Cloud Operations
- Pod details for K8s
- Logs for K8s
- Deployment logs viz. Deploy Server logs and system service logs not present. To be added in future release.
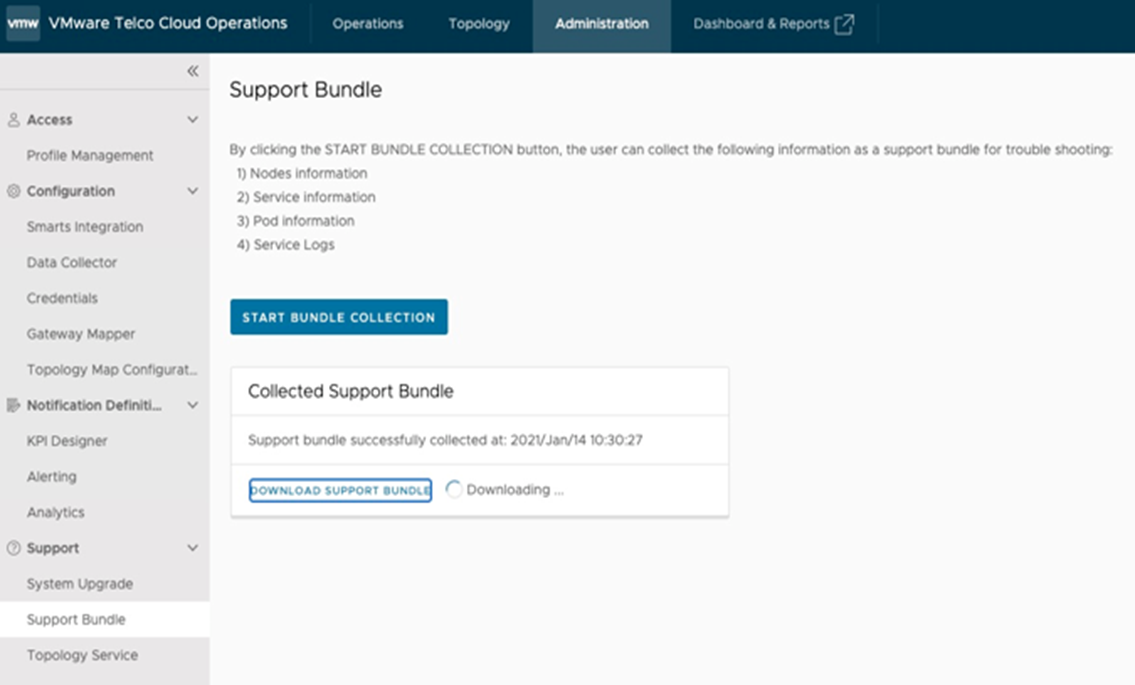
- Node health
- Pod health
- If you cannot SSH into the control plane node VM, then start the VM console from the vCenter and login to the node as the root user.
- During an automated deployment, if one of the worker nodes fails to become “Ready”, follow the steps to redeploy the worker node:
- To remove the unresponsive node, run the following uninstall script:
$ uninstall vm-name
Where vm-name is the name of the unresponsive VM.
- Run the deploy-cluster script again.
- To remove the unresponsive node, run the following uninstall script:
- While logging to VMware Telco Cloud Operations with any non-preconfigured users (other than admin, maint, default, oper), the following error appears:
Unexpected error while handling authentication request to identity provider
The cause of the error is as follows:- LDAP integrated with keycloak is SSL configured , but LDAP certs were not imported in CPN node.
- The user is trying to login with an incorrect user name.
- While logging to VMware Telco Cloud Operations with any non-preconfigured users (other than admin, maint, default, oper), the following error appears:
Failed to process request, cause JSONObject["groups"] is not a JSONArray
The cause of this error is that the user is trying to login, which is not associated to any group.
