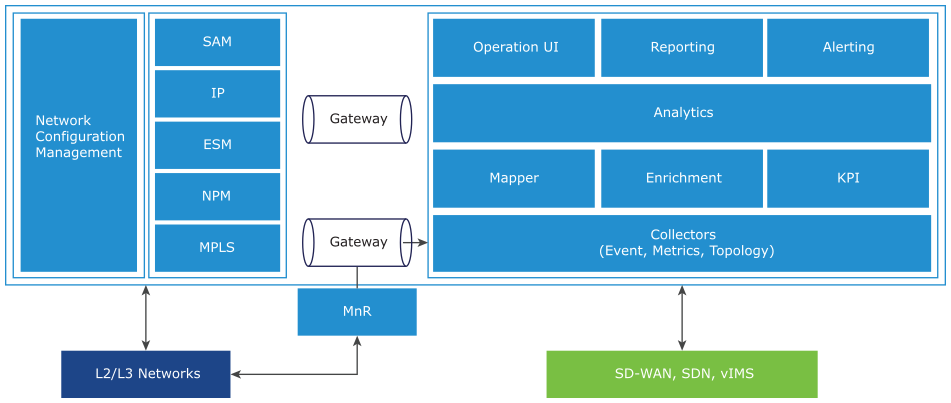
VMware Telco Cloud Operations consists of multiple components and their functions.

| Components | Description |
|---|---|
| Smarts components | Following Smarts components are used in VMware Telco Cloud Operations:
|
| Gateway | VMware Telco Cloud Operations Gateway is a component that acts as an entrypoint to ingest metric data from an external system to VMware Telco Cloud Operations. |
| Operation UI | The Operation UI is a versatile tool for monitoring and reporting performance data, topology data, and fault notifications for all aspects of your infrastructure. The Operation UI has modules that collect, aggregate, and insert data into one or more databases that the portal uses to display reports. |
| Reporting | The reporting allows you to create, modify, and delete the improvised performance metric dashboards and reports for the supported data models. |
| Alerting | Computes KPIs and threshold crossing events on metric streams for the visualization in reports. It then generates alerts from threshold crossing of KPIs and metrics for visualization and notification. |
| Analytics | The Baseline and Anomaly detection analytics solution in VMware Telco Cloud Operations provides a performance monitoring and learning approach for the active operations management. |
| Mapper | The mapper is a utility where, an administrator can map an external model to the internal model. |
| Enrich | Enriches and tags data collected by the Data Collector Service with externally provided reference data. |
| KPI | The capabilities of this component include Key Performance Indicator (KPI) calculation, windowed and non-windowed threshold detection, and creation of data "streams" for processing of metric data collected by collectors. |
| Collectors | Manages the lifecycle of Kafka, SNMP, REST and other collectors, which ingest the data into VMware Telco Cloud Operations through push and pull mechanisms.
|