


Spark Line Graph displays the value and status icon with an inline graph, or “sparkline” plotting the value over the selected time period. This graph is mapped to a standard KPI that is pre-computed on to any single metric. The KPI is created in the KPI engine. If the metric is not present, thenSpark line graph is not displayed.
Procedure
- ♦ Select the check-box under the Topology Map in the Right Window.
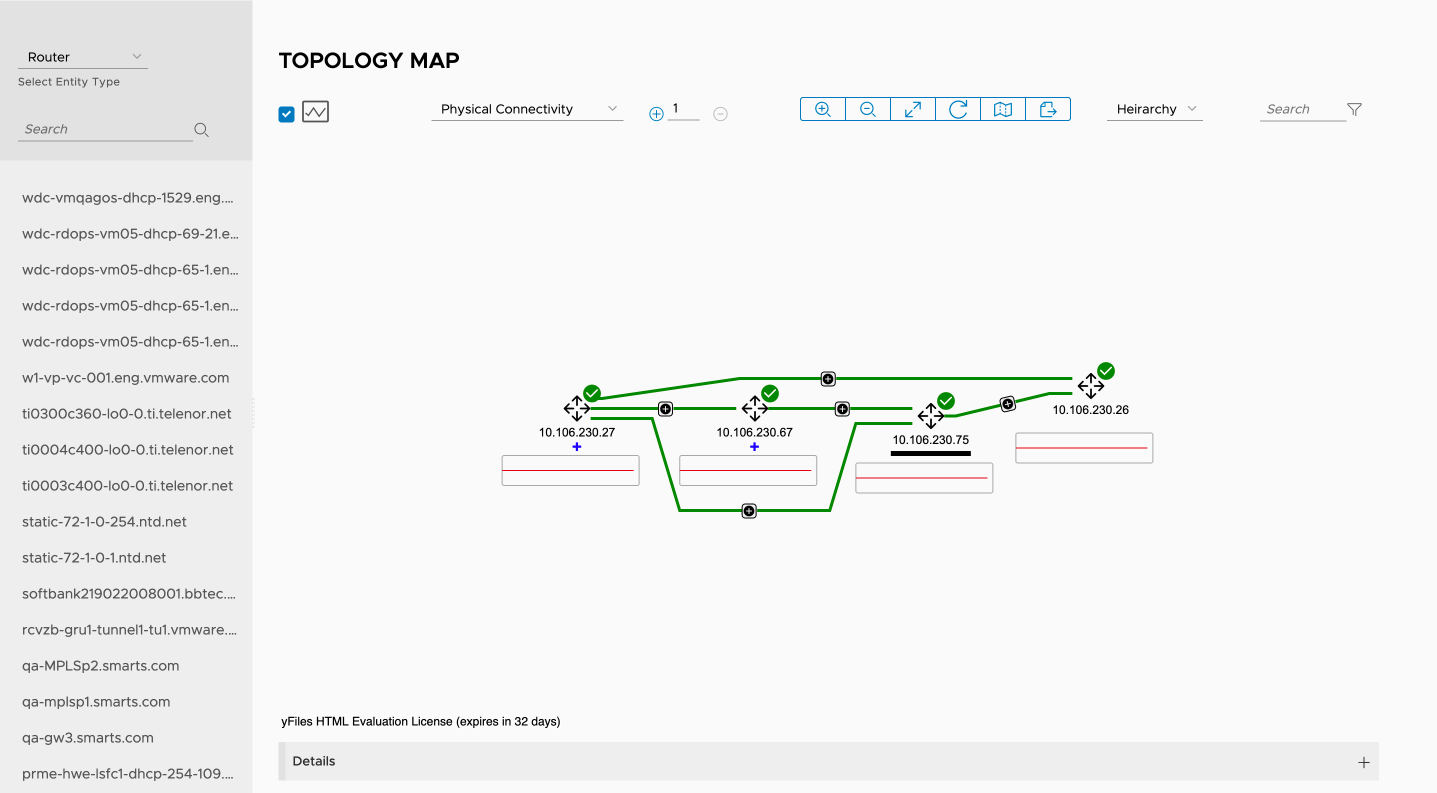
The spark line graph appears with the maps.
