This section describes how to configure a network function in LLS-C1 T-BC mode using the PTP timing pod.
VMware PTP Timing Pod is published in the form of Helm Charts. You need to modify network function CSAR and add the Timing Pod Helm as a prerequisite to the DU/application Helm Chart.
Prerequisites
Create and Apply a Host Profile to a Cell Site Group.
Note:While creating the host profile, add a dedicated PCI Group for each vmnic you want to use for PTP (Server and Client).
Procedure
- Navigate to Catalog > Network Function in the Telco Cloud Automation UI.
- Select the Network Function you want to set up in the T-BC mode and click EDIT.
- Click the Topology tab.
- Select and drag 'Helm' from Components to the workspace.
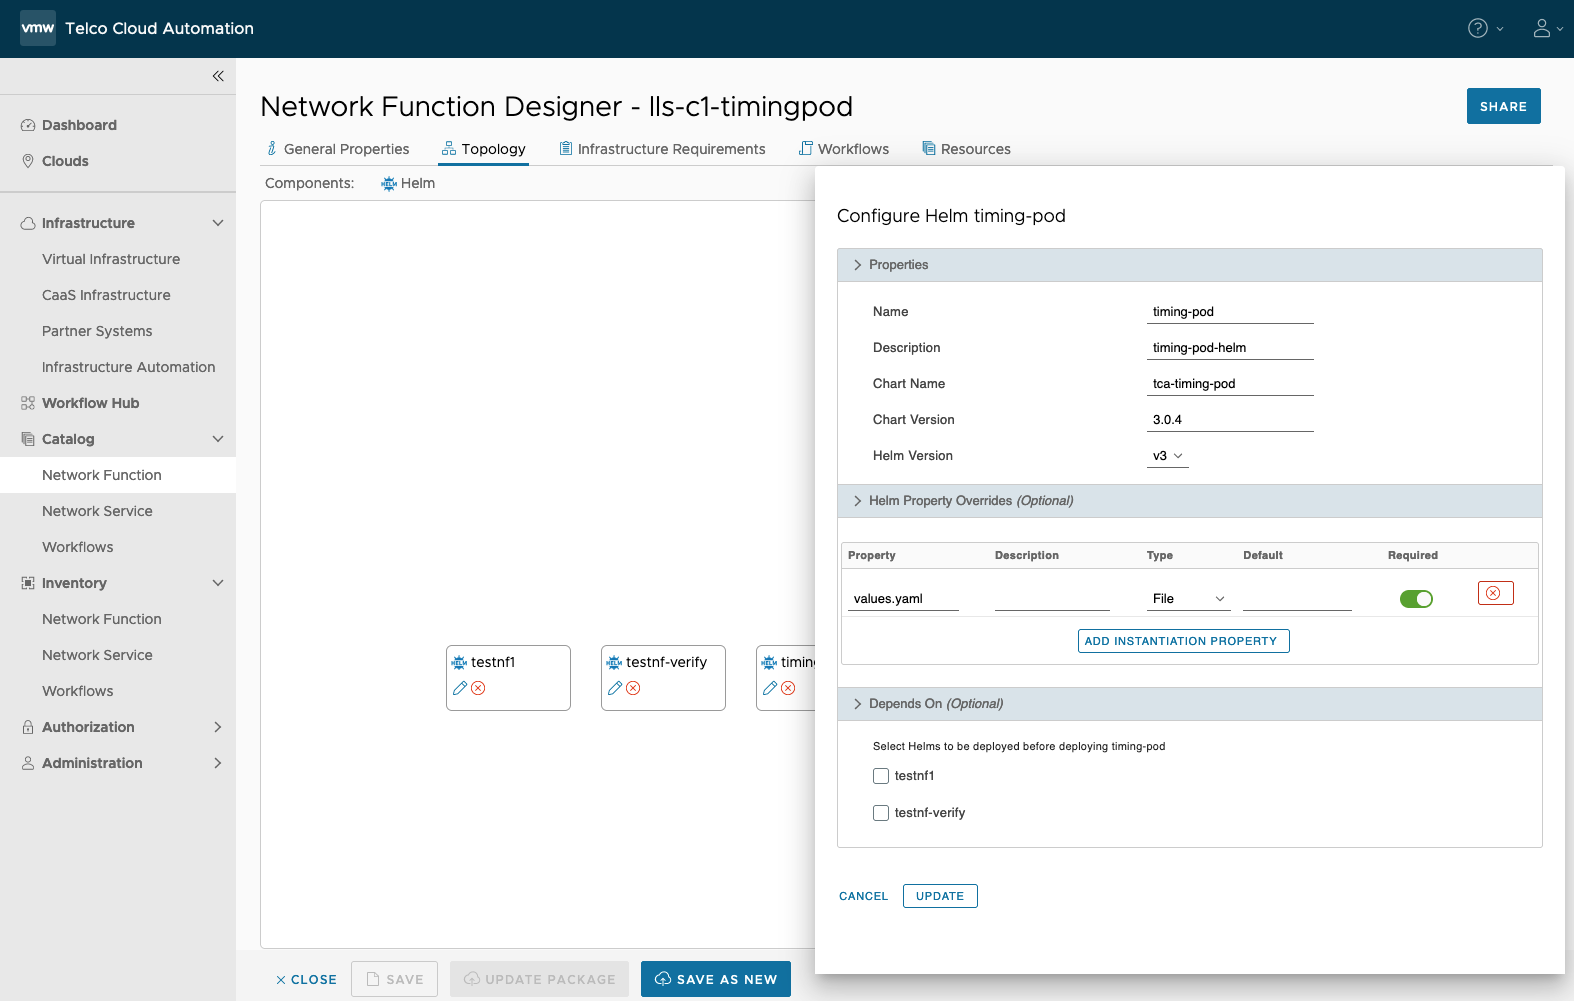
- In the Configure Help timing-pod dialog, enter all the required details about the PTP Timing Pod:
- Properties:
Name: Name of the helm chart
Description: Description of the helm chart
Chart Name: Chart name of the VMware PTP Timing Pod
Chart Version: Chart version of the VMware PTP Timing Pod.
Helm Version: Helm version.

- Helm Property Override: Add an entry for values.yaml file.
Property: values.yaml
Type: File
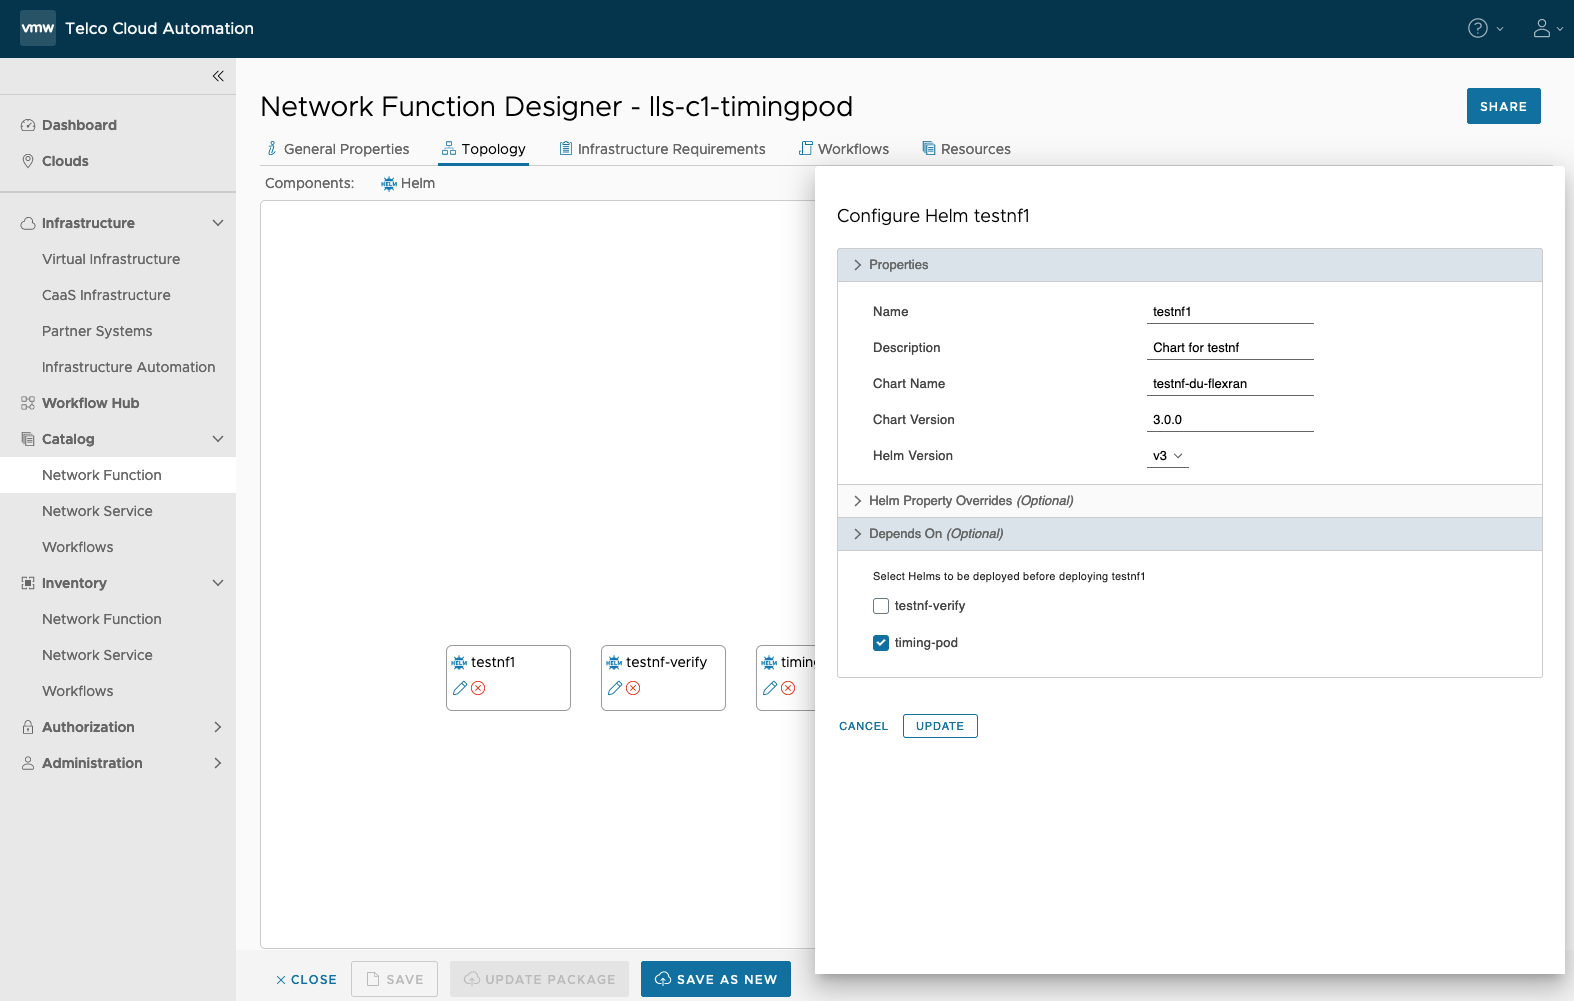
- Depends On (Optional): Select the timing pod helm chart and add it as a dependency to your DU Helm chart.

- Click UPDATE to save the changes.
- Properties:
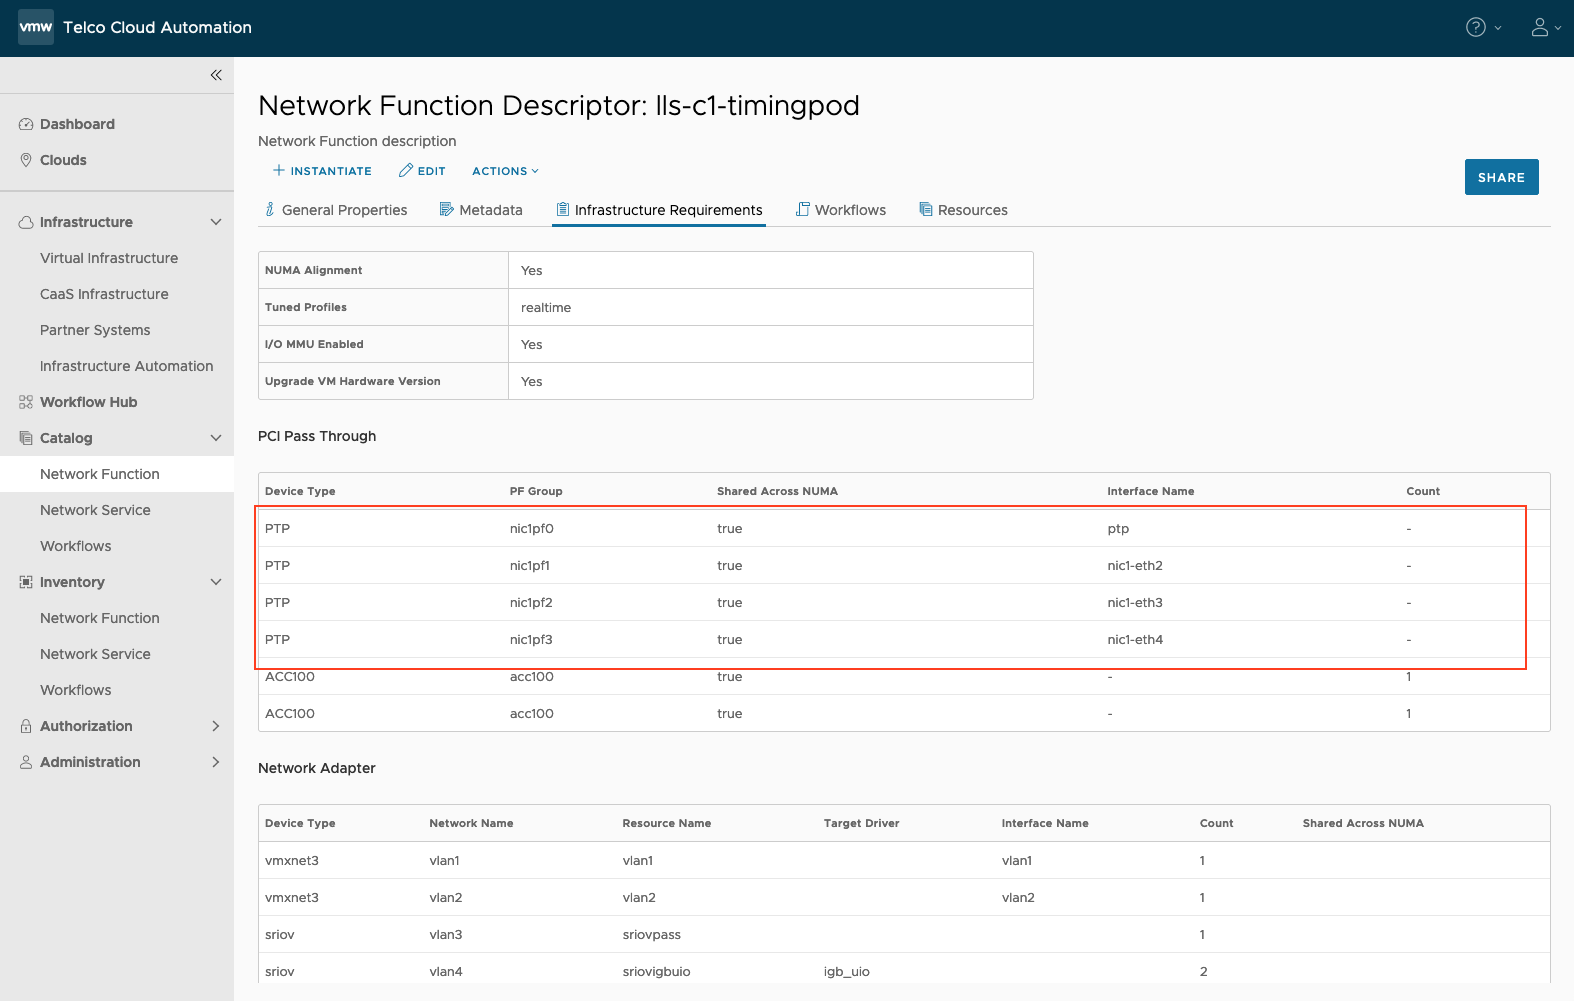
- Click the Infrastructure Requirements tab and add the PTP devices.
- Add a PTP device for each port that is connected to RU and PTP GM.

- Save the Network Function.
- Add a PTP device for each port that is connected to RU and PTP GM.
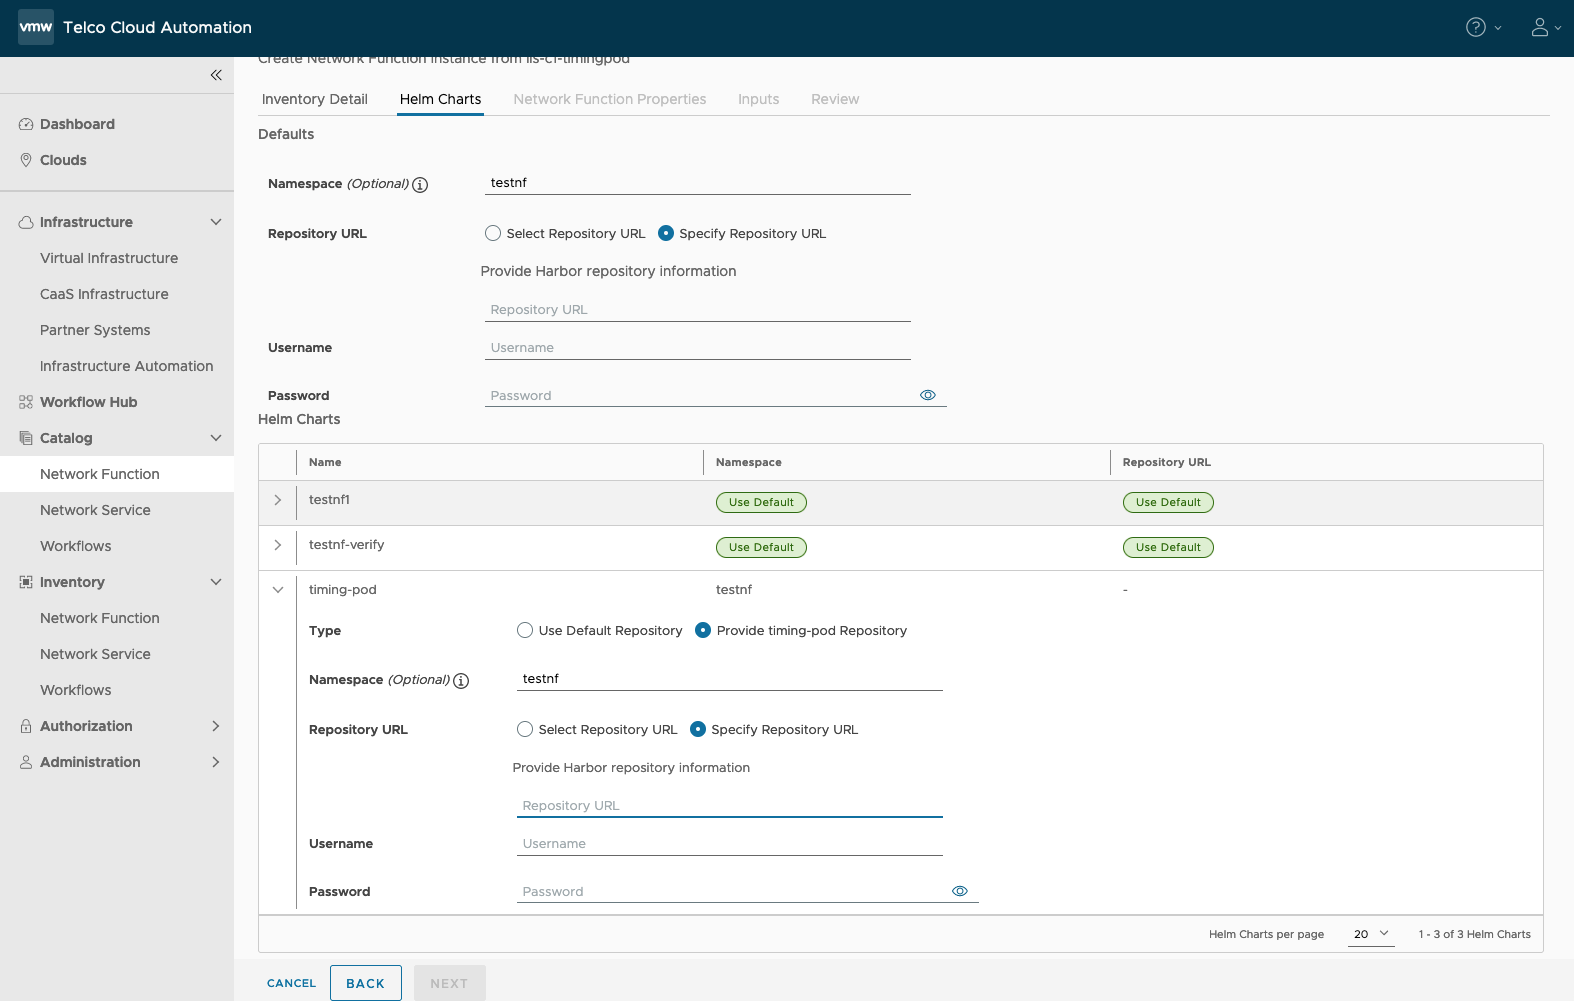
- Instantiate Network function CSAR.

Namespace for tca-timing-pod helm: For tca-timing-pod helm charts, do not use 'tca-system' namespace. Use the same namespace where the DU application is installed.
In the above screenshot, 'testnf' namespace is used for both the DU application and tca-timing-pod.
values.yaml for tca-timing-pod:
Use 'tca-system' as namespace in the tca-timing-pod values.yaml
Use '2' as the ProfileId for Telco Boundary Clock Mode
Example: values.yaml for tca-timing-pod for T-BC Mode
ProfileId: "2" # 1: T-TSC, 2: T-BC, 3: T-GM, 4: Dual WPC

namespace: tca-system

nodeSelector: {
      key: value
}

Containers:
  TimingController:
    name: timing-controller
    image: sebu-tcp-ran-docker-local.artifactory.eng.vmware.com/tca-timing-controller:3.0.7
    resources:
      requests:
        memory: "256Mi"
        cpu: "1"
      limits:
        memory: "256Mi"
        cpu: "1"
  MessageQueue:
    name: rabbitmq
    image: vmwaresaas.jfrog.io/registry/rabbitmq:3.12-management
    resources:
      requests:
        memory: "512Mi"
        cpu: "500m"
      limits:
        memory: "512Mi"
        cpu: "500m"
  Monitor:
    name: monitor
    image: sebu-tcp-ran-docker-local.artifactory.eng.vmware.com/ptp-ocloud-notifications-monitor:3.0.7
    resources:
      requests:
        memory: "256Mi"
        cpu: "500m"
      limits:
        memory: "256Mi"
        cpu: "500m"
    holdoverPeriod: 120
    pollFrequency: 1
    ptpSimulated: False

# ptp4l config for NIC running in T-BC mode
Ptp4lNic1GmConf: |
  [global]
  #
  # Default Data Set
  #
  twoStepFlag       1
  clientOnly        0
  socket_priority       0
  priority1     128
  priority2     128
  domainNumber      24
  utc_offset        37
  clockClass        248
  clockAccuracy     0x21
  offsetScaledLogVariance   0xFFFF
  free_running      0
  freq_est_interval 1
  dscp_event        0
  dscp_general      0
  dataset_comparison    G.8275.x
  G.8275.defaultDS.localPriority    128
  maxStepsRemoved       255
  #
  # Port Data Set
  #
  logAnnounceInterval   -3
  logSyncInterval       -4
  operLogSyncInterval   0
  logMinDelayReqInterval    -4
  logMinPdelayReqInterval   0
  operLogPdelayReqInterval 0
  announceReceiptTimeout    3
  syncReceiptTimeout    0
  delayAsymmetry        0
  fault_reset_interval  4
  neighborPropDelayThresh   20000000
  serverOnly        0
  G.8275.portDS.localPriority   128
  asCapable               auto
  BMCA                    ptp
  inhibit_announce        0
  inhibit_delay_req       0
  ignore_source_id        0
  #
  # Run time options
  #
  assume_two_step       0
  logging_level     6
  path_trace_enabled    0
  follow_up_info        0
  hybrid_e2e        0
  inhibit_multicast_service 0
  net_sync_monitor  0
  tc_spanning_tree  0
  tx_timestamp_timeout  300
  unicast_listen        0
  unicast_master_table  0
  unicast_req_duration  3600
  use_syslog        1
  verbose           0
  summary_interval  0
  kernel_leap       1
  check_fup_sync        0
  #
  # Servo Options
  #
  pi_proportional_const 0.0
  pi_integral_const 0.0
  pi_proportional_scale 0.0
  pi_proportional_exponent  -0.3
  pi_proportional_norm_max  0.7
  pi_integral_scale 0.0
  pi_integral_exponent  0.4
  pi_integral_norm_max  0.3
  step_threshold        0.0
  first_step_threshold  0.00002
  max_frequency     900000000
  clock_servo       pi
  sanity_freq_limit 200000000
  ntpshm_segment        0
  msg_interval_request  0
  servo_num_offset_values 10
  servo_offset_threshold  0
  write_phase_mode  0
  #
  # Transport options
  #
  transportSpecific 0x0
  ptp_dst_mac       01:1B:19:00:00:00
  p2p_dst_mac       01:80:C2:00:00:0E
  udp_ttl           1
  udp6_scope        0x0E
  uds_address       /var/run/ptp4l_nic1
  uds_ro_address    /var/run/ptp4lro_nic1
  #
  # Default interface options
  #
  clock_type        BC
  network_transport L2
  delay_mechanism       E2E
  time_stamping     hardware
  tsproc_mode       filter
  delay_filter      moving_median
  delay_filter_length   10
  egressLatency     0
  ingressLatency        0
  boundary_clock_jbod   1
  #
  # Clock description
  #
  productDescription    ;;
  revisionData      ;;
  manufacturerIdentity  00:00:00
  userDescription       ;
  timeSource        0x20

  # Name of the interface which is getting
  # PTP packets from the network.
  [nic1-eth3]
  serverOnly 0
  # interface's connected to RUs
  [ptp]
  serverOnly 1
  [nic1-eth2]
  serverOnly 1

Phc2sysOpts: |
  -s ptp -c CLOCK_REALTIME -O -37 -m -R 16 -u 16