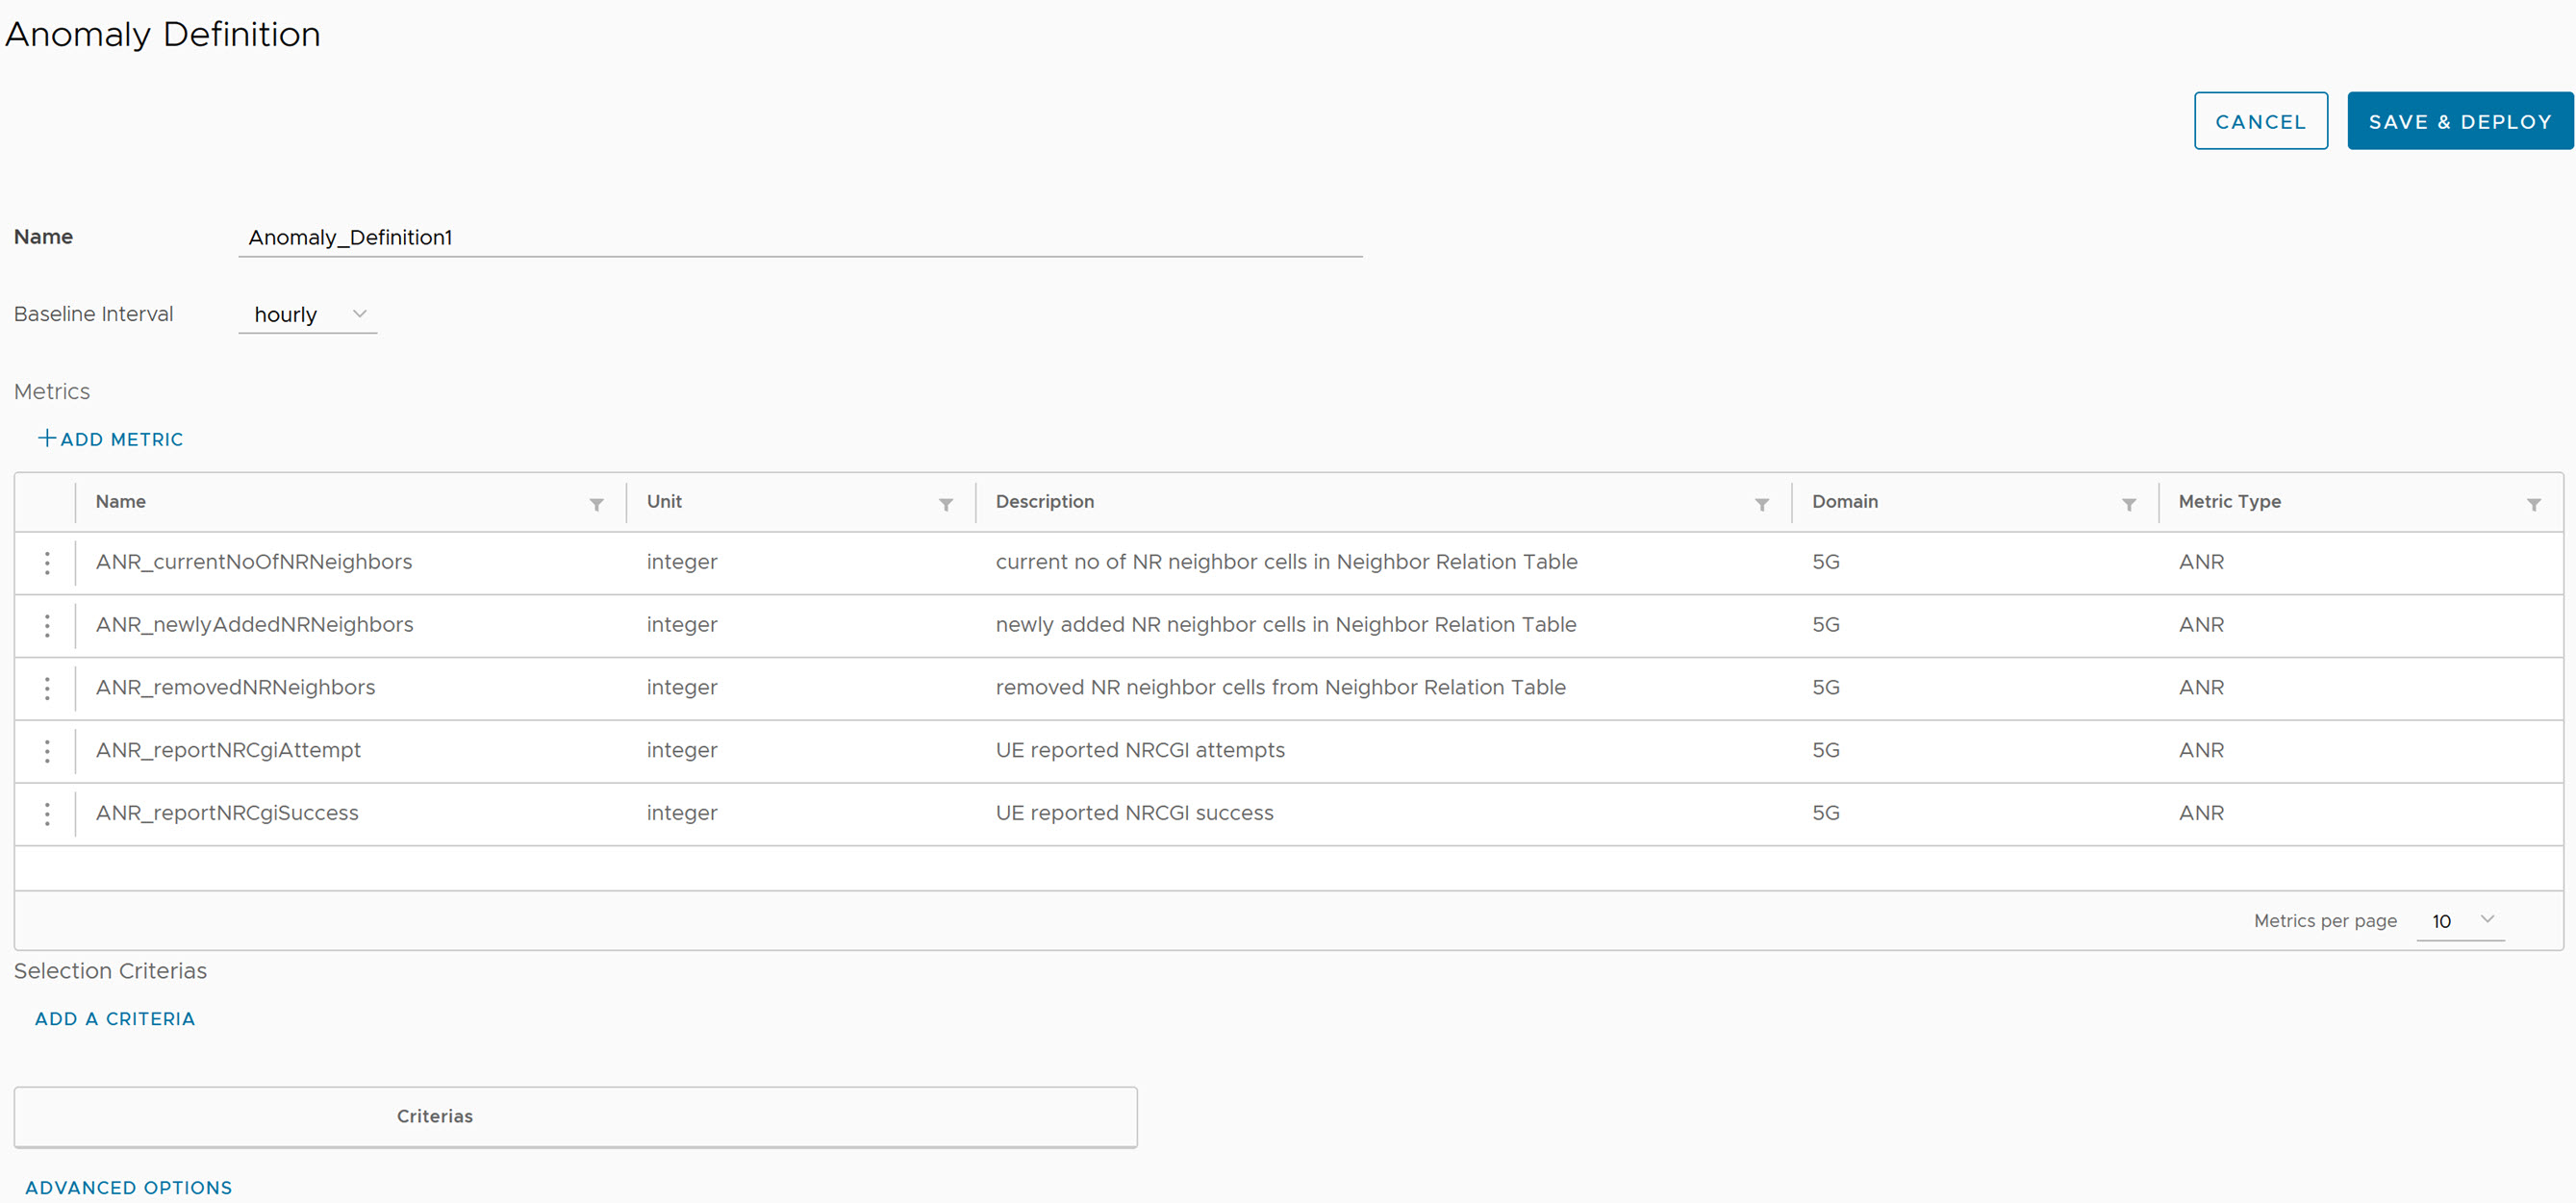
In this topic, you can find information about creating an Analytics Definition from Operations UI.
Prerequisites
Procedure
- Log in to Operations UI, see the Start Operations UI in VMware Telco Cloud Service Assurance User Guide for more information.
- Navigate to Administration > Notification Definition > Analytics.
- To go to Analytics Definition, click Create.
Analytics Definition page is displayed.
- Provide the following details:
Parameter Description Name Provide the definition name. Baseline Interval Provide the duration type as hourly. Default is hourly. Note: If you select Baseline Interval as hourly, then you must wait for approximately one hour to see the data. - To add metrics, click Add Metric.
- From the selection drop-down menu, select domain and subdomain.
- Click Next.
- From the metrics selection window, select one or more relevant metrics.
- Click Next.
- Confirm the selection of metrics for use in the alarm definition. Once the metric is selected, you can see the corresponding metric details in a table.
To delete a metric from the table, click the vertical ellipsis (⋮) against the metrics name and click Delete.
- Click Finish.
- To add selection criteria, click Add a Criteria.
- Provide the following details:
Parameter Description Criteria Name Provide the criteria name. Device Type Provide the device type as Switch, Router. It must match with the topology device type name.
Note: It accepts one or more comma-separated multiple values, First letter must be in the capital: S, R.Device Name(s) Provide the name of the device (appears same as in the topology), or regular expression which matches to a single or multiple device names. Note: It accepts one or more comma-separated regular expressions.For example: The dot* (.*) can be used for all devices name.
EntityType Provide the device entity type, such as Port, Interface. It must appears same as in the Smarts topology. Note: It accepts one or more comma-separated multiple values, First letter must be in the capital: P, I.EntityName(s) Provide the complete name (appears same as in the topology), or regular expression which matches to a single or multiple device names. Note: It accepts one or more comma-separated regular expressions.For example: The dot* (.*) can be used for all the entities name.
- Click Add.
Anomaly Definition page appears.
- Click Advanced Options.
- Provide the following details:
Parameter Description Consumption Rate Provide the number of Kafka consumers which are used by the anomaly definition while reading metric data when the definition is deployed. Processing Rate Provide the number of Flink parallelism used by the anomaly definition while processing the metric data. Validation Factor Defines the lower and upper bound for mean and standard deviation in the following way: - Upper bound = mean + n * standard deviation.
- Lower bound = mean – n * standard deviation
- Where 1>= n <=3
EnableLower class Anomaly Acceptable options are: - True
- False
Note:If true, Analytics Service generates the anomaly for the metric value which is less than the lower class boundary(LCB) else ignored.
- Click OK.
Anomaly Definition page appears.
- Click Save & Deploy.
 Note: If you want to edit existing definitions, then you need to wait until duration completes (for example, approx. one hour for hourly definition) for edited parameters to take effect.