Graph widget are reports display the selected metric or calculated values on one or more graphs. Standard graph reports plot variables along the x (time) and y (value) axes. Depending on the graph choice, metrics maybe from the current node, or child nodes.
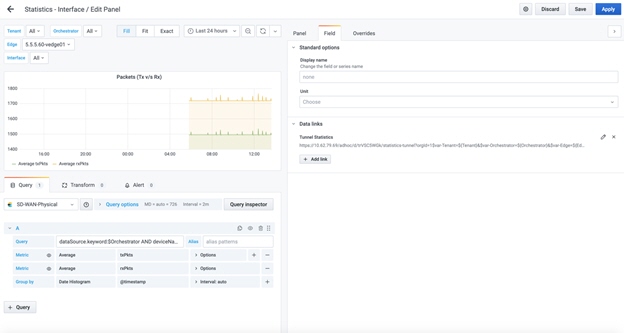
Drill down links can be added to the Graph widget for charts by providing the URL of the reports to be launched in the Data Link as shown in the following example:


Example URL - d/trVSC5WGk/statistics-tunnel?orgId=1$var-Tenant=${Tenant}&$var-Orchestrator=${Orchestrator}&$var-Edge=${Edge}.
Report to be launched - statistics-tunnel
- ${__Tenant} - value of the Tenant template variable selected for this specific dashboard.
- ${__ Edge } - value of the Edge template variable selected for this specific dashboard.
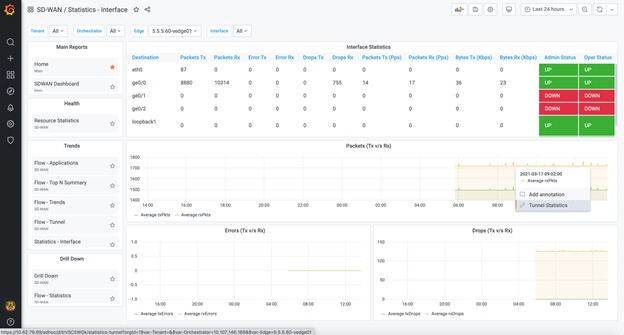
After adding the URL, the drill down can be launched by clicking on the chart and selecting the name of the Data link as shown below:

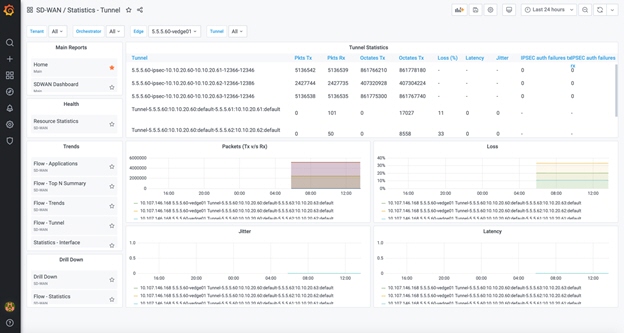
Click Tunnel Statistics report, to launch and view the chart and template variables.
