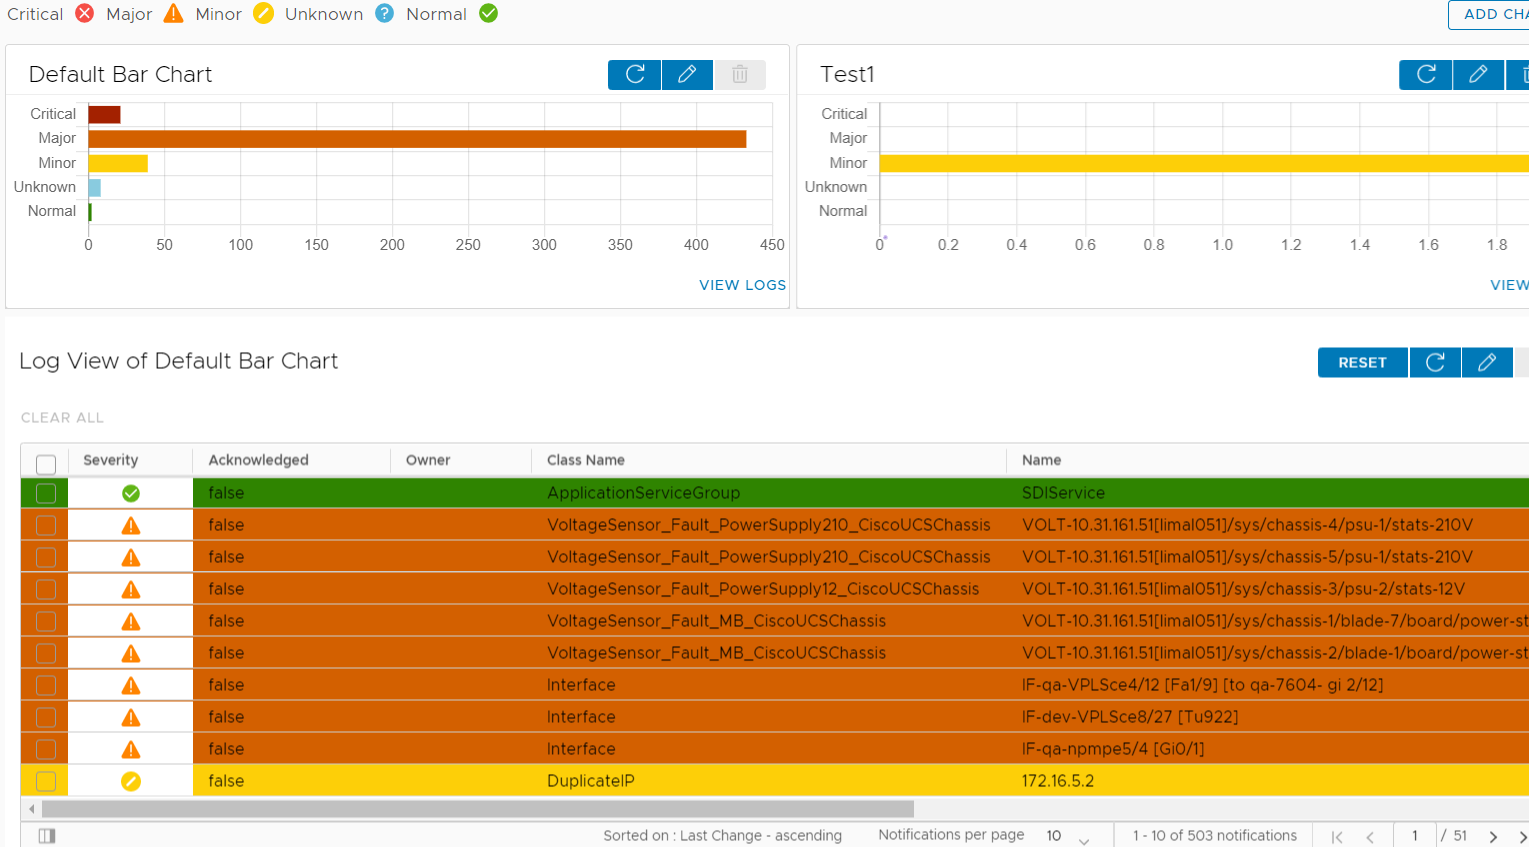
The Notifications Summary View provides a graphical display of the information as a form of Bar Chart. Also, Log View of Default Bar Chart is displayed in the Summary View console. By default, a summary is updated continuously.
Also, you can create multiple summary views. The multiple summary views are filtered based on location, region, technology, and class name.
The Default Bar Chart represents the number of notifications categorized by the severity level.
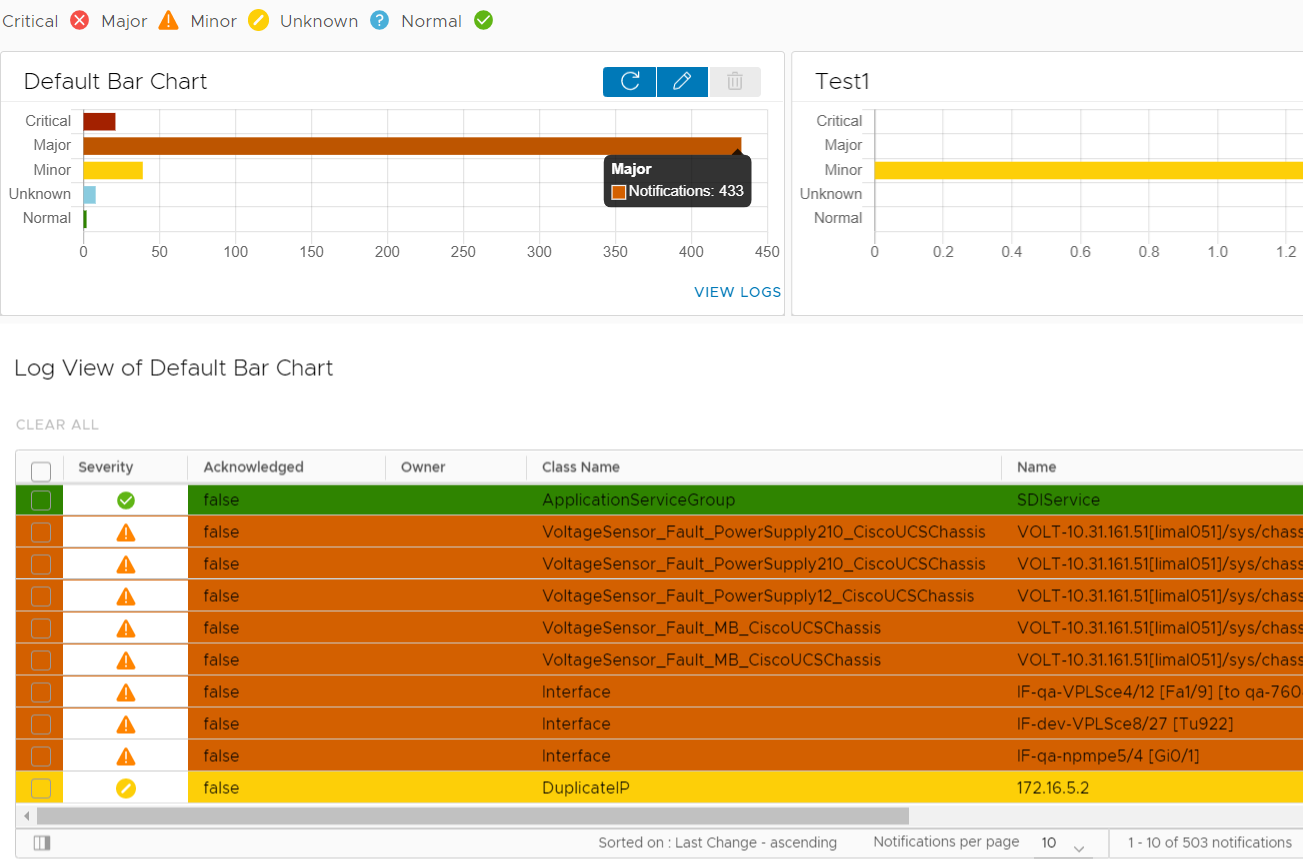
The
Log View of Default Bar Chart provide following information:
- Notification Name (Event Name)
- State (Active or Inactive)
- Acknowledgment status (True or False)
- Severity
- Source
- Owner
- Impacted Class Name
- Impacted Element Name (or IP address)
- Impacted Instance Name (or IP address)
- Business Impact
- Occurrence Counts.
You can customize the columns of the log view, to see the notifications of your choice, see the Customize Notification View for more information.