


In this section, you can find information on viewing 5G dashboard reports.
Prerequisites
Procedure
- To view the 5G dashboard reports, click View and click 5G Dashboard.

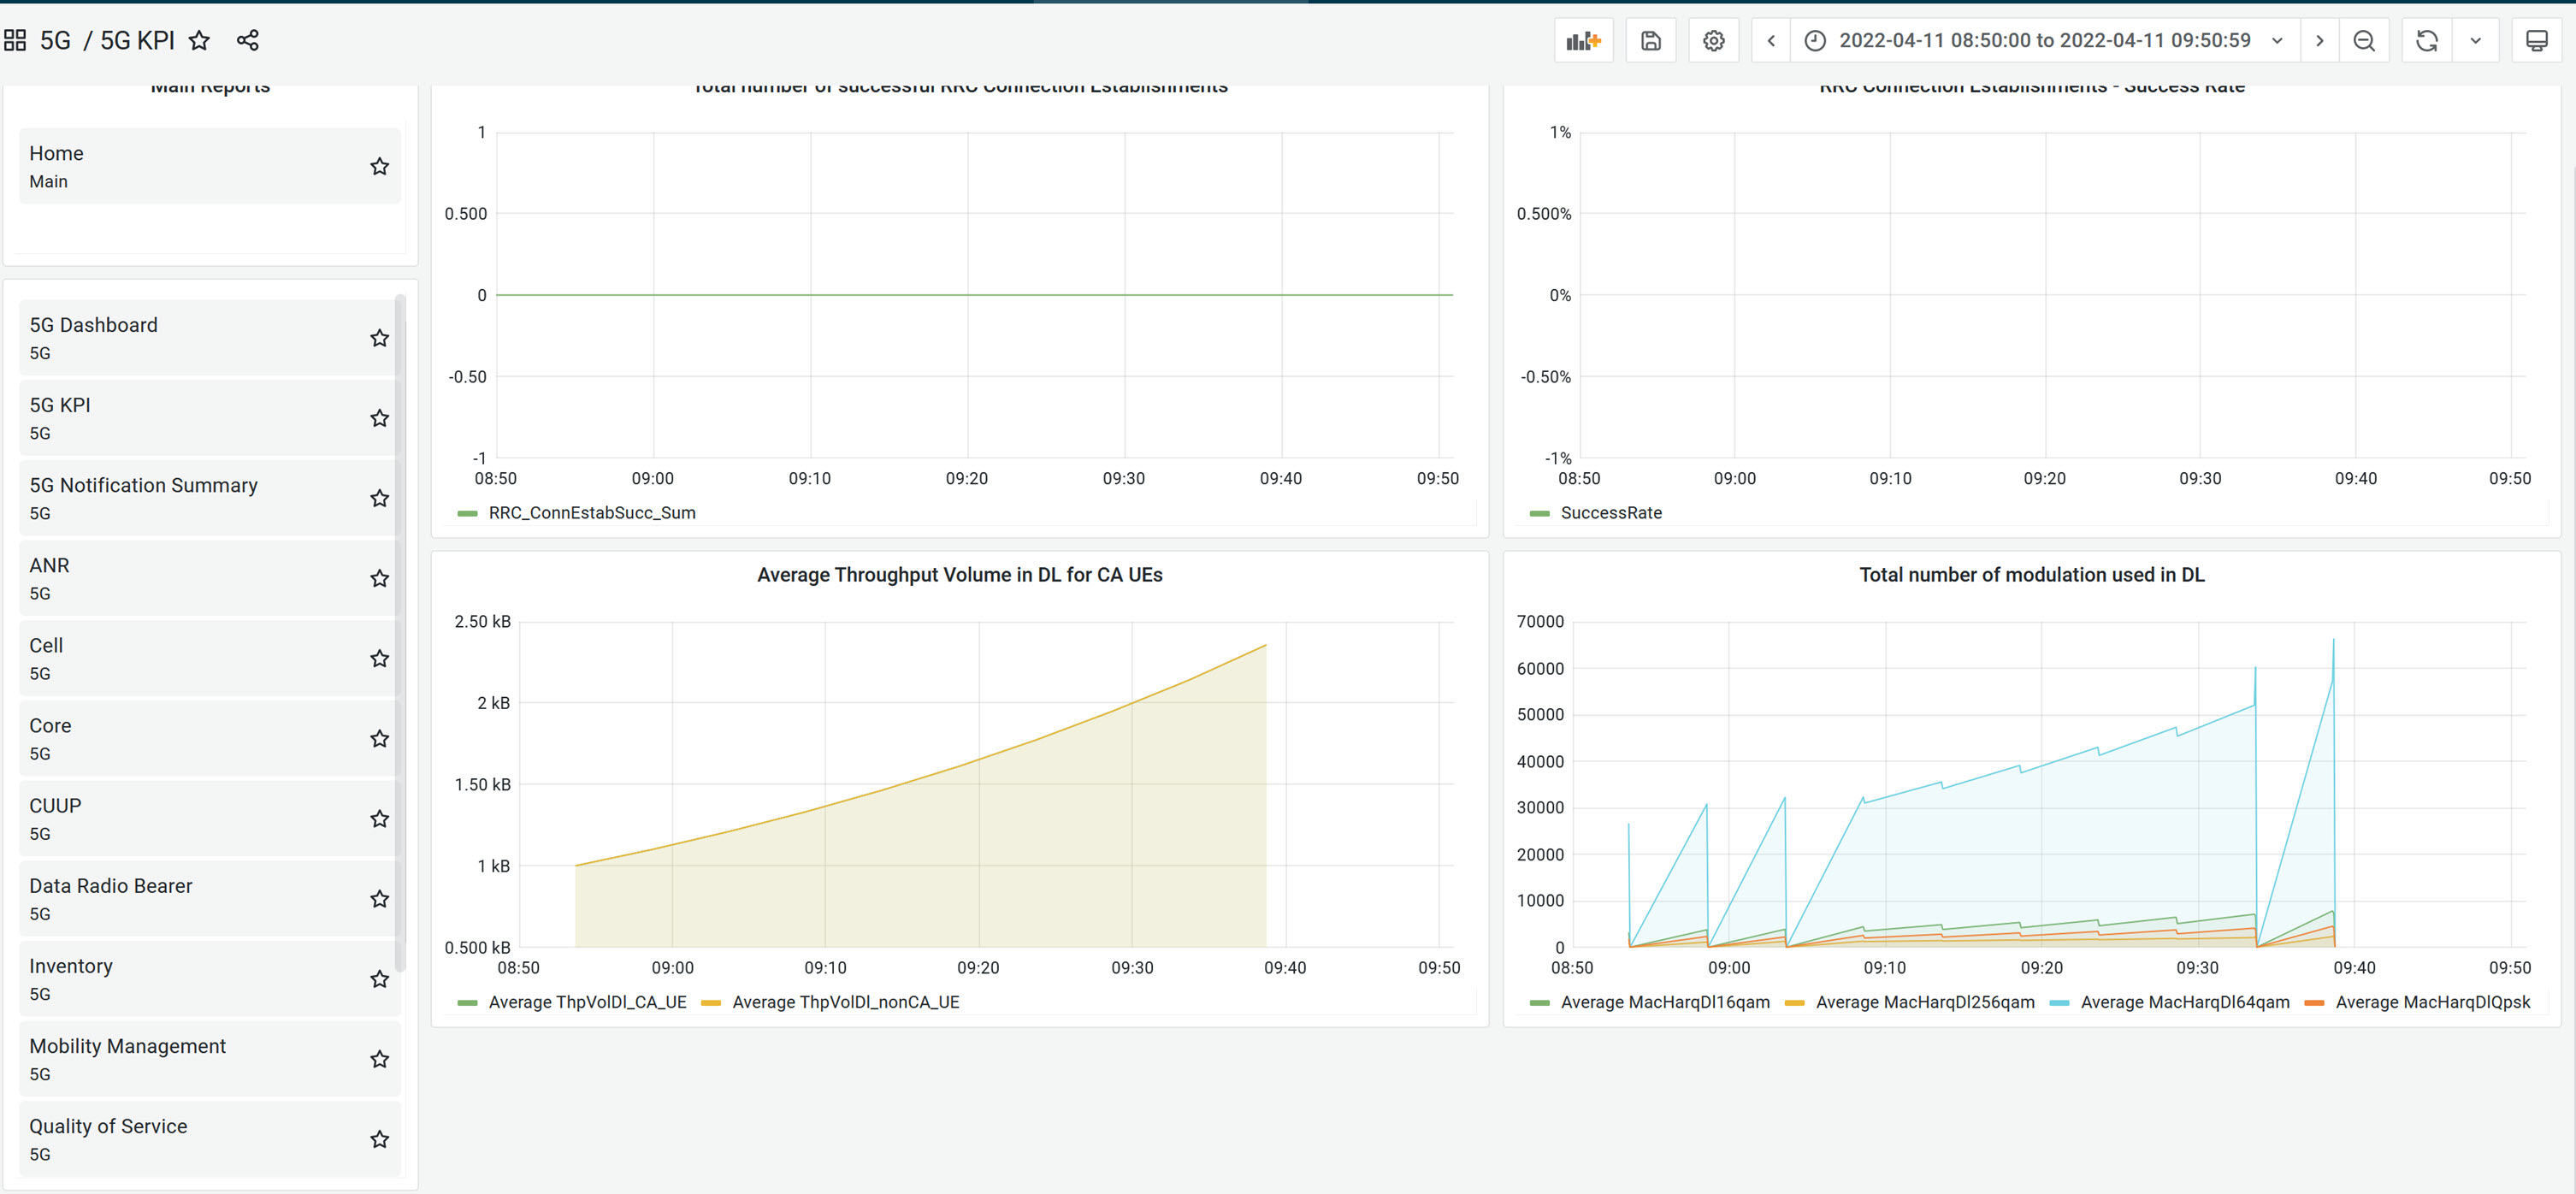
- To view the 5G KPI report, click 5G KPI.
- To view the 5G Notification Summary, click 5G Notification Summary.

- To view 5G ANR report, click ANR.

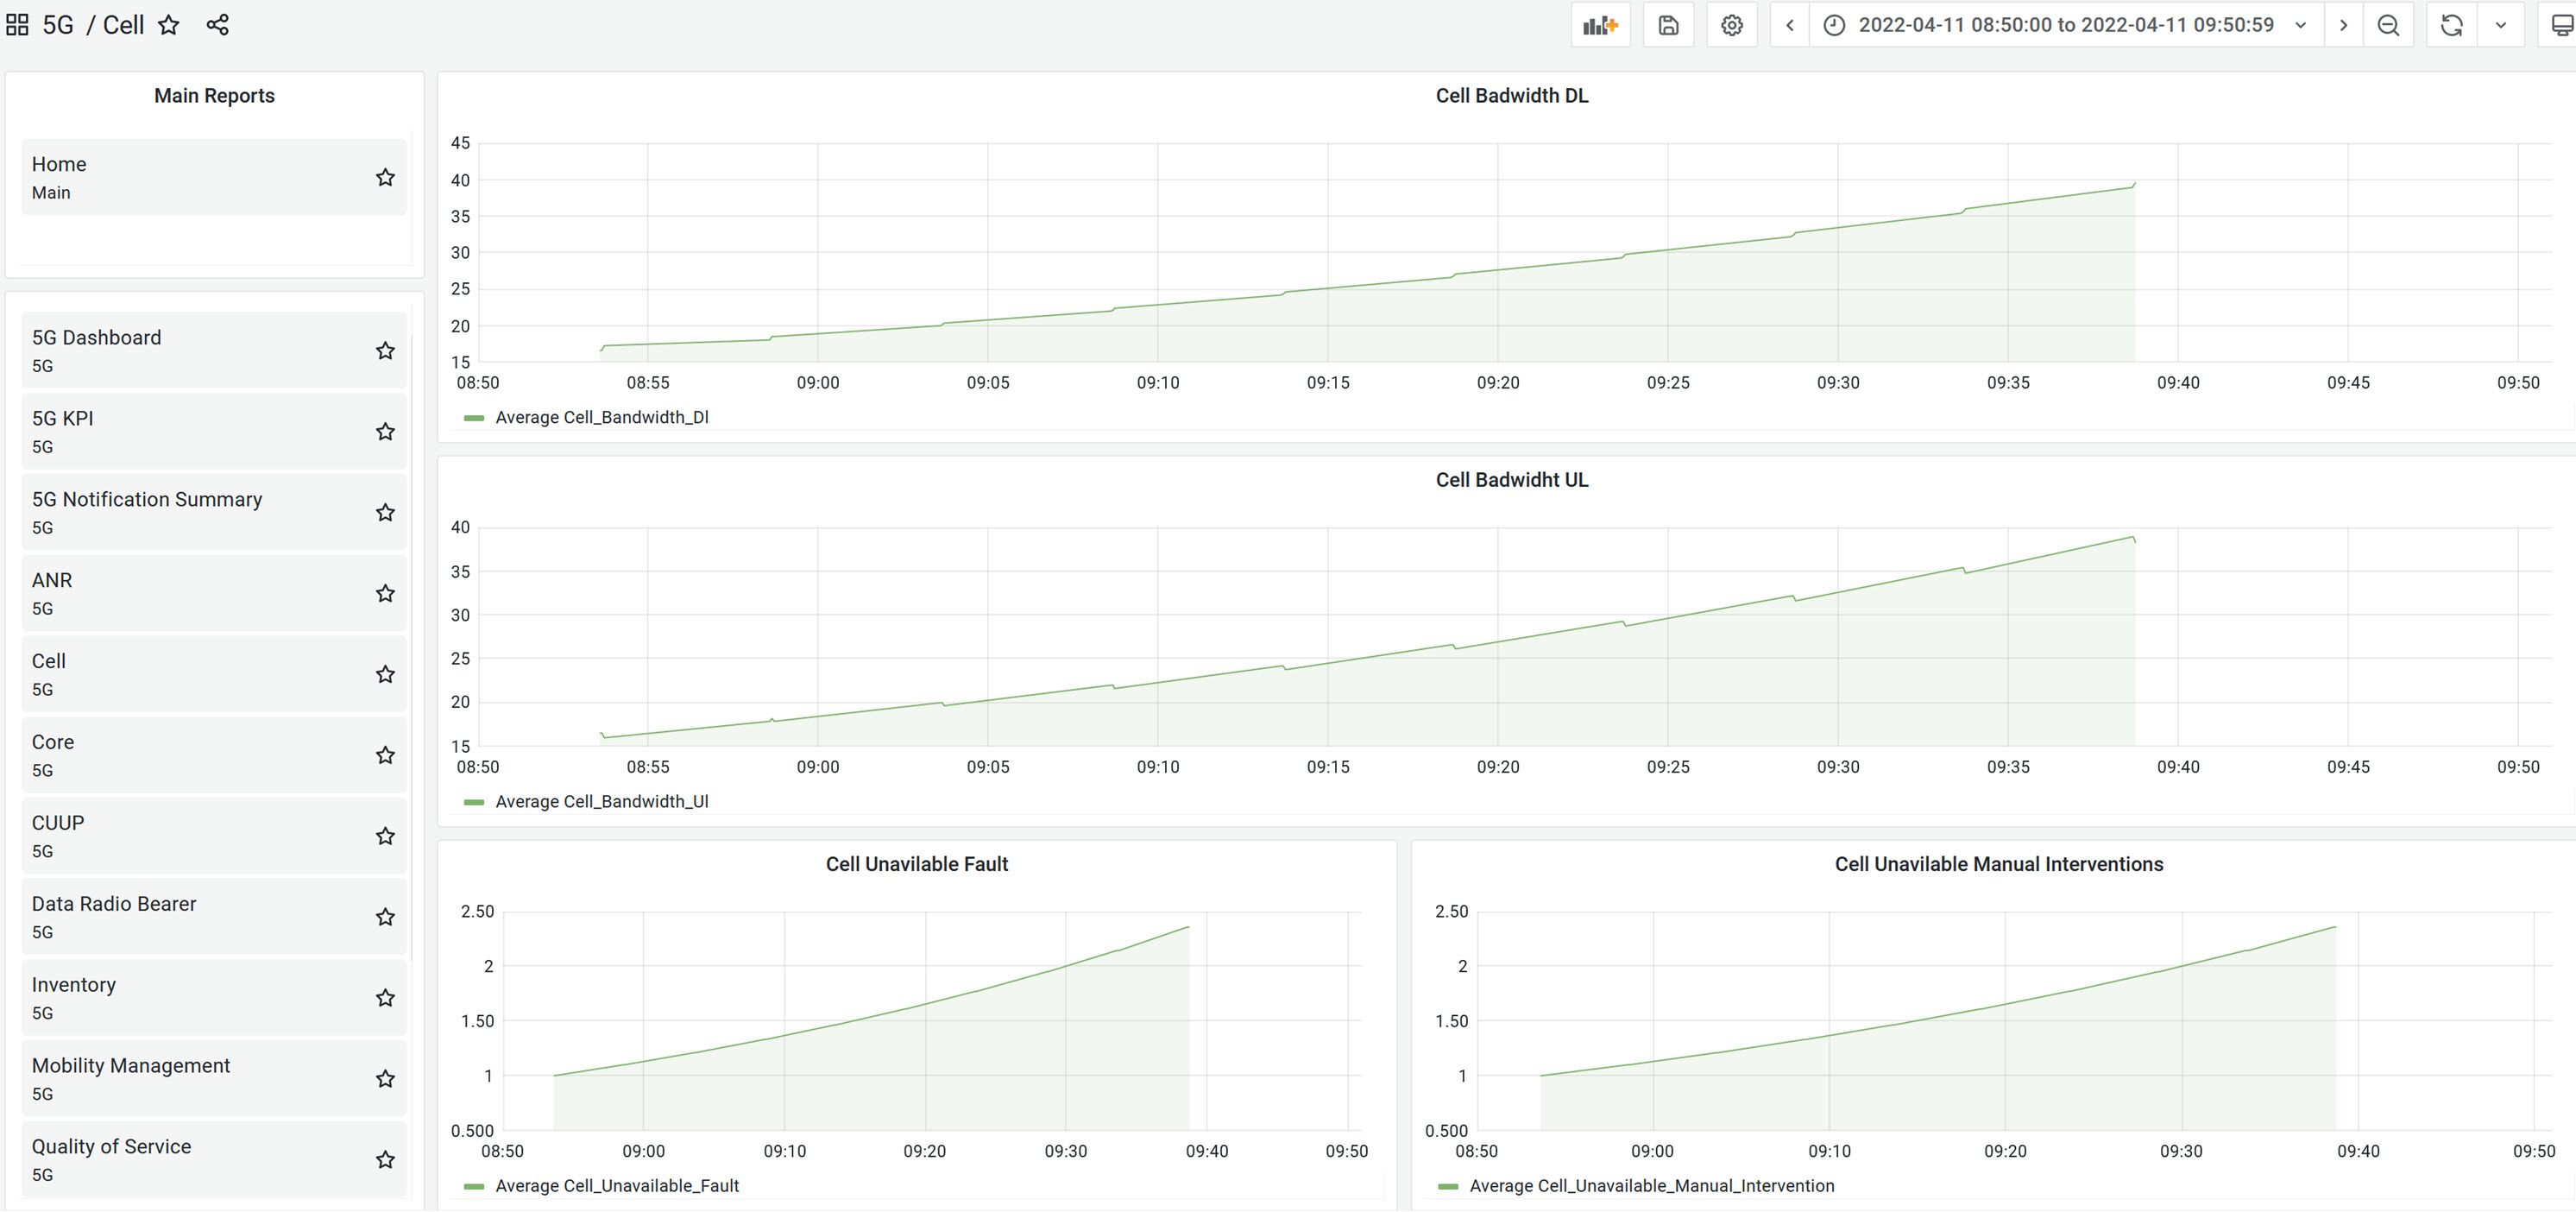
- To view 5G Cell report, click Cell.
- To view 5G CUUP report, click CUUP.

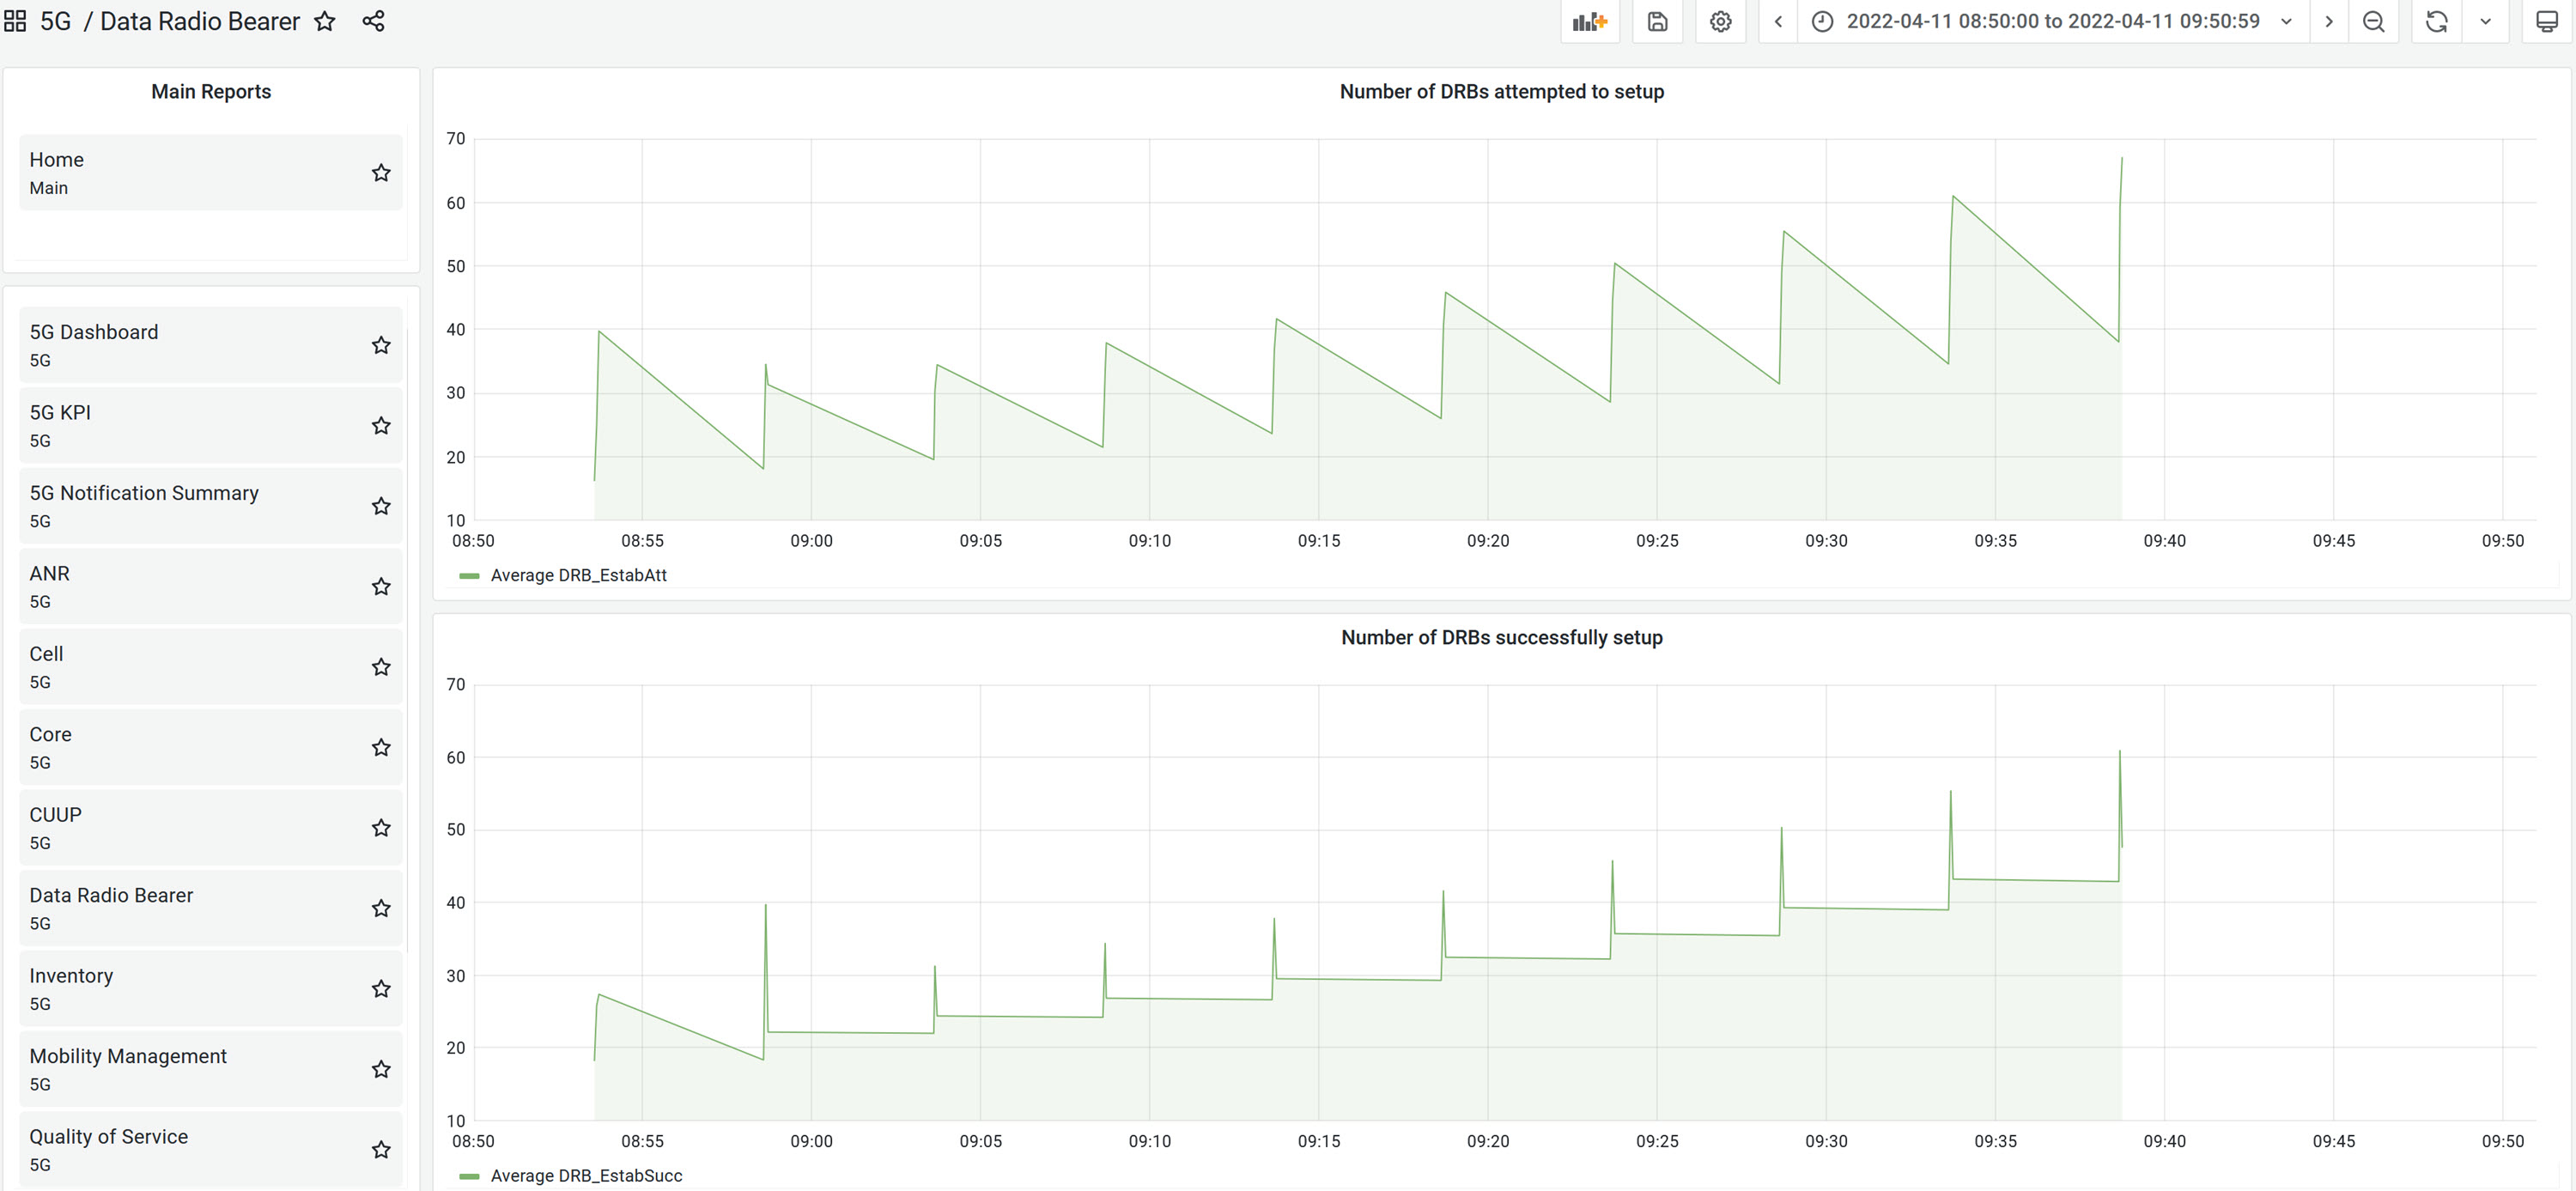
- To view 5G Data Radio Bearer report, click Data Radio Bearer.
- To view 5G Inventory report, click Inventory.

- To view 5G Mobility Management report, click Mobility Management.

