


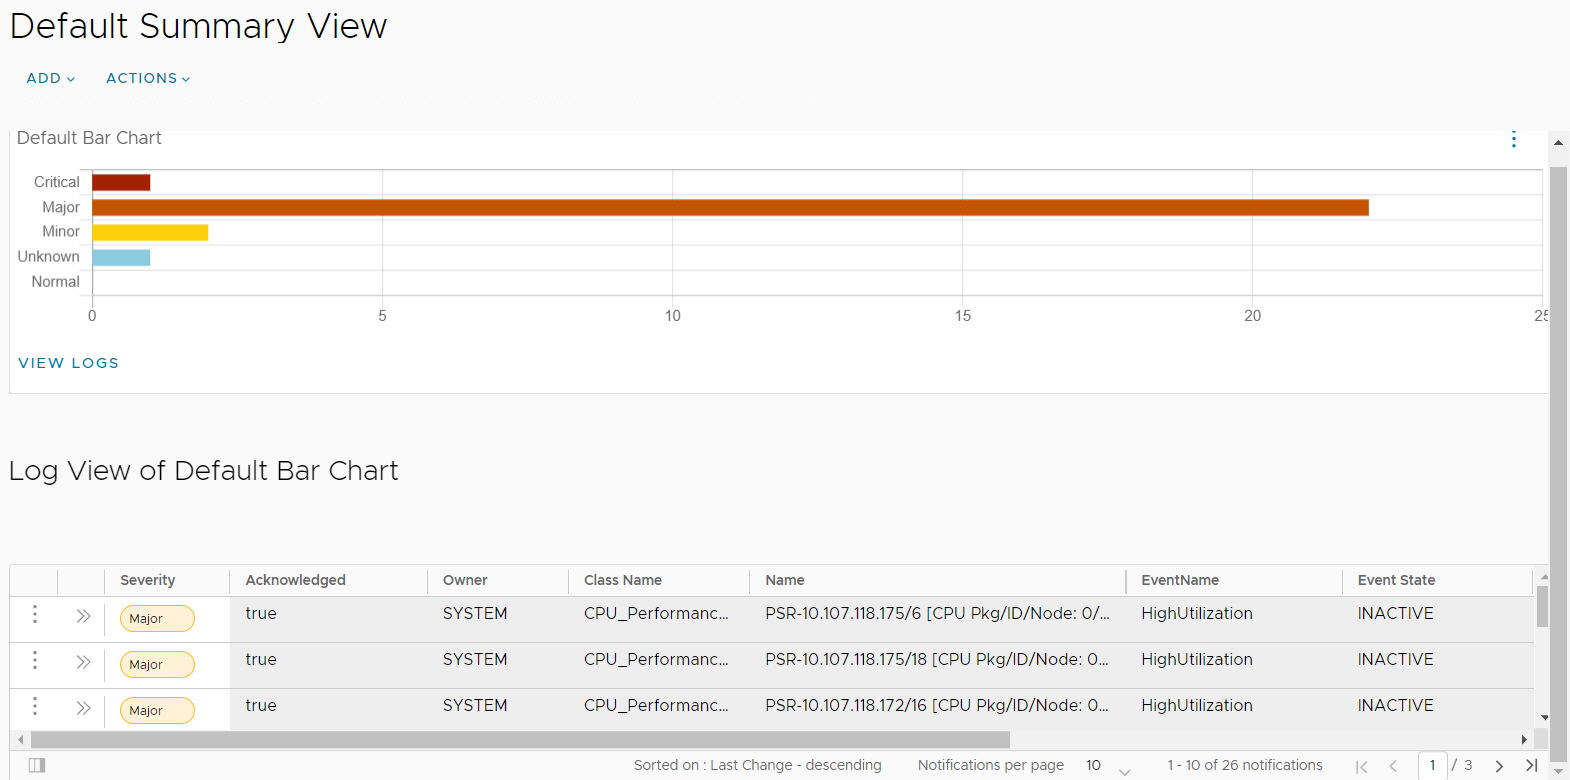
The Notifications Summary View provides a graphical display of the information as a form of Bar Chart. Also, Log View of Default Bar Chart is displayed in the Summary View console. By default, a summary is updated continuously.
Default Summary View Page
To view the default summary view page, navigate to , where the default created notification displays.
You can perform the following operations:
- Add summary view: Allows you to add a new summary view.
- Edit summary view: Allows you to edit existing summary view.
- Clone summary view: Allows you to clone the complete summary view, and also to update preferences of the cloned summary view including name.
- Add chart: Allows you to create the bar charts.
- View logs: Allows you to view the notification log.
- Clone: Allows you to clone the existing chart. To clone chart, click ellipsis icon (three vertical dots) and select Clone option in Default Summary View.
Also, you can create multiple summary views. The multiple summary views are filtered based on location, region, technology, and class name.
The Default Bar Chart represents the number of notifications categorized by the severity level.
The
Log View of Default Bar Chart provide following information:
- Notification Name (Event Name)
- State (Active or Inactive)
- Acknowledgment status (True or False)
- Severity
- Source
- Owner
- Impacted Class Name
- Impacted Element Name (or IP address)
- Impacted Instance Name (or IP address)
- Business Impact
- Occurrence Counts.
You can customize the columns of the log view, to see the notifications of your choice, see the Customize Notification View for more information.
