


In this topic, you can find information about creating an Analytics Definition from Operations UI.
Prerequisites
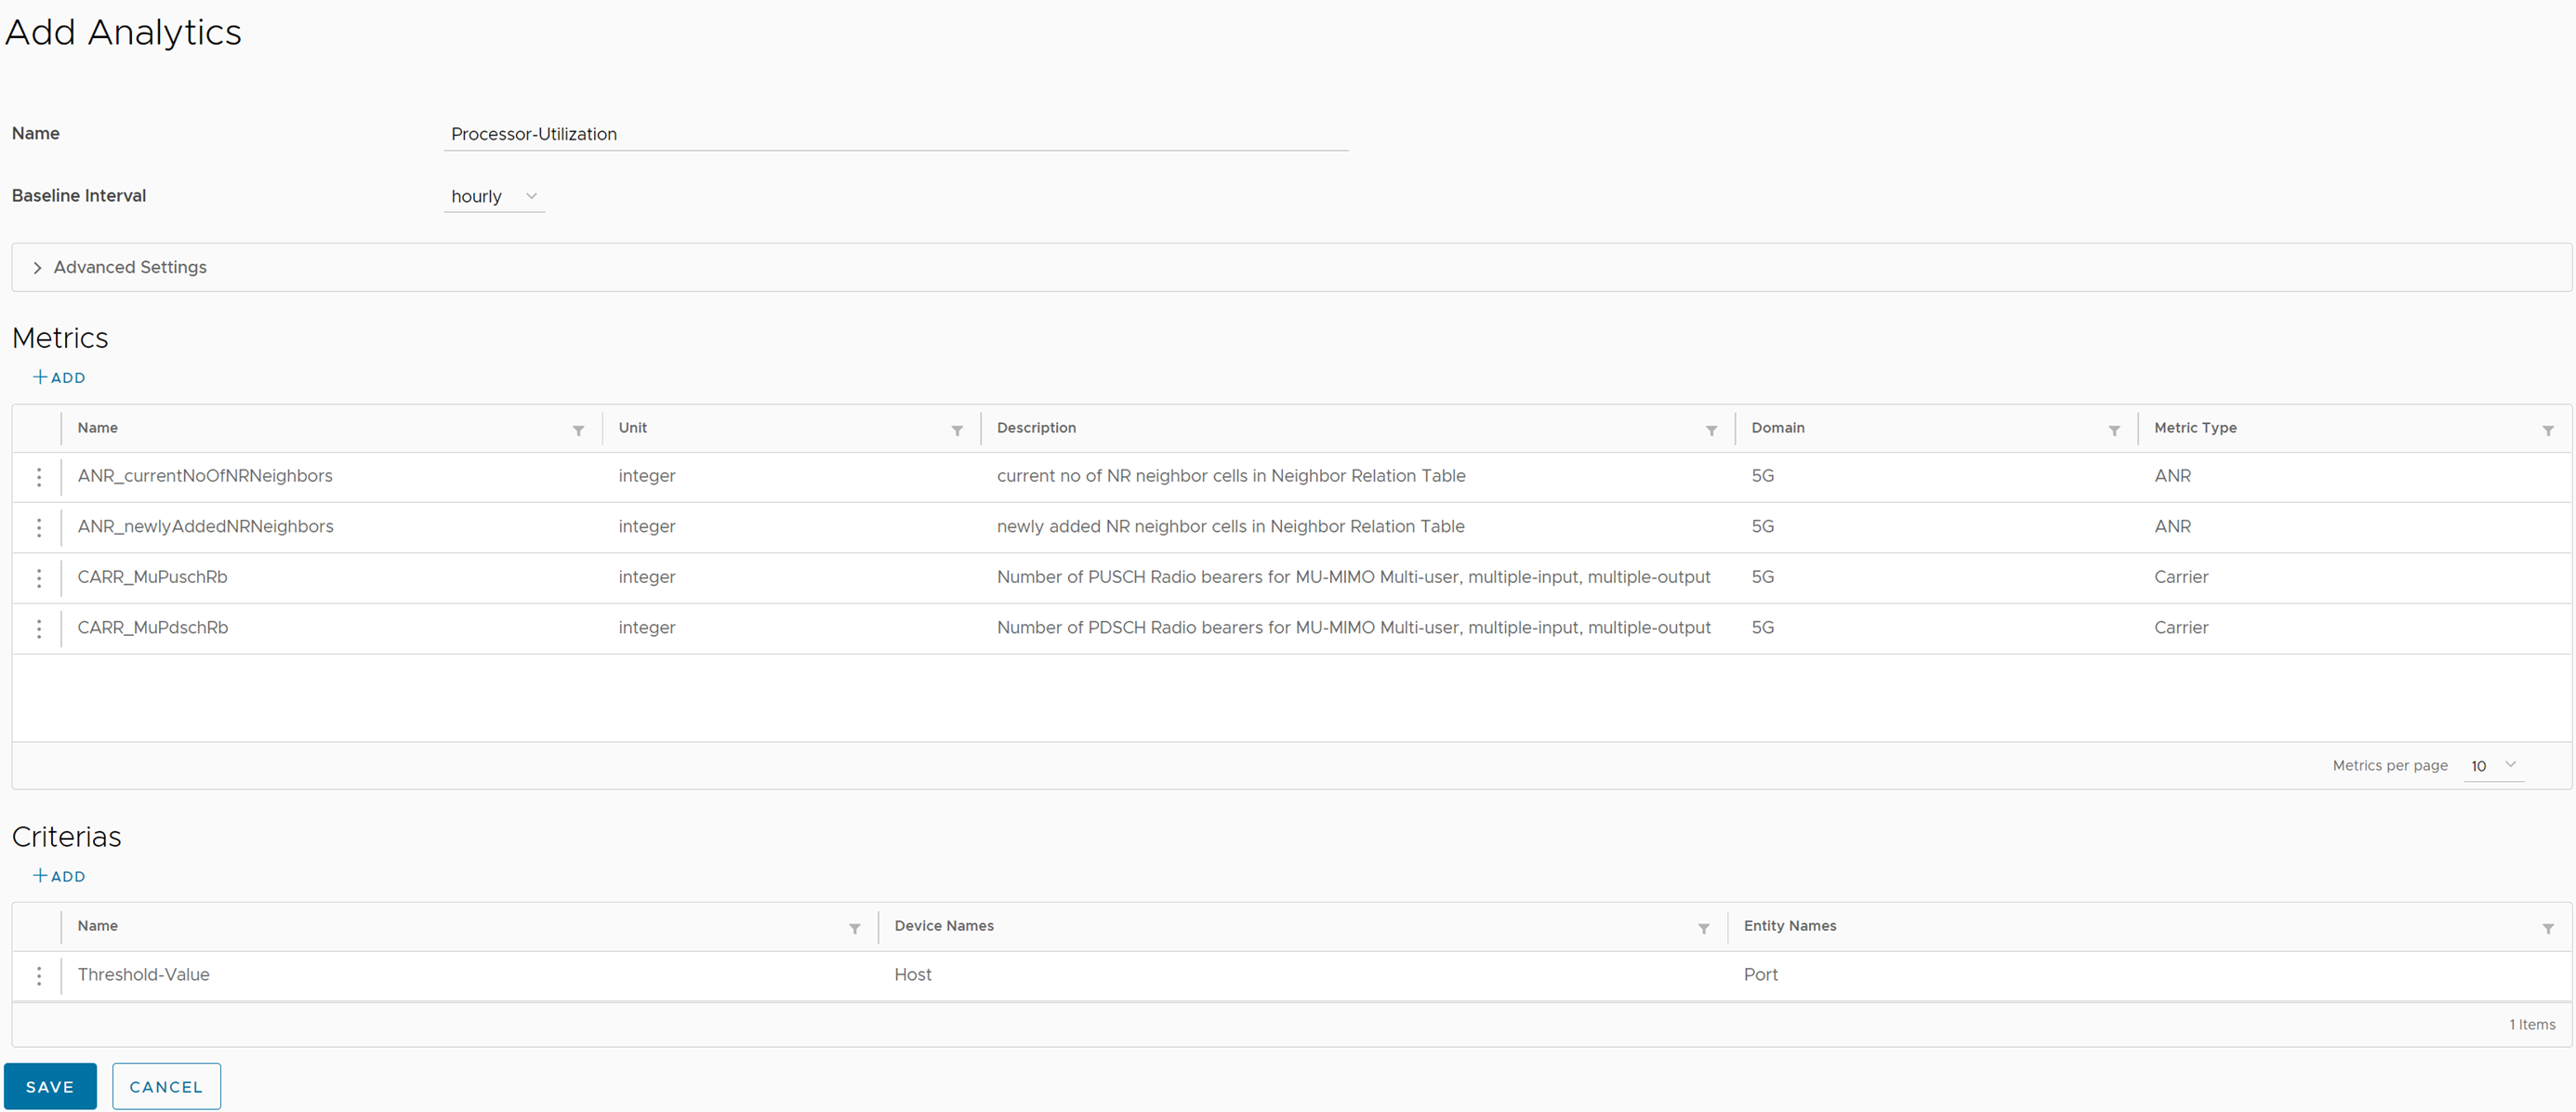
Procedure
- Click Save.
 Note: If you want to edit existing definitions, then you need to wait until duration completes (for example, approx. one hour for hourly definition) for edited parameters to take effect.
