


In this topic, you can find information about deploying the Dashboards and Reports.
To deploy the Dashboards and Reports, follow the procedure:
- Go to VMware Telco Cloud Service Assurance UI. See the, Start VMware Telco Cloud Service Assurance in VMware Telco Cloud Service Assurance User Guide, for more information.
- To navigate to Grafana, click Dashboards & Reports.
- Configure the data source in Grafana:
- Click Configuration.
- Select Data Sources.
- To add Elasticsearch details, click Add data source.
- To configure Elasticserach URL, click Elasticsearch.
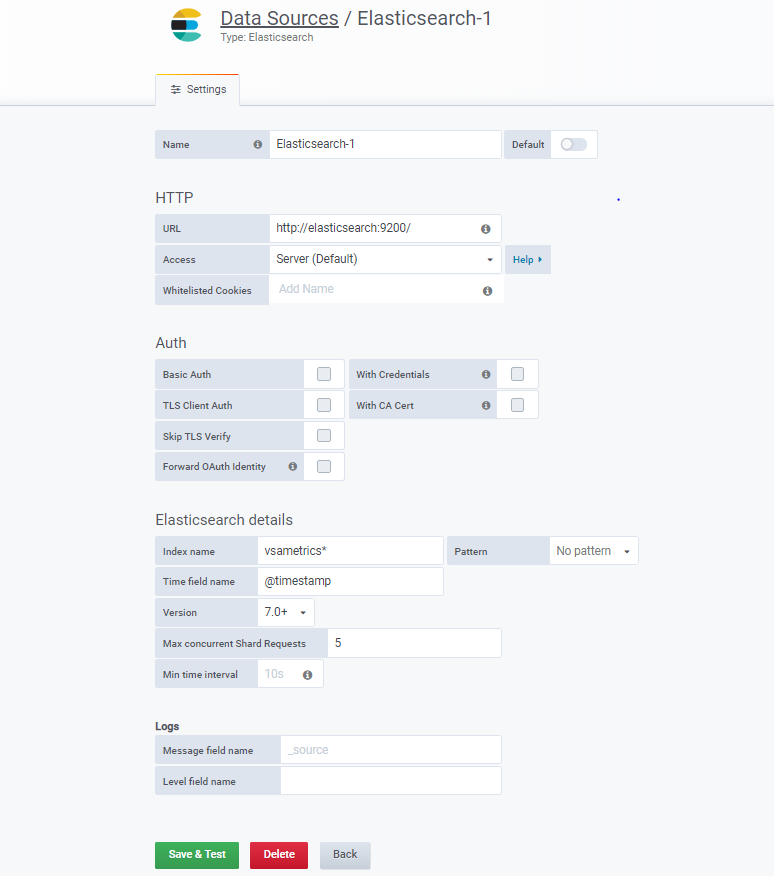
- Click Save & Test.
