The Bar Gauge widget displays the absolute aggregated value of a single indicator. This graph uses the lower and upper bounds settings to restrict the gauge range and the minor and critical thresholds to apply color-coding on it. With the Bar Gauge widget, you get an instantaneous snapshot of the health of a specific indicator.
Drill down links can be added to the Bar Gauge widget for each Bars by providing the URL of the reports to be launched in the Data Link as shown in following example:
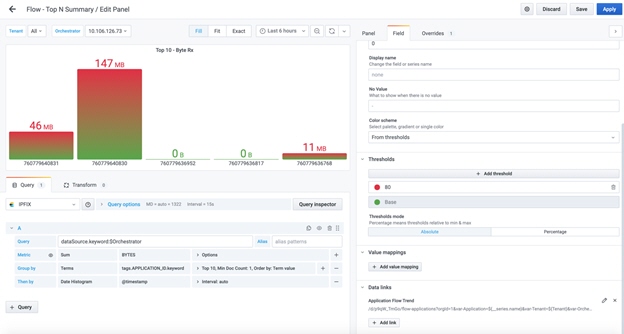
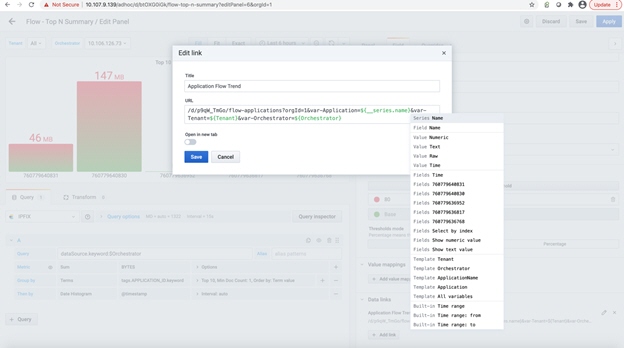
Example URL : d/p9qW_TmGo/flow-applications?orgId=1&var-Application=${__series.name}&var-Tenant=${Tenant}&var-Orchestrator=${Orchestrator}
Report to be launched : flow-applications
- ${__series.name} - is the entity name shown for the Bar.
- ${__Tenant} - value of the Tenant template variable selected for this specific dashboard.
- ${__ Orchestrator } - value of the Orchestrator template variable selected for this specific dashboard.
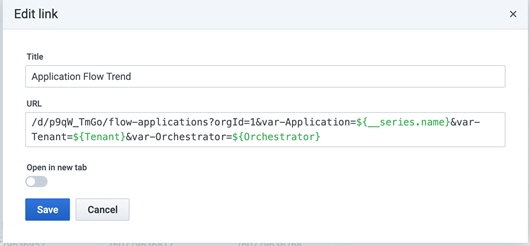
After adding the URL, the drill down can be launched by clicking on the Bar and selecting the Data link as shown below:
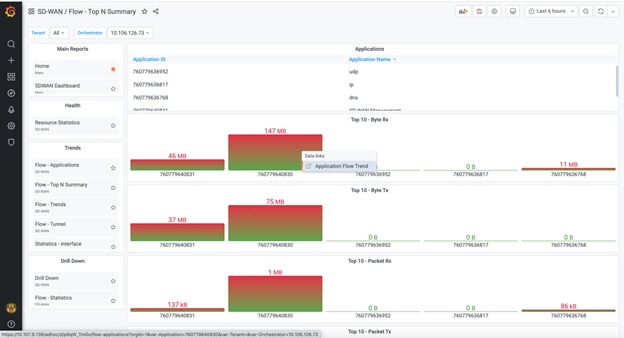
Click Flow-Applications report, to view launch and view the Bar name.