


In this section, you can find information on how to view Pipeline reports.
Prerequisites
Ensure that you configure VMware Telco Cloud Service Assurance Edge Kafka credentials in the Airflow. For more information, see step 1 of prerequisites in Configure Connections to Pipeline Reports topic.
To start the data flow, you must start the Kafka Mapper and Kafka Collector. For more information, see Add Kafka Mapping and Configuring the Kafka Collector topic in VMware Telco Cloud Service Assurance Configuration Guide.Procedure
- To view 5G Pipeline Stage Results, click TCA Pipeline Stage Results.
You can see the VMware Telco Cloud Automation Pipeline Stage Results Summary results. This dashboard shows the successful and failed VMware Telco Cloud Automation pipeline results for all three stages. Click on the success or failed parts in the pie chart to see the details of the results.
Data Model
The following data model represents the status details for TCA Pipeline Stage Results.{ "site_id":"esx-192-168-103-163", "fsm_state":"S3", "fsm_status":"Failed", "error_msg":"E_INTERNAL_ERROR", "timestamp":"2022-09-29 09:12:52.501344", "additional_data":{ "task":"cnf_create", "event":"ended", "dagrunid":"manual__2022-09-29T05:03:58+00:00", "logs":"1 out of 1 CNFs failed. Details: CNF {\"cnf_name\": \"esx-192-168-103-163-du\", \"error\": \"E_INTERNAL_ERROR\", \"message\": \"CNF Create API for esx-192-168-103-163-du with Id nfd_ec300bd1-6cdb-4b34-94f3-e56cf50a9ce4 errored. Error: Instance with name 'esx-192-168-103-163-du' already exists. Please choose a different name.\"}" } }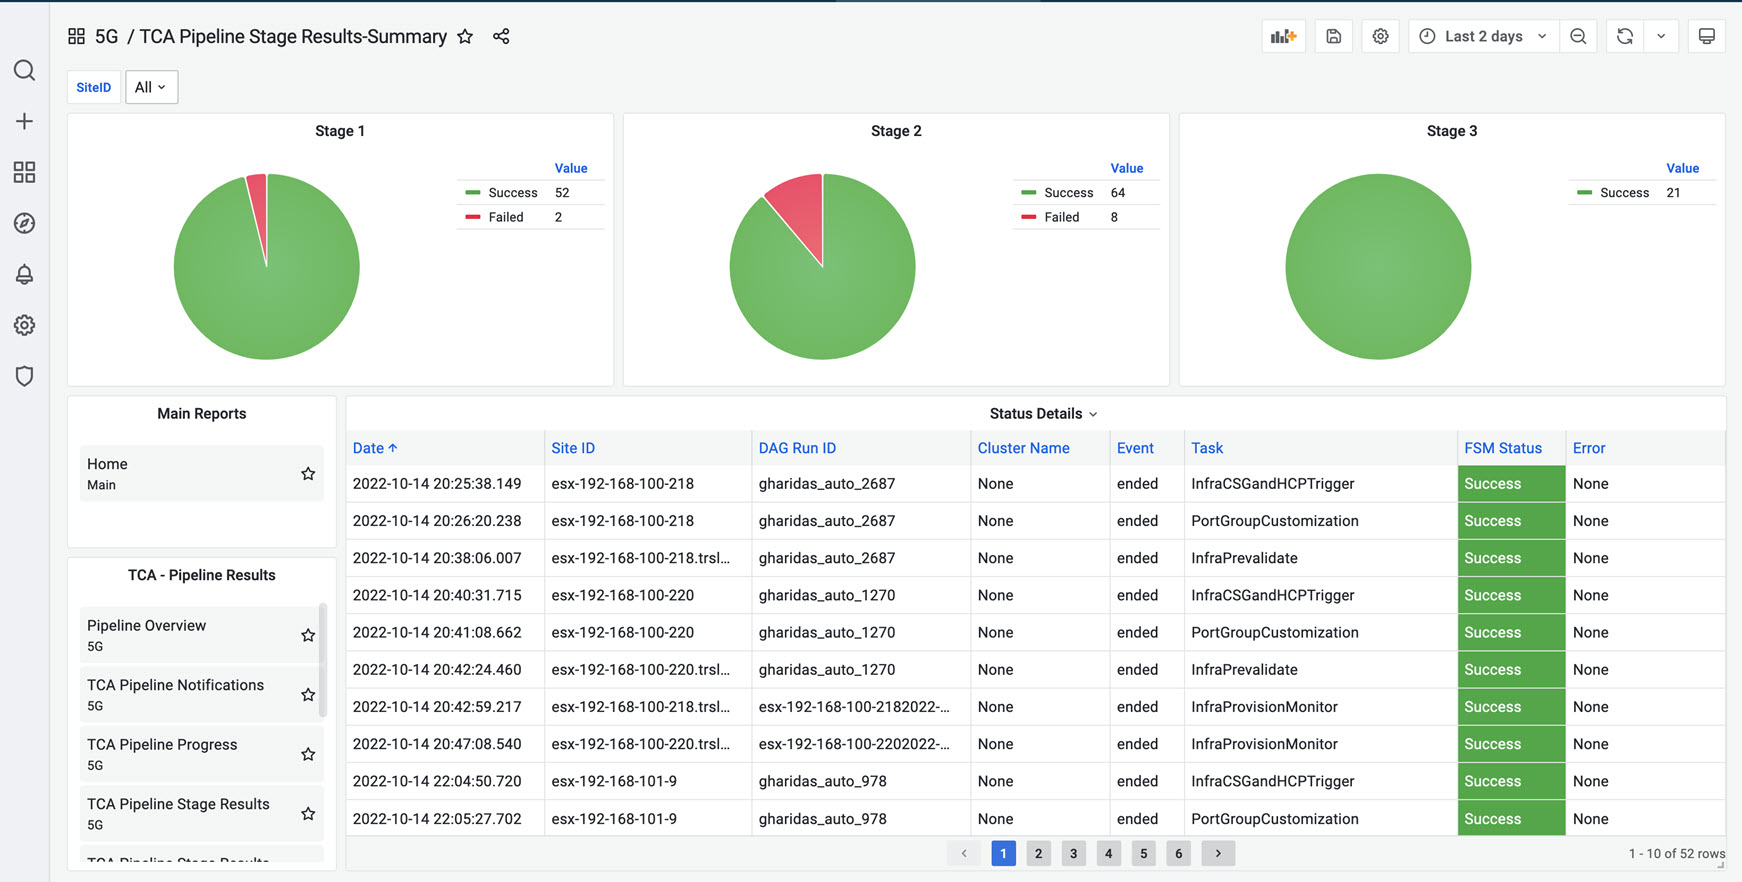
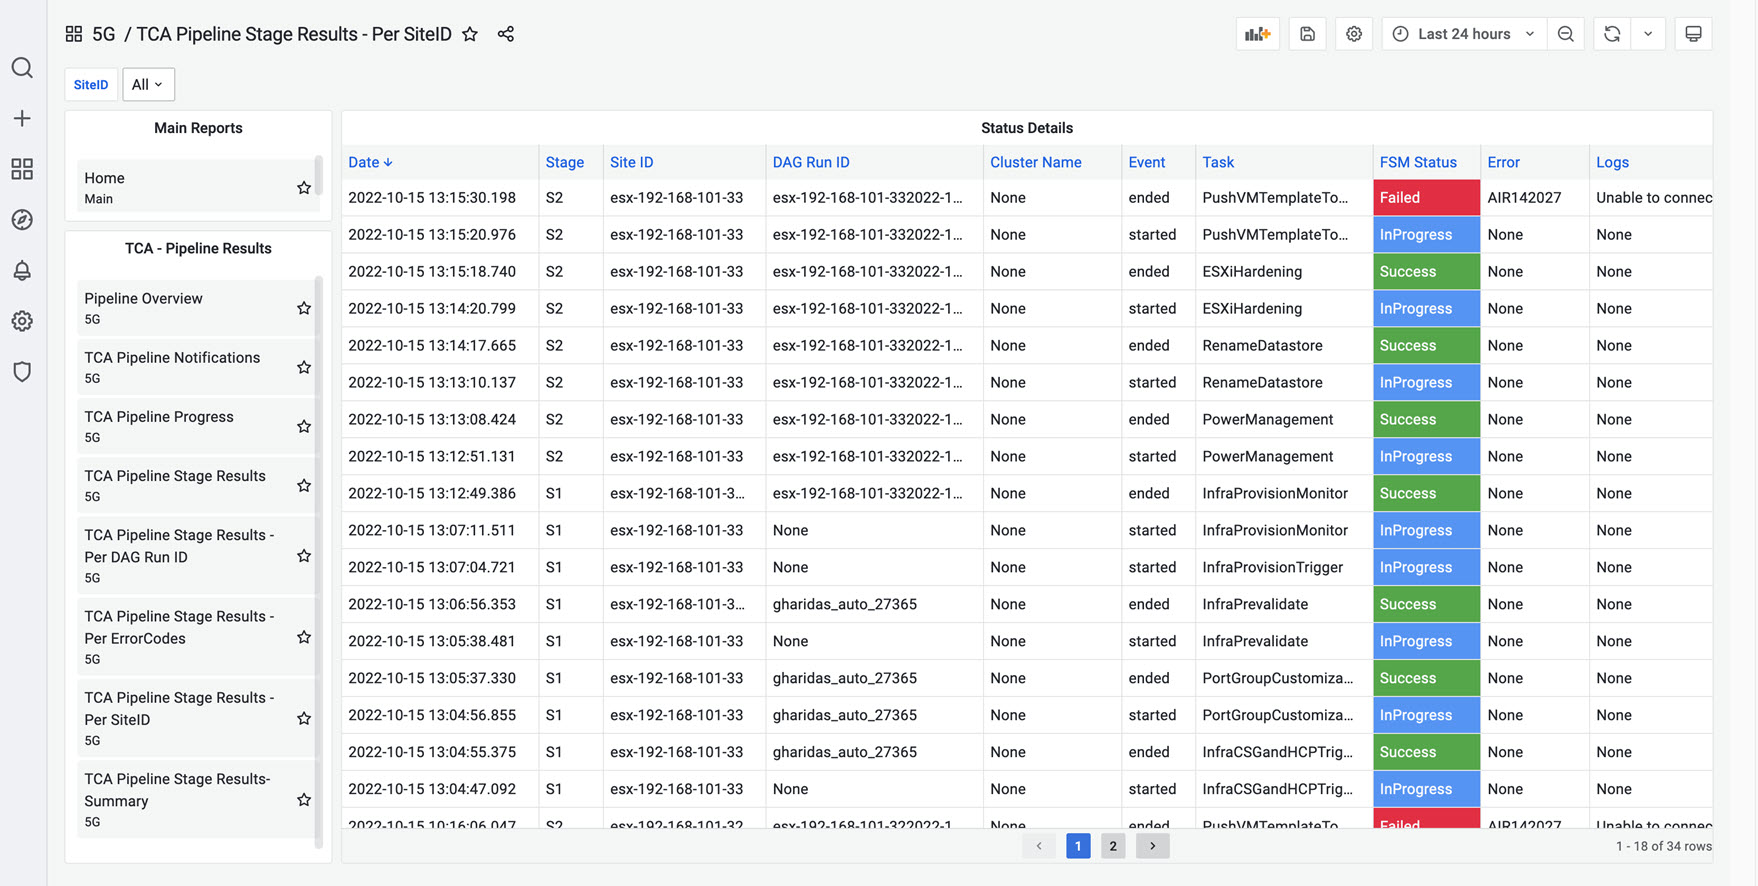
- VMware Telco Cloud Automation Pipeline Stage Results - Per SiteID: This report shows the VMware Telco Cloud Automation pipeline results per SiteID. Select or type in the SiteID in the SiteID filter variable. By default, the report shows the pipeline results for all SiteID. The default time interval is for 24 hours. To view the results prior to 24 hours, select the required time interval. To view the results in sequential order, click on the Date column in the Status Details table.
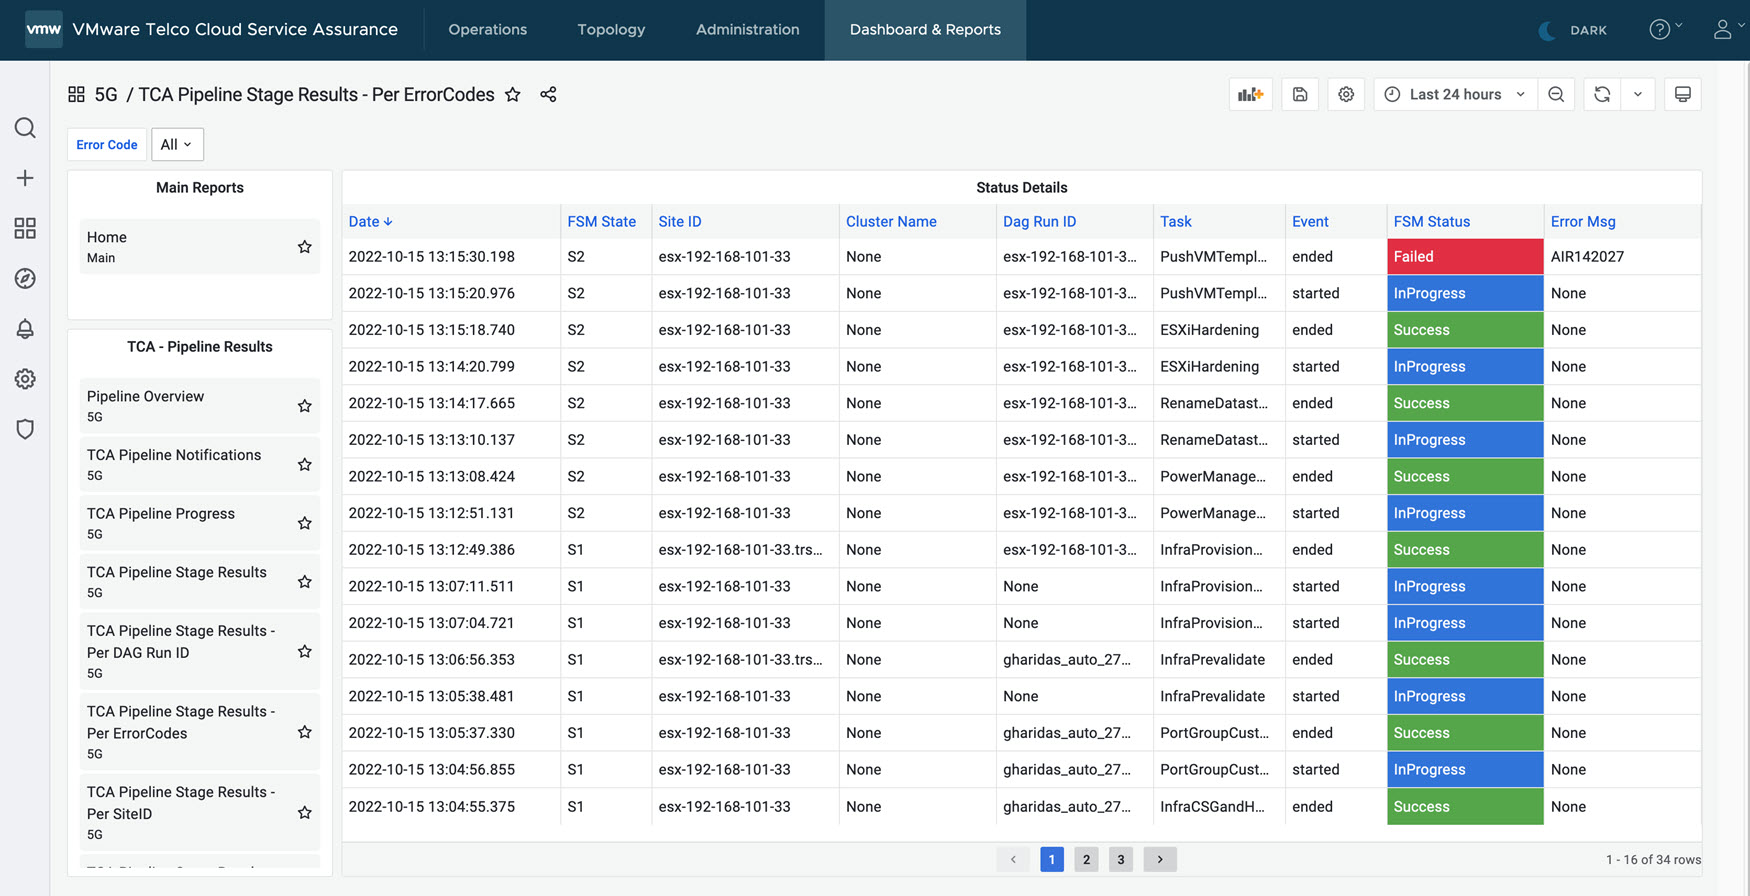
- VMware Telco Cloud Automation Pipeline Stage Results - ErrorCodes: This report shows the VMware Telco Cloud Automation pipeline results per ErrorCode in the ErrorCode filter variable. By default, the report shows the pipeline results for all ErrorCodes. The default time interval is for 24 hours. To view the results prior to 24 hours, select the required time interval. To view the results in sequential order, click on the Date column in the Status Details table.
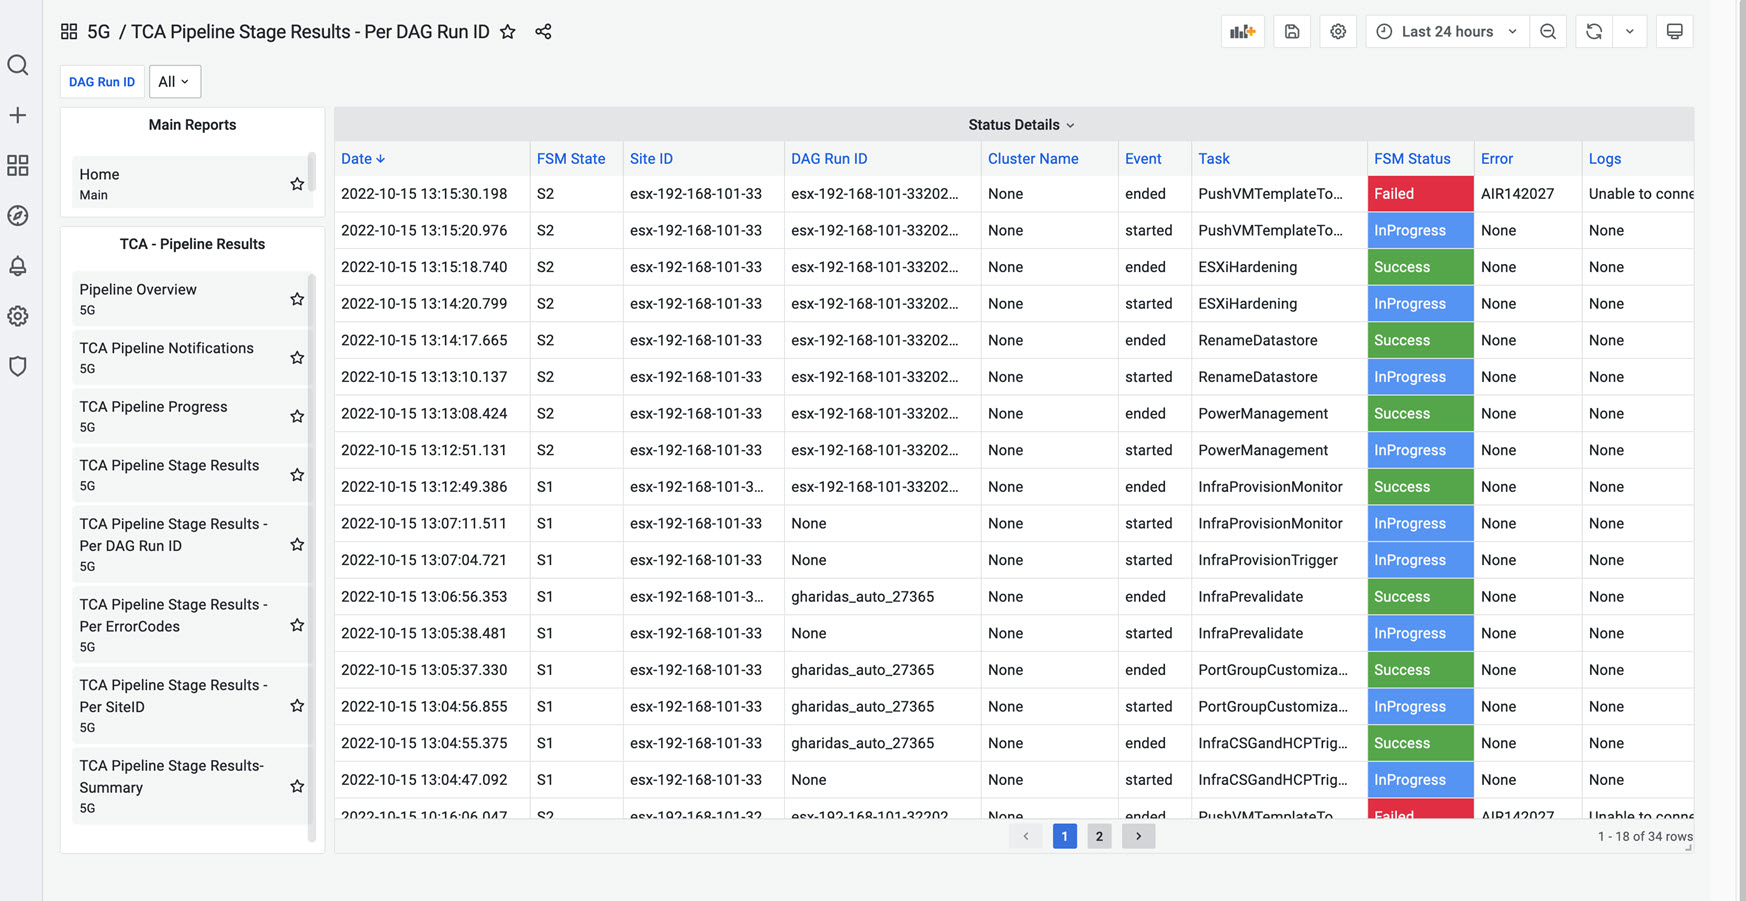
- VMware Telco Cloud Automation Pipeline Stage Results - DAG Run ID: This report shows the VMware Telco Cloud Automation pipeline results per DAG Run ID. Select or type in the DAG Run ID in the DAG Run ID filter variable. By default, the report shows the pipeline results for all DAG Run ID. The default time interval is for 24 hours. To view the results prior to 24 hours, select the required time interval. To view the results in sequential order, click on the Date column in the Status Details table.
- VMware Telco Cloud Automation Pipeline Stage Results - Per SiteID: This report shows the VMware Telco Cloud Automation pipeline results per SiteID. Select or type in the SiteID in the SiteID filter variable. By default, the report shows the pipeline results for all SiteID. The default time interval is for 24 hours. To view the results prior to 24 hours, select the required time interval. To view the results in sequential order, click on the Date column in the Status Details table.
