In this section, you can find information on how to add a new report.
Procedure
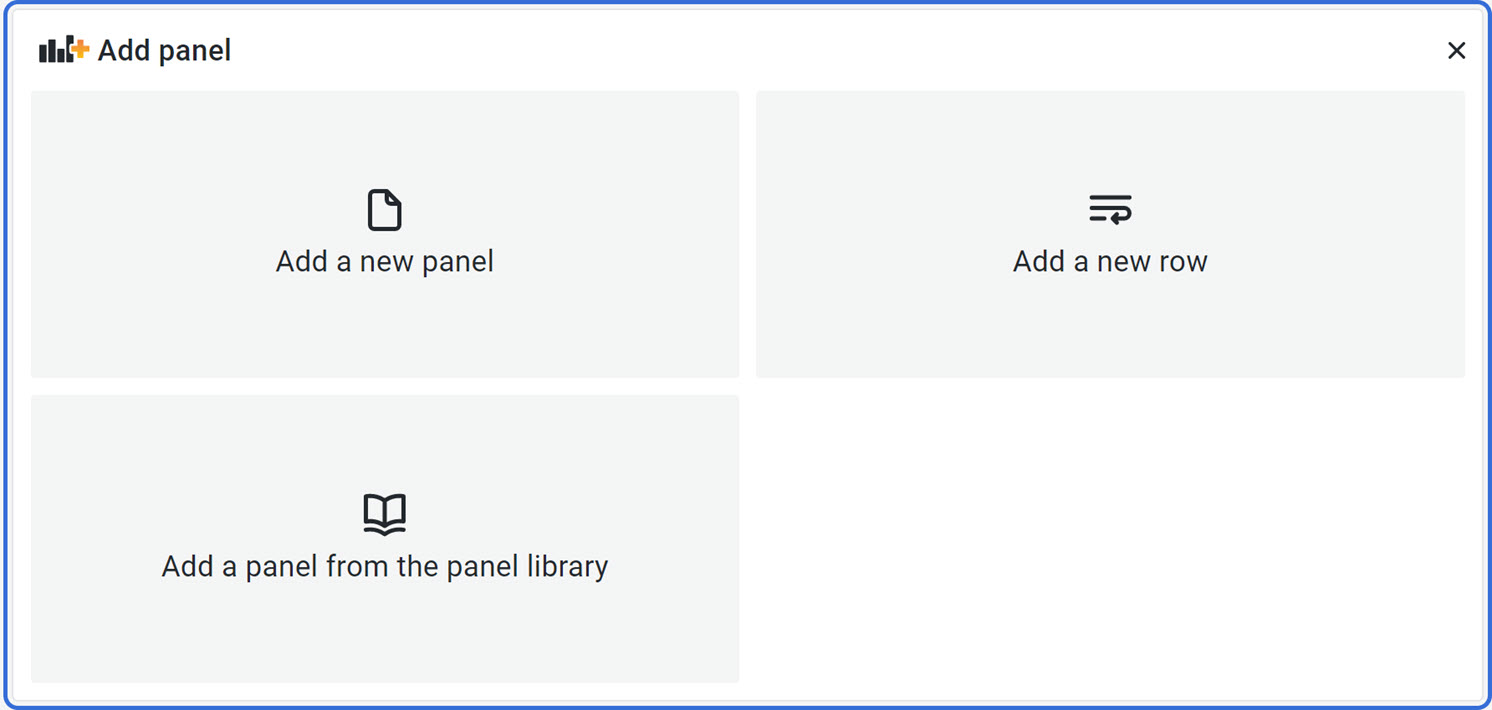
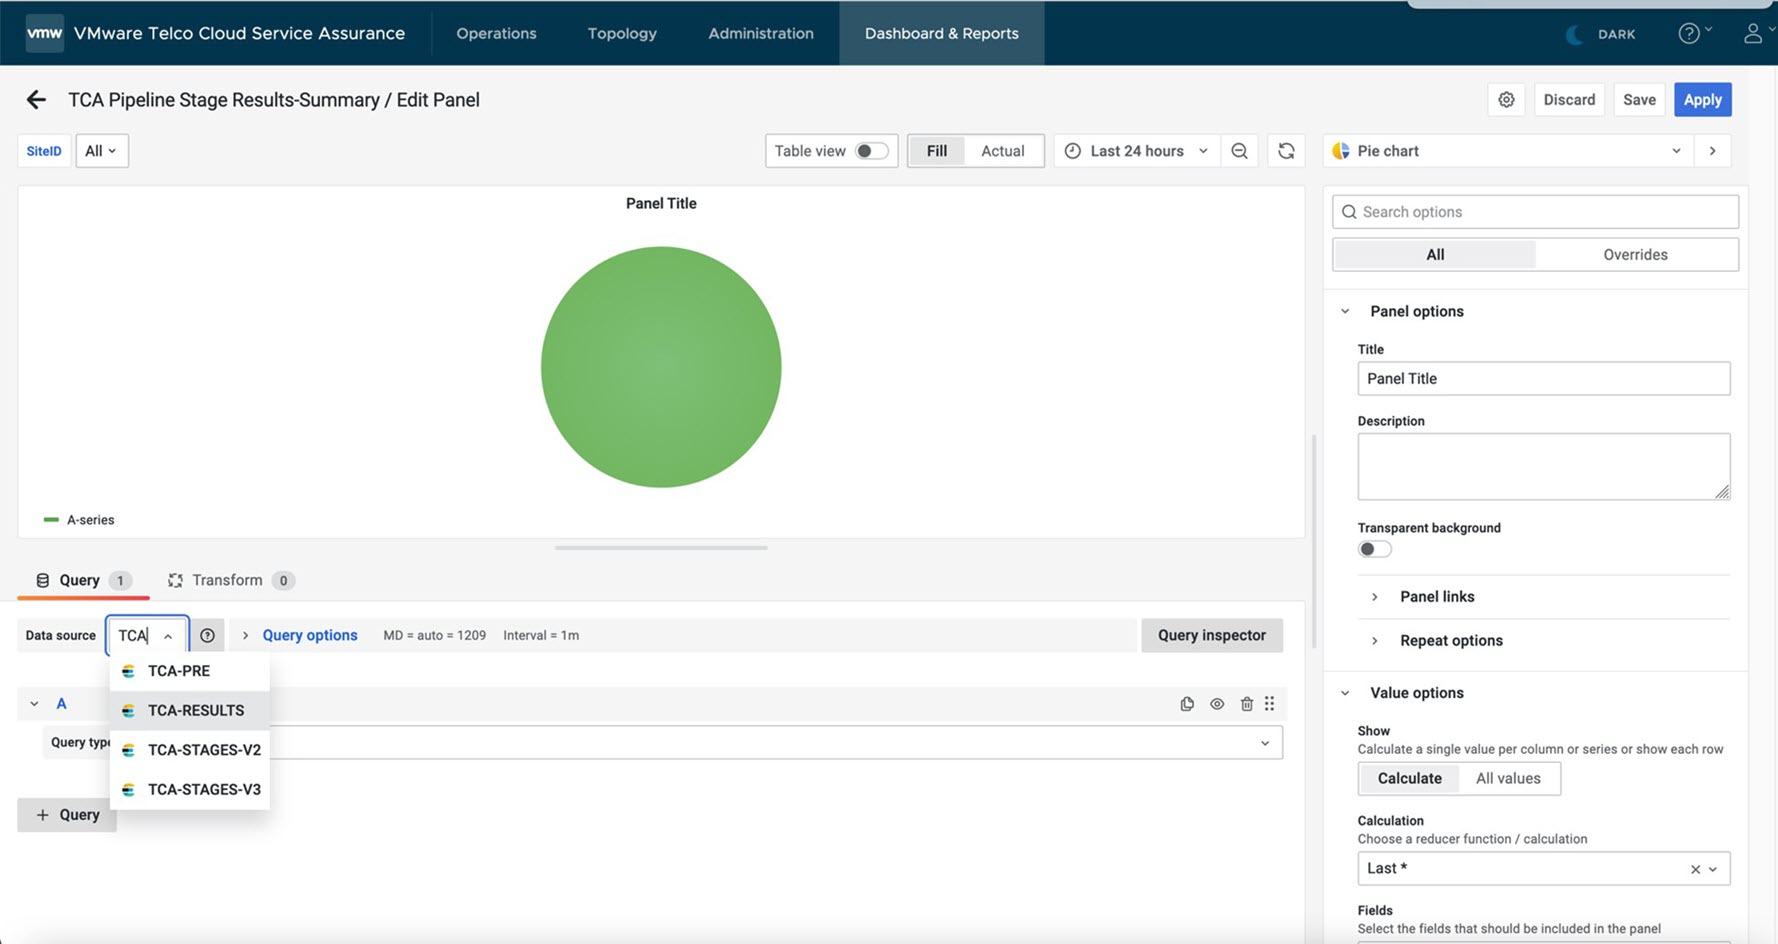
- Select Add panel and click Add a new panel.
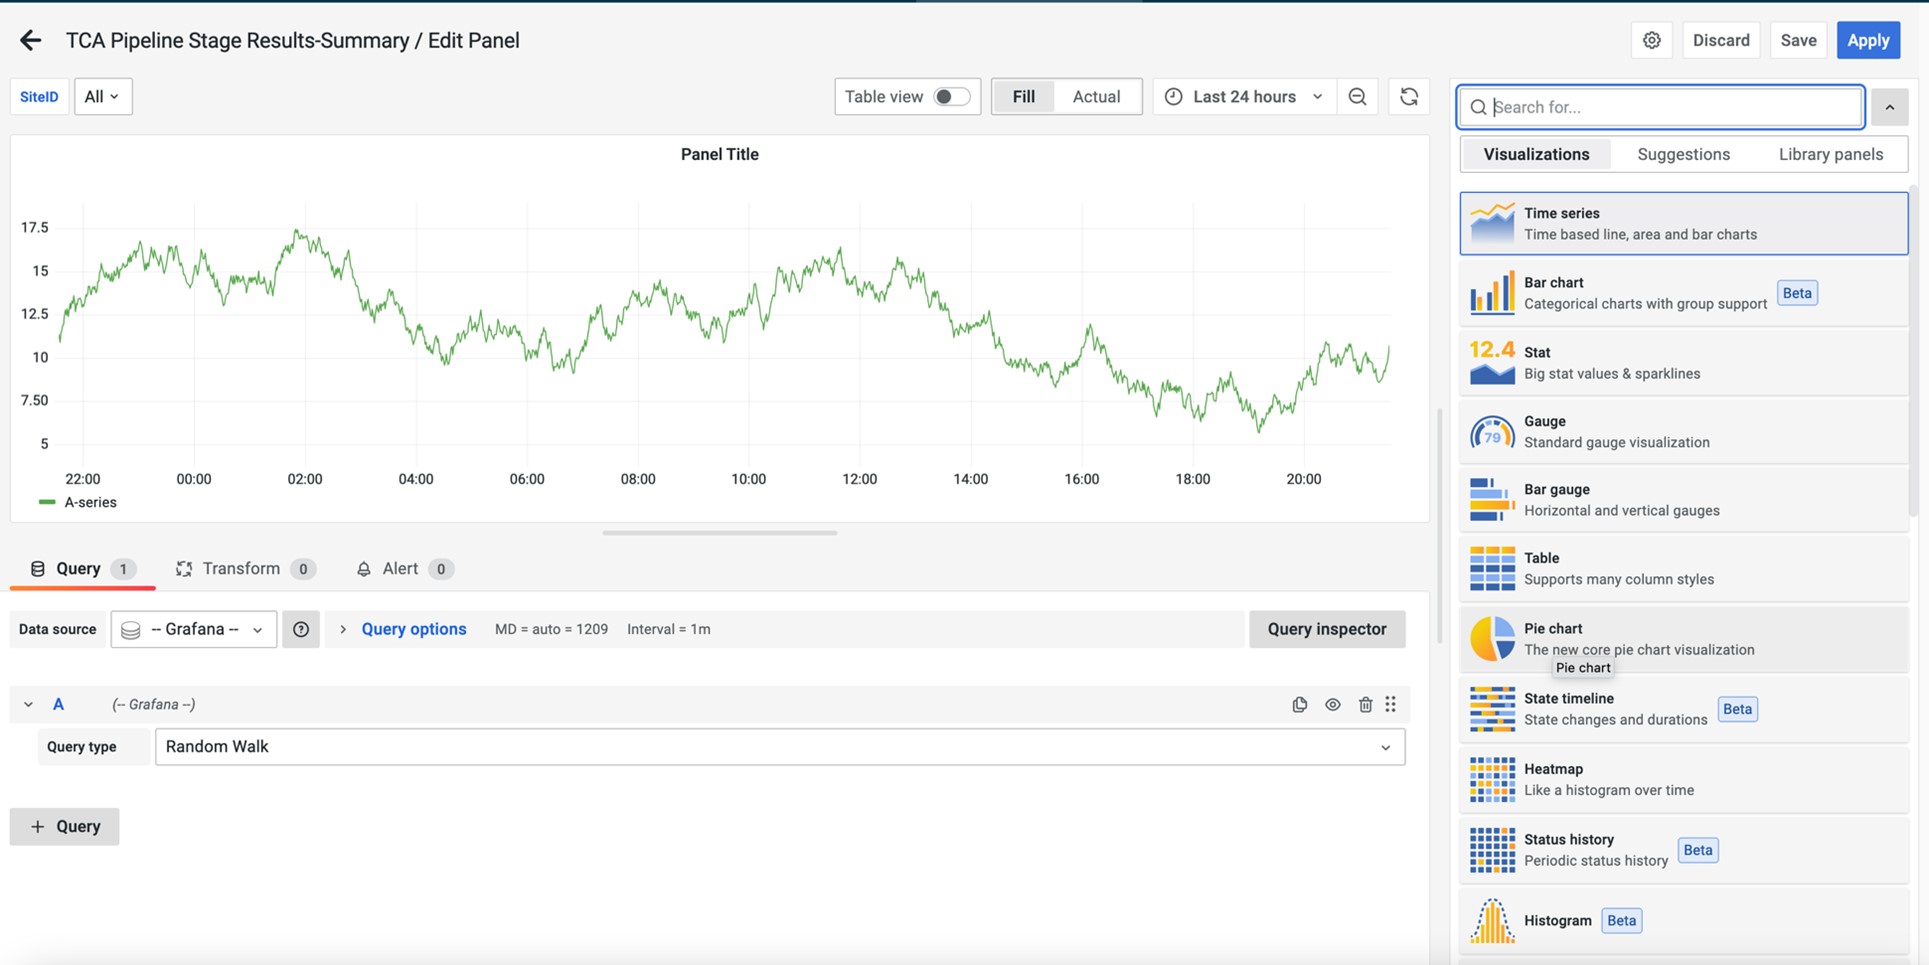
- Select a widget from the list.
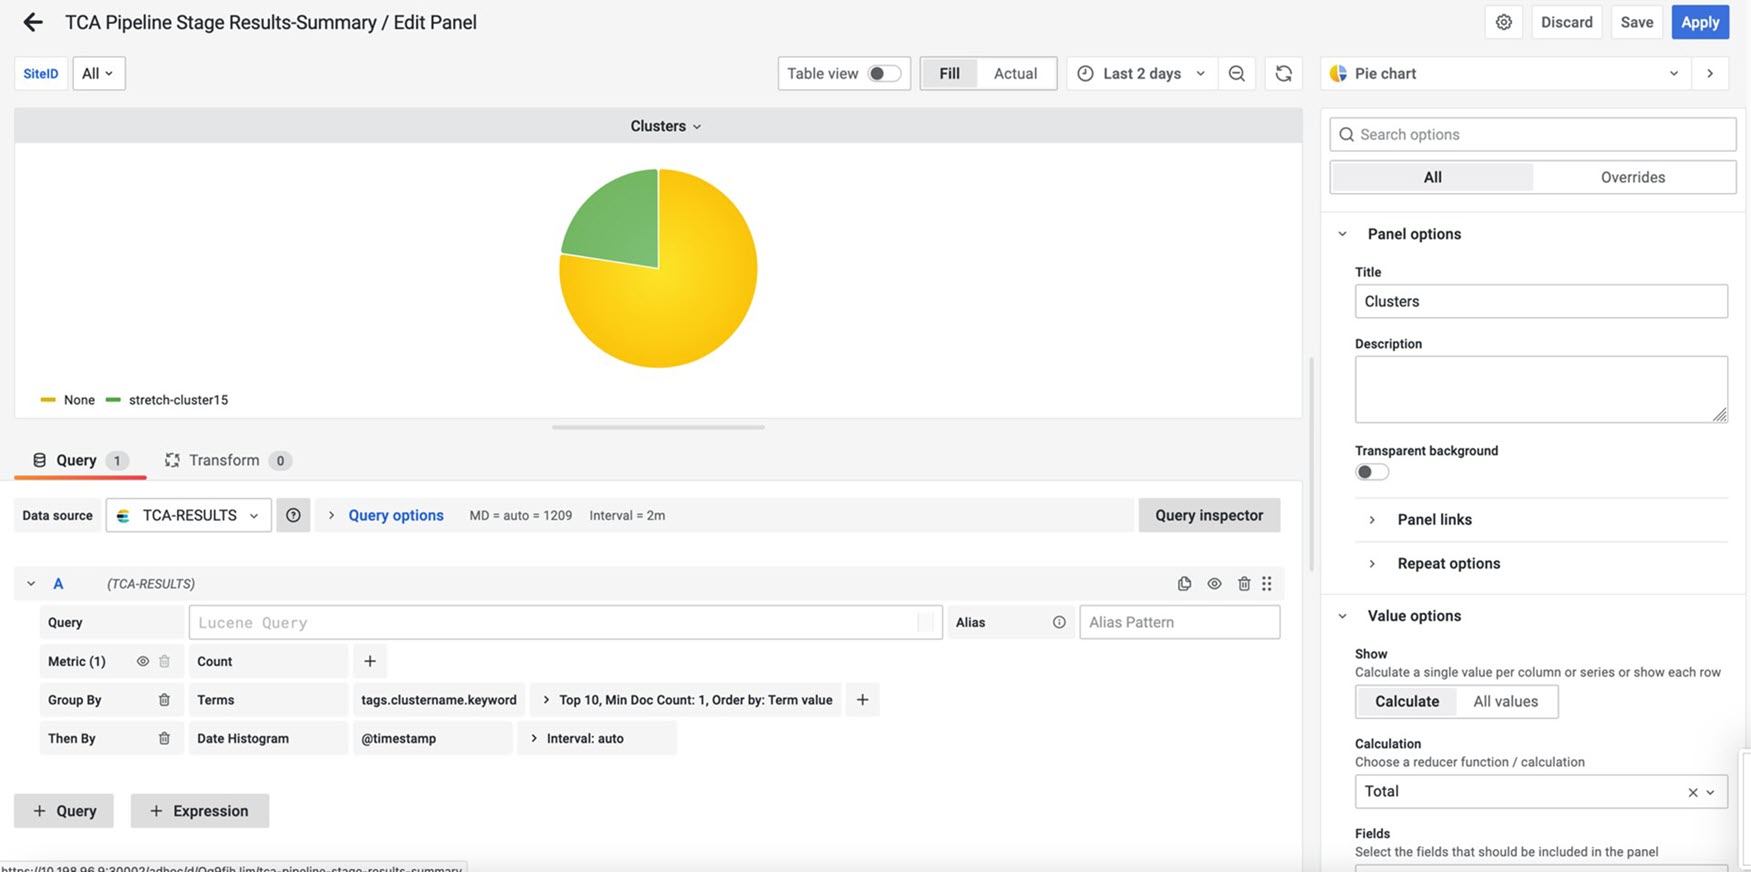
- Select data source as TCA-RESULTS and Pipeline schema attributes as Metric or Group By.
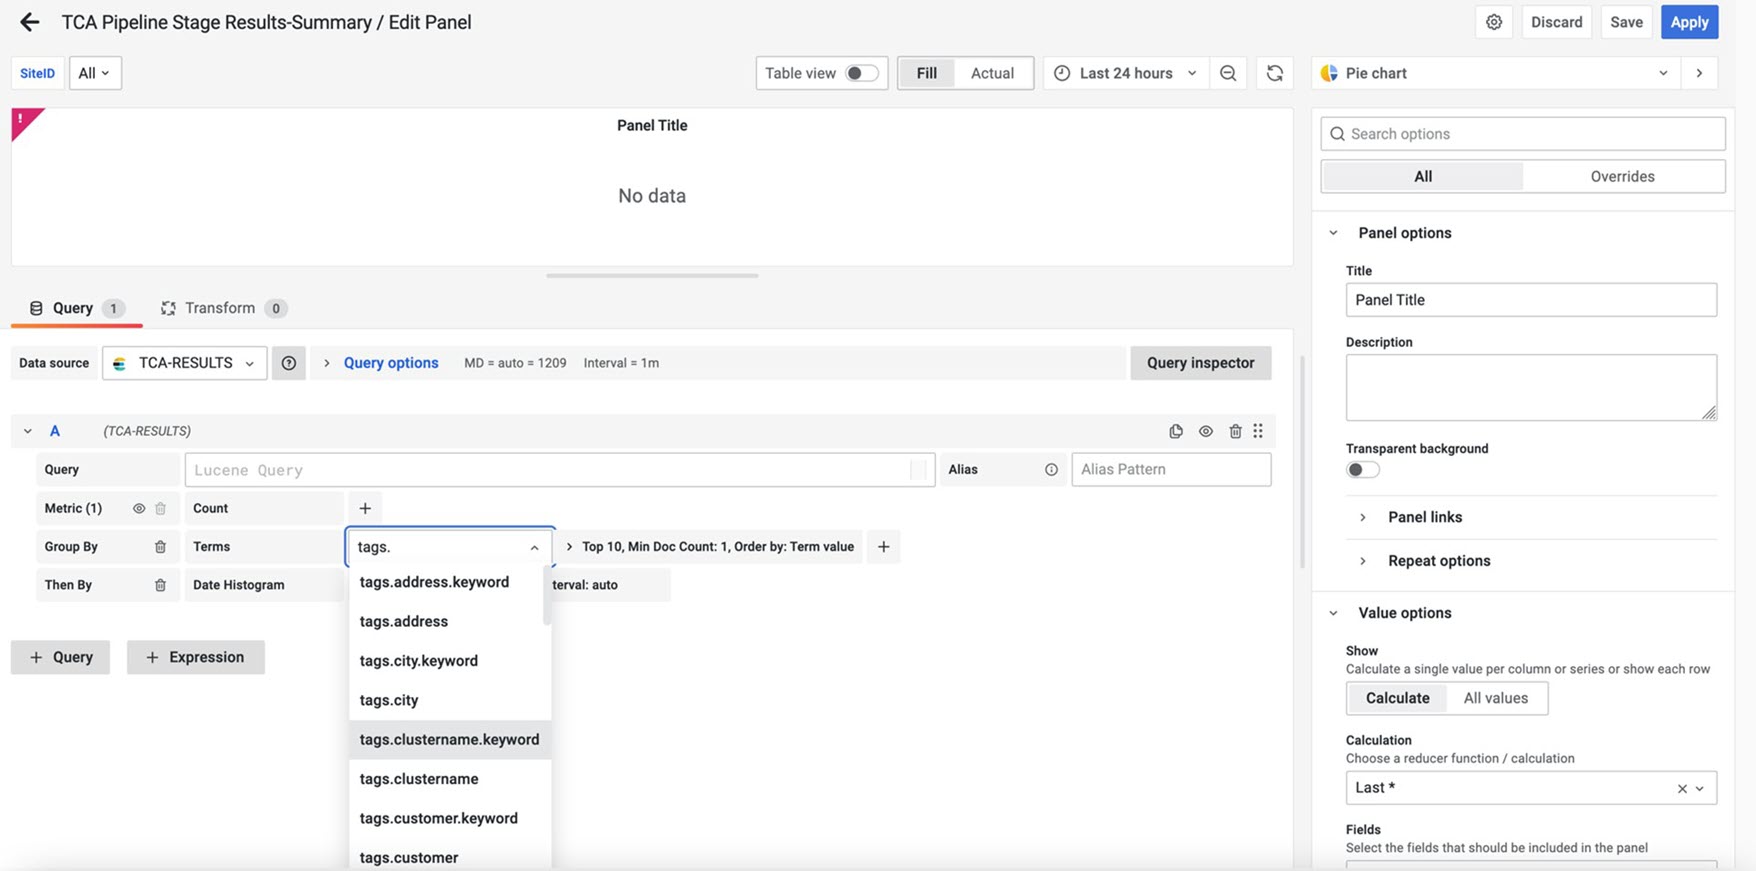 Note: Ensure that the property with
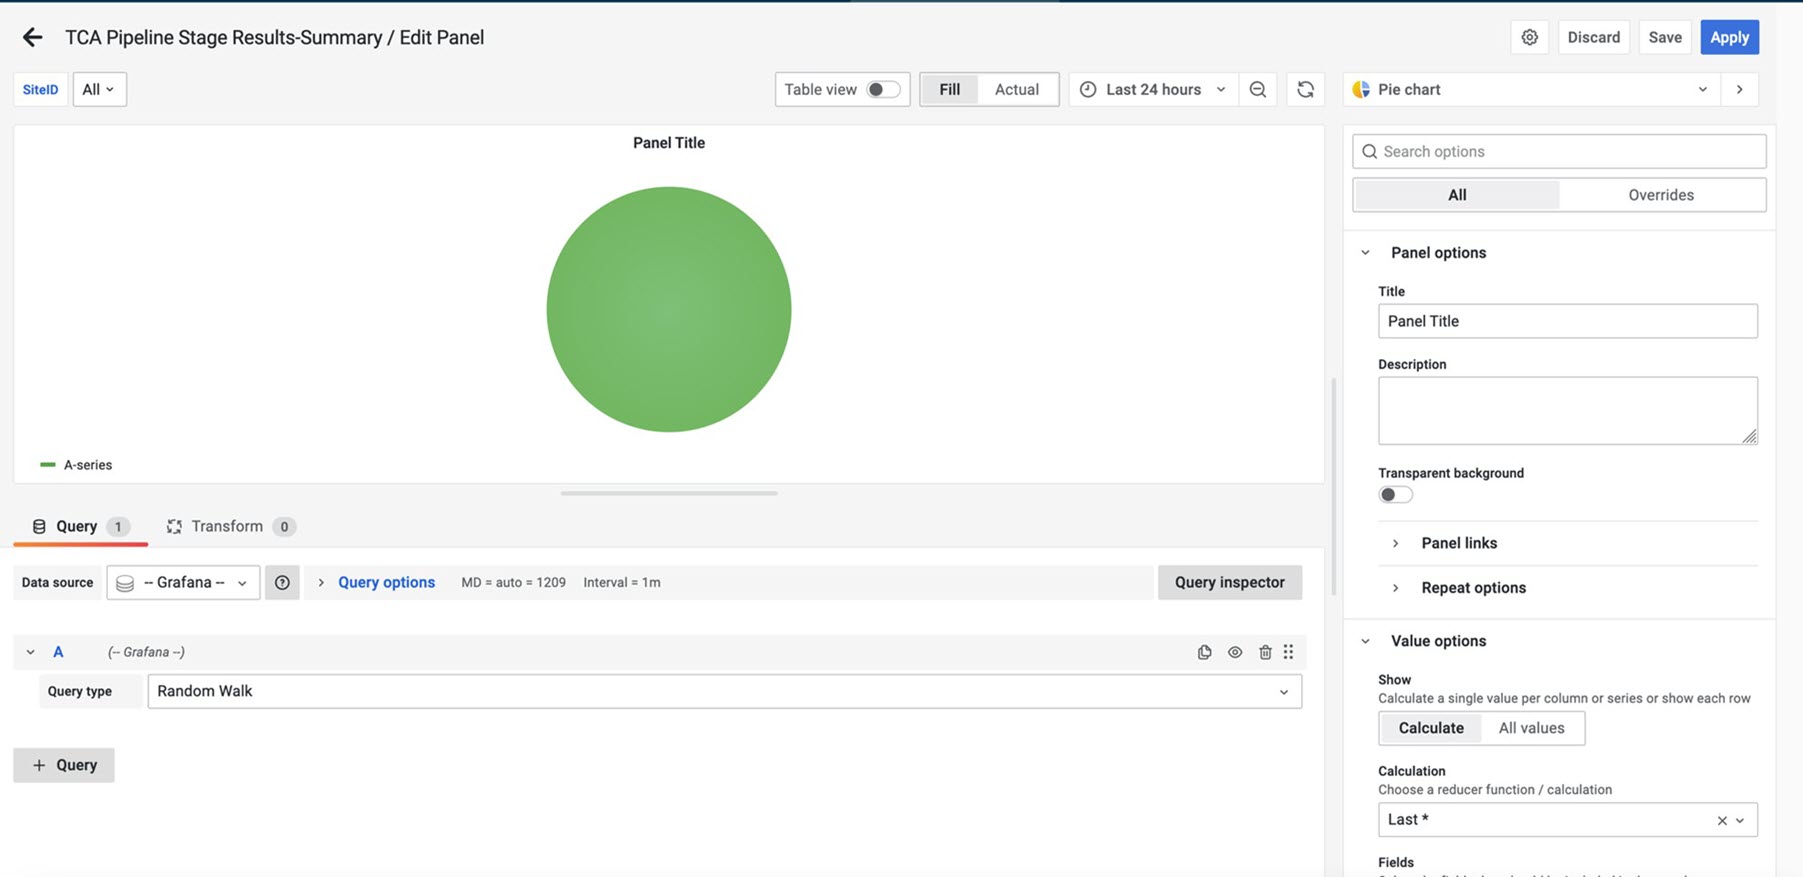
.keywordis selected. - Set the Panel properties.